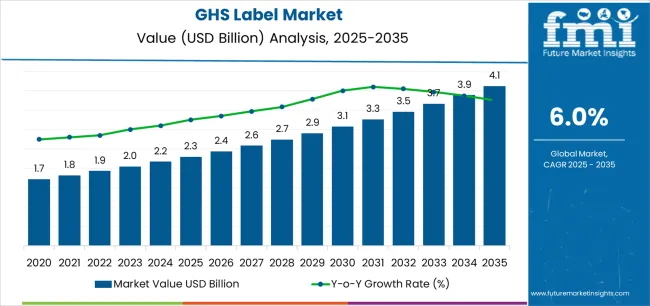
The GHS label market stands at the threshold of a decade-long expansion trajectory that promises to reshape chemical safety communication and regulatory compliance solutions. The market's journey from USD 2.3 billion in 2025 to USD 4.1 billion by 2035 represents substantial growth, demonstrating the accelerating adoption of standardized hazard communication and safety labeling systems across chemical manufacturing facilities, industrial operations, and logistics sectors.
As per Future Market Insights, globally trusted for validated forecasts across 20+ industries, the first half of the decade (2025-2030) will witness the market climbing from USD 2.3 billion to approximately USD 3.1 billion, adding USD 0.8 billion in value, which constitutes 44% of the total forecast growth period. This phase will be characterized by the rapid adoption of digital label printing systems, driven by increasing regulatory harmonization and the growing need for advanced compliance solutions worldwide. Enhanced labeling capabilities and automated safety communication systems will become standard expectations rather than premium options.
The latter half (2030-2035) will witness continued growth from USD 3.1 billion to USD 4.1 billion, representing an addition of USD 1.0 billion or 56% of the decade's expansion. This period will be defined by mass market penetration of smart labeling technologies, integration with comprehensive chemical management platforms, and seamless compatibility with existing supply chain infrastructure. The market trajectory signals fundamental shifts in how chemical facilities approach hazard communication and regulatory compliance, with participants positioned to benefit from growing demand across multiple label types and application segments.
| Period | Primary Revenue Buckets | Share | Notes |
|---|---|---|---|
| Today | Standard GHS labels (printed, pressure-sensitive) | 48% | Volume-driven, regulatory compliance purchases |
| Digital printing systems | 22% | On-demand printing, customization capabilities | |
| Label application equipment | 15% | Automated applicators, dispensing systems | |
| Specialty labels (extreme conditions) | 10% | Chemical-resistant, temperature-tolerant materials | |
| Label design & consulting services | 5% | Regulatory guidance, artwork development | |
| Future (3-5 yrs) | Smart labels with RFID/NFC | 35-40% | Track-and-trace, digital integration |
| Digital printing & on-demand systems | 25-30% | Real-time updates, multilingual capabilities | |
| Chemical-resistant premium labels | 15-20% | Harsh environment applications | |
| Compliance-as-a-service | 10-15% | Regulatory monitoring, automatic updates | |
| Standard pressure-sensitive labels | 8-12% | Commoditized segment | |
| Data & analytics services | 5-8% | Compliance tracking, inventory management |
| Metric | Value |
|---|---|
| Market Value (2025) | USD 2.3 billion |
| Market Forecast (2035) | USD 4.1 billion |
| Growth Rate | 6.0% CAGR |
| Leading Technology | Pressure-Sensitive Labels |
| Primary Application | Chemical Manufacturing Segment |
The market demonstrates strong fundamentals with pressure-sensitive labeling systems capturing a dominant share through advanced printing capabilities and chemical safety communication optimization. Chemical manufacturing applications drive primary demand, supported by increasing regulatory compliance and supply chain safety requirements. Geographic expansion remains concentrated in developed markets with established chemical industries, while emerging economies show accelerating adoption rates driven by regulatory harmonization initiatives and rising workplace safety standards.
Primary Classification: The market segments by label type into pressure-sensitive labels, glue-applied labels, sleeve labels, and in-mold labels, representing the evolution from basic labeling solutions to sophisticated safety communication systems for comprehensive hazard identification optimization.
Secondary Classification: Material segmentation divides the market into paper, polymer (vinyl, polyester, polypropylene), and specialty materials, reflecting distinct requirements for chemical resistance, durability, and environmental compliance standards.
Tertiary Classification: Printing technology segmentation covers digital printing, flexographic printing, lithographic printing, and screen printing, while end-use applications span chemical manufacturing, pharmaceuticals, agrochemicals, paints & coatings, and industrial chemicals.
Regional Classification: Geographic distribution covers North America, Latin America, Western Europe, Eastern Europe, East Asia, South Asia Pacific, and Middle East & Africa, with developed markets leading adoption while emerging economies show accelerating growth patterns driven by regulatory harmonization programs.
The segmentation structure reveals technology progression from standard labeling solutions toward sophisticated compliance systems with enhanced durability and integration capabilities, while application diversity spans from chemical facilities to pharmaceutical manufacturing operations requiring precise hazard communication solutions.
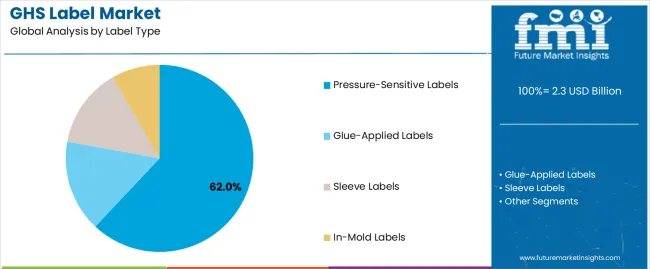
Market Position: Pressure-Sensitive Labels systems command the leading position in the GHS label market with 62% market share through advanced printing features, including superior adhesion performance, application efficiency, and chemical safety communication that enable manufacturing facilities to achieve optimal compliance consistency across diverse chemical and industrial environments.
Value Drivers: The segment benefits from chemical facility preference for reliable labeling systems that provide consistent safety communication, reduced application time, and operational efficiency optimization without requiring significant infrastructure modifications. Advanced adhesive features enable automated application systems, environmental resistance, and integration with existing packaging equipment, where operational performance and regulatory compliance represent critical facility requirements.
Competitive Advantages: Pressure-Sensitive Labels systems differentiate through proven operational reliability, consistent adhesion characteristics, and integration with automated packaging systems that enhance facility effectiveness while maintaining optimal safety standards suitable for diverse chemical and industrial applications.
Key market characteristics:
Glue-Applied Labels maintain a 21% market position in the GHS label market due to their cost advantages and bulk application properties. These systems appeal to facilities requiring high-volume labeling with competitive pricing for large-scale chemical packaging applications. Market growth is driven by chemical industry expansion, emphasizing economical labeling solutions and operational efficiency through optimized application designs.
Sleeve Labels capture 11% market share through full-body coverage requirements in pharmaceutical and specialty chemical applications. These facilities demand comprehensive labeling systems capable of providing 360-degree information display while maintaining effective barrier protection and tamper-evidence capabilities.
In-Mold Labels account for 6% market share, targeting premium applications requiring integrated labeling solutions with enhanced durability and aesthetic presentation for specialized chemical and pharmaceutical products.
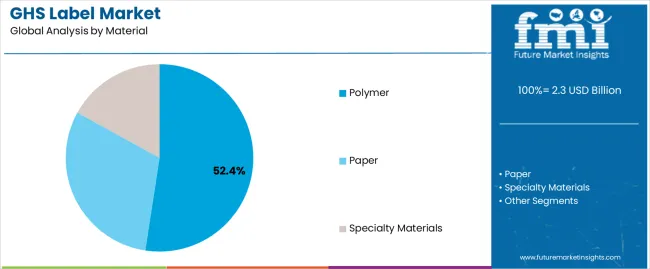
Market Context: Polymer materials demonstrate 52.43% market share due to widespread adoption of chemical-resistant labeling systems and increasing focus on durability optimization, environmental performance, and harsh condition applications that maximize label longevity while maintaining regulatory compliance standards.
Appeal Factors: Polymer material operators prioritize chemical resistance, environmental durability, and integration with existing packaging infrastructure that enables reliable safety communication across multiple exposure conditions. The segment benefits from substantial chemical industry investment and modernization programs that emphasize the acquisition of durable labeling materials for compliance optimization and operational efficiency applications.
Growth Drivers: Chemical industry expansion programs incorporate polymer labels as standard materials for safety communication, while regulatory evolution increases demand for long-lasting labeling capabilities that comply with extended exposure requirements and minimize replacement complexity.
Market Challenges: Higher material costs and specialized printing requirements may limit adoption in price-sensitive applications or commodity chemical scenarios.
Application dynamics include:
Paper materials capture 28% market share through cost-effective labeling requirements in indoor applications, temporary labeling, and controlled environment scenarios. These facilities demand economical labeling systems capable of meeting basic compliance requirements while providing effective information display and printing compatibility.
Specialty materials account for 10% market share, including extreme temperature applications, ultra-chemical resistant scenarios, and specialized industrial requirements demanding maximum performance capabilities for challenging operational conditions.
Market Position: Digital printing technology commands significant market position with 7.4% CAGR through on-demand capabilities that meet flexibility and customization requirements for diverse regulatory applications.
Value Drivers: This printing technology provides the ideal combination of variable data printing and quick changeover capabilities, meeting requirements for multilingual labels, batch-specific information, and regulatory updates without requiring extensive setup or inventory management.
Growth Characteristics: The segment benefits from broad applicability across chemical sectors, reduced waste generation, and emerging compliance programs that support widespread adoption and operational flexibility.
Market Context: Chemical Manufacturing dominates the market with 6.8% CAGR, reflecting the primary demand source for GHS labeling technology in hazardous material production and distribution operations.
Business Model Advantages: Chemical manufacturers provide direct market demand for compliant labeling solutions, driving technology innovation and material advancement while maintaining regulatory compliance and workplace safety requirements.
Operational Benefits: Chemical manufacturing applications include production labeling, supply chain communication, and safety documentation that drive consistent demand for labeling solutions while providing access to latest compliance technologies.
| Category | Factor | Impact | Why It Matters |
|---|---|---|---|
| Driver | Global regulatory harmonization & GHS adoption (OSHA, EU CLP, global alignment) | ★★★★★ | Mandatory compliance across jurisdictions requires standardized labeling; creates consistent global demand for compliant solutions. |
| Driver | Chemical industry growth & expanding production (emerging markets, specialty chemicals) | ★★★★★ | Increased chemical manufacturing requires proportional growth in safety labeling; new facilities adopt latest compliance standards. |
| Driver | Supply chain transparency & traceability requirements | ★★★★☆ | Enhanced tracking demands drive smart label adoption; integration with chemical management systems becomes competitive advantage. |
| Restraint | Label durability challenges in harsh environments | ★★★★☆ | Chemical exposure, temperature extremes, and UV degradation require premium materials; increases cost and limits material options. |
| Restraint | Multilingual requirements & regional variations | ★★★☆☆ | Different countries require specific languages and formats; increases complexity and inventory management challenges. |
| Trend | Smart labels with digital integration (RFID, NFC, QR codes) | ★★★★★ | Digital tracking, real-time data access, and supply chain visibility transform operations; connectivity becomes core value proposition. |
| Trend | On-demand digital printing systems | ★★★★☆ | Reduces inventory, enables customization, and facilitates regulatory updates; modular systems and flexible printing drive market evolution. |
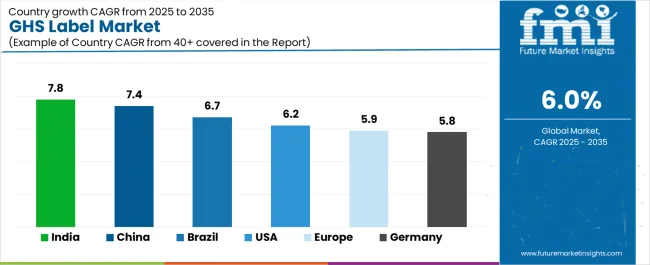
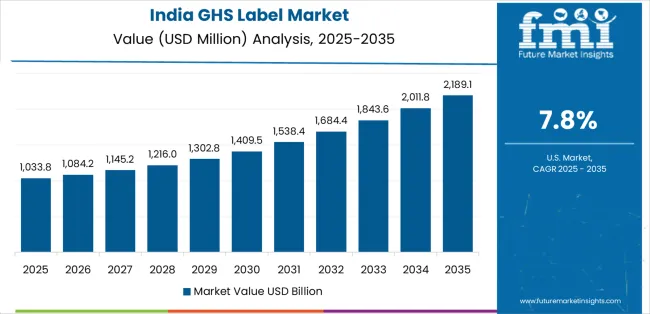
The GHS label market demonstrates varied regional dynamics with Growth Leaders including India (7.8% growth rate) and China (7.4% growth rate) driving expansion through chemical manufacturing initiatives and regulatory harmonization development. Steady Performers encompass United States (6.2% growth rate), Germany (5.8% growth rate), and developed regions, benefiting from established chemical industries and advanced compliance adoption. Emerging Markets feature Brazil (6.7% growth rate) and developing regions, where chemical safety initiatives and regulatory modernization support consistent growth patterns.
Regional synthesis reveals East Asian markets leading adoption through chemical industry expansion and manufacturing development, while North American countries maintain steady expansion supported by regulatory enforcement advancement and workplace safety standardization requirements. European markets show moderate growth driven by CLP implementation and chemical management integration trends.
| Region/Country | 2025-2035 Growth | How to win | What to watch out |
|---|---|---|---|
| India | 7.8% | Focus on cost-effective multilingual solutions | Regulatory complexity; local competition |
| China | 7.4% | Lead with smart label technology | Standards evolution; enforcement variability |
| United States | 6.25 | Provide OSHA compliance support | Material costs; digital transition |
| Germany | 5.8% | Offer premium durability systems | Over-specification; price sensitivity |
| Brazil | 6.7% | Value-oriented compliance models | Import dependencies; currency fluctuations |
| Europe | 5.9% | Push digital integration | CLP updates; multilingual complexity |
India establishes fastest market growth through aggressive chemical manufacturing programs and comprehensive regulatory harmonization development, integrating advanced GHS labeling systems as standard components in chemical safety compliance and industrial production installations. The country's 7.8% growth rate reflects government initiatives promoting workplace safety and hazard communication capabilities that mandate the use of standardized labeling systems in chemical and industrial facilities. Growth concentrates in major chemical hubs, including Gujarat, Maharashtra, and Tamil Nadu, where chemical industry development showcases integrated labeling systems that appeal to chemical operators seeking advanced compliance optimization capabilities and safety communication applications.
Indian manufacturers are developing cost-effective labeling solutions that combine domestic production advantages with multilingual capabilities, including automated printing systems and enhanced durability features. Distribution channels through chemical supply distributors and safety equipment suppliers expand market access, while government support for GHS adoption supports implementation across diverse chemical and industrial segments.
Strategic Market Indicators:
In Shanghai, Guangzhou, and Tianjin, chemical facilities and manufacturing plants are implementing advanced GHS labeling systems as standard equipment for regulatory compliance and safety communication applications, driven by increasing government chemical safety investment and industry modernization programs that emphasize the importance of hazard communication capabilities. The market holds a 7.4% growth rate, supported by government regulatory initiatives and manufacturing infrastructure development programs that promote standardized labeling systems for chemical and industrial facilities. Chinese operators are adopting labeling systems that provide consistent compliance performance and safety communication features, particularly appealing in industrial regions where operational efficiency and regulatory standards represent critical operational requirements.
Market expansion benefits from growing chemical manufacturing capabilities and international standard alignment programs that enable domestic production of advanced labeling systems for chemical and industrial applications. Technology adoption follows patterns established in packaging equipment, where reliability and compliance drive procurement decisions and operational deployment.
Market Intelligence Brief:
United States establishes market leadership through comprehensive OSHA programs and advanced chemical safety infrastructure development, integrating GHS labeling systems across chemical and industrial applications. The country's 6.2% growth rate reflects established chemical industry relationships and mature compliance technology adoption that supports widespread use of standardized labeling systems in chemical and manufacturing facilities. Growth concentrates in major chemical centers, including Texas, Louisiana, and New Jersey, where chemical industry technology showcases mature labeling deployment that appeals to chemical operators seeking proven compliance capabilities and safety communication applications.
American label providers leverage established distribution networks and comprehensive regulatory support capabilities, including OSHA compliance programs and safety documentation that create customer relationships and operational advantages. The market benefits from mature regulatory standards and chemical industry requirements that mandate labeling system use while supporting technology advancement and operational optimization.
Market Intelligence Brief:
Germany's advanced chemical safety market demonstrates sophisticated GHS labeling system deployment with documented operational effectiveness in chemical applications and manufacturing facilities through integration with existing safety management systems and industrial infrastructure. The country leverages engineering expertise in chemical safety technology and compliance systems integration to maintain a 5.8% growth rate. Industrial centers, including North Rhine-Westphalia, Bavaria, and Baden-Württemberg, showcase premium installations where labeling systems integrate with comprehensive chemical management platforms and facility safety systems to optimize compliance operations and communication effectiveness.
German manufacturers prioritize material durability and EU CLP compliance in labeling equipment development, creating demand for premium systems with advanced features, including facility integration capabilities and automated printing systems. The market benefits from established chemical technology infrastructure and a willingness to invest in advanced safety technologies that provide long-term operational benefits and compliance with international chemical standards.
Market Intelligence Brief:
Brazil's market expansion benefits from diverse chemical demand, including manufacturing modernization in São Paulo and Rio de Janeiro, chemical facility upgrades, and government safety programs that increasingly incorporate labeling solutions for compliance optimization applications. The country maintains a 6.7% growth rate, driven by rising chemical activity and increasing recognition of safety communication benefits, including precise hazard identification and enhanced workplace safety.
Market dynamics focus on cost-effective labeling solutions that balance advanced compliance performance with affordability considerations important to Brazilian chemical operators. Growing chemical industrialization creates continued demand for modern labeling systems in new facility infrastructure and manufacturing modernization projects.
Strategic Market Considerations:
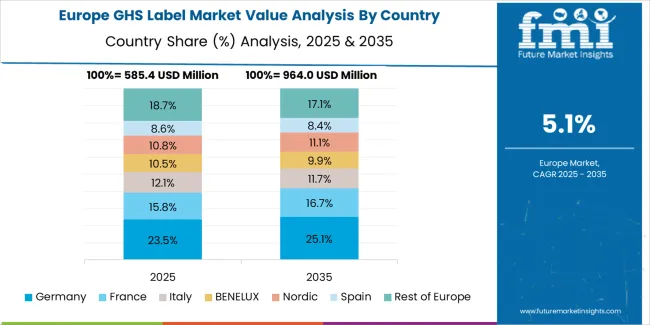
The European GHS label market is projected to grow from USD 0.8 billion in 2025 to USD 1.4 billion by 2035, registering a CAGR of 5.9% over the forecast period. Germany is expected to maintain its leadership position with a 32.4% market share in 2025, supported by its advanced chemical technology infrastructure and major manufacturing centers.
United Kingdom follows with a 24.3% share in 2025, driven by comprehensive chemical safety programs and compliance technology development initiatives. France holds a 19.7% share through specialized chemical applications and CLP compliance requirements. Italy commands a 13.2% share, while Spain accounts for 10.4% in 2025. The rest of Europe region is anticipated to gain momentum, expanding its collective share from 7.1% to 7.6% by 2035, attributed to increasing chemical safety adoption in Nordic countries and emerging chemical facilities implementing regulatory modernization programs.
| Stakeholder | What they actually control | Typical strengths | Typical blind spots |
|---|---|---|---|
| Global platforms | Distribution reach, material supply chains, printing facilities | Broad availability, proven durability, multi-region compliance | Innovation cycles; digital transformation |
| Technology innovators | R&D capabilities; smart labels; digital printing systems | Latest features first; attractive ROI on compliance automation | Service density outside core regions; customization complexity |
| Regional specialists | Local compliance, fast delivery, nearby technical support | "Close to site" service; pragmatic pricing; regional regulations | Technology gaps; talent retention in R&D |
| Service-focused ecosystems | Compliance support, design services, regulatory updates | Lowest compliance risk; comprehensive support | Service costs if overpromised; technology obsolescence |
| Material specialists | Specialty substrates, chemical-resistant adhesives, extreme conditions | Win harsh environment applications; superior durability | Scalability limitations; narrow market focus |
| Item | Value |
|---|---|
| Quantitative Units | USD 2.3 billion |
| Label Type | Pressure-Sensitive Labels, Glue-Applied Labels, Sleeve Labels, In-Mold Labels |
| Material | Paper, Polymer (Vinyl, Polyester, Polypropylene), Specialty Materials |
| Printing Technology | Digital Printing, Flexographic Printing, Lithographic Printing, Screen Printing |
| End Use | Chemical Manufacturing, Pharmaceuticals, Agrochemicals, Paints & Coatings, Industrial Chemicals |
| Regions Covered | North America, Latin America, Western Europe, Eastern Europe, East Asia, South Asia Pacific, Middle East & Africa |
| Countries Covered | United States, China, Germany, India, United Kingdom, Japan, Canada, Brazil, France, Australia, and 25+ additional countries |
| Key Companies Profiled | Avery Dennison Corporation, 3M Company, Brady Corporation, UPM Raflatac, Lintec Corporation, CCL Industries Inc., Constantia Flexibles, Multi-Color Corporation |
| Additional Attributes | Dollar sales by label type and material categories, regional adoption trends across North America, Europe, and East Asia, competitive landscape with label manufacturers and chemical safety suppliers, chemical operator preferences for durability control and compliance reliability, integration with chemical management platforms and safety communication systems, innovations in labeling technology and material enhancement, and development of smart labeling solutions with enhanced performance and compliance optimization capabilities. |
The global ghs label market is estimated to be valued at USD 2.3 billion in 2025.
The market size for the ghs label market is projected to reach USD 4.1 billion by 2035.
The ghs label market is expected to grow at a 6.0% CAGR between 2025 and 2035.
The key product types in ghs label market are pressure-sensitive labels, glue-applied labels, sleeve labels and in-mold labels.
In terms of material, polymer segment to command 52.4% share in the ghs label market in 2025.


Full Research Suite comprises of:
Market outlook & trends analysis
Interviews & case studies
Strategic recommendations
Vendor profiles & capabilities analysis
5-year forecasts
8 regions and 60+ country-level data splits
Market segment data splits
12 months of continuous data updates
DELIVERED AS:
PDF EXCEL ONLINE
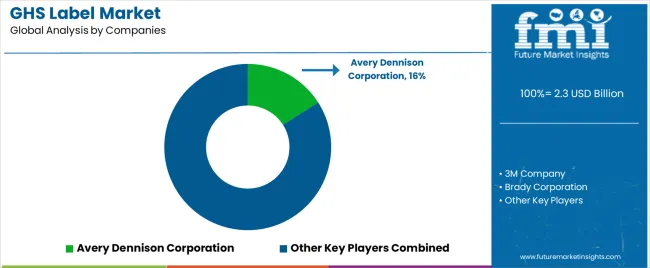
Leading Providers & Market Share in GHS Label Industry
Labels Market Forecast and Outlook 2025 to 2035
Label Applicators Market Size and Share Forecast Outlook 2025 to 2035
Labeling and Coding Equipment Market Size and Share Forecast Outlook 2025 to 2035
Labels, Tapes And Films Market Size and Share Forecast Outlook 2025 to 2035
Labeling Equipment Market Analysis - Size, Share, and Forecast Outlook 2025 to 2035
Label Printers Market Size, Growth, and Forecast 2025 to 2035
Labelling Machine Market Growth & Industry Trends through 2035
Competitive Overview of Labels Companies
Key Players & Market Share in the Label Applicators Industry
Competitive Breakdown of Labeling Equipment Providers
Labeling Software Market Growth - Trends & Forecast through 2034
Label Printing Software Market – Smart Labeling & Automation
USA Labels Market Size and Share Forecast Outlook 2025 to 2035
GMO Labelling Market Size and Share Forecast Outlook 2025 to 2035
Top Labelling Equipment Market Trends - Growth & Forecast 2025 to 2035
Market Share Distribution Among USA Labels Providers
Foam Labels Market Trends and Growth 2035
Market Share Breakdown of Foil Labels Manufacturers
Foil Labels Market Analysis by Metal Foils & Polymer-Based Foils Through 2035

Thank you!
You will receive an email from our Business Development Manager. Please be sure to check your SPAM/JUNK folder too.
Chat With
MaRIA