GMO Labelling Market Size and Share Forecast Outlook 2025 to 2035

The GMO Labelling Market is estimated to be valued at USD 2.5 billion in 2025 and is projected to reach USD 4.0 billion by 2035, registering a compound annual growth rate (CAGR) of 4.9% over the forecast period.
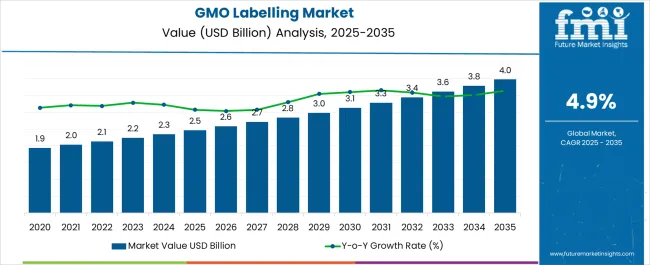
Quick Stats for GMO Labelling Market

  • GMO Labelling Market Value (2025): USD 2.5 billion
  • GMO Labelling Market Forecast Value (2035): USD 4.0 billion
  • GMO Labelling Market Forecast CAGR: 4.9%
  • Leading Segment in GMO Labelling Market in 2025: Online (58.3%)
  • Key Growth Regions in GMO Labelling Market: North America, Asia-Pacific, Europe
  • Top Key Players in GMO Labelling Market: Campbell soup, Conagra foods, Earthbound farms, General Mills, Danone, Nature path foods, Ingredion incorporated, Organic Valley, Kerry ingredients

Gmo Labelling Market Market Value Analysis

GMO Labelling Market Key Takeaways

Metric Value
GMO Labelling Market Estimated Value in (2025 E) USD 2.5 billion
GMO Labelling Market Forecast Value in (2035 F) USD 4.0 billion
Forecast CAGR (2025 to 2035) 4.9%

Why is the GMO Labelling Market Growing?

The GMO labelling market is experiencing significant growth, driven by increasing consumer demand for transparency in food sourcing and heightened awareness of genetically modified organisms in global food supply chains. Regulatory frameworks across multiple regions are mandating clear labelling practices to ensure consumers are informed about product composition, which is accelerating adoption. Food manufacturers and retailers are under rising pressure to comply with international labelling standards, enhancing accountability and brand trust.

Technological advancements in traceability solutions, digital printing, and packaging innovations are further supporting the efficiency of GMO labelling practices. Heightened consumer concerns regarding food safety, sustainability, and ethical sourcing are influencing purchasing behavior, creating new opportunities for companies adopting transparent labelling strategies.

Governments and non-governmental organizations are also strengthening their role in shaping public discourse, further fueling demand for standardized GMO labelling systems As consumer awareness increases and food industry regulation continues to evolve, the market is positioned for sustained expansion, with strong opportunities for technology providers, retailers, and food producers to align with consumer expectations and compliance requirements.

Segmental Analysis

The gmo labelling market is segmented by sales distribution channel, and geographic regions. By sales distribution channel, gmo labelling market is divided into Online and Offline. Regionally, the gmo labelling industry is classified into North America, Latin America, Western Europe, Eastern Europe, Balkan & Baltic Countries, Russia & Belarus, Central Asia, East Asia, South Asia & Pacific, and the Middle East & Africa.
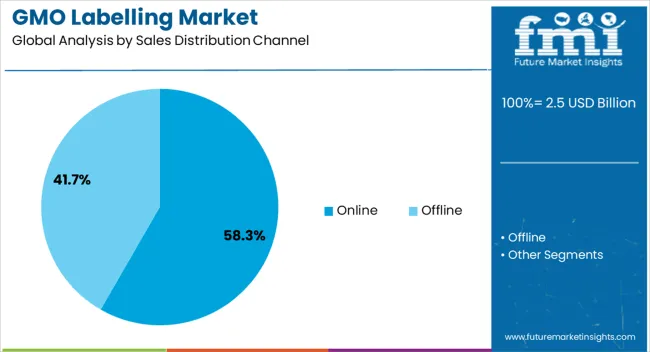
Insights into the Online Sales Distribution Channel Segment

Gmo Labelling Market Analysis By Sales Distribution Channel

The online sales distribution channel is projected to account for 58.3% of the GMO labelling market revenue share in 2025, establishing it as the leading sales channel. This dominance is being driven by the growing influence of e-commerce platforms and digital marketplaces, where consumer preference for transparency and product information is particularly strong. Online platforms provide consumers with detailed ingredient and labelling disclosures, enabling informed decision-making and reinforcing demand for GMO-labelled products.

The segment’s growth is further supported by the rapid expansion of direct-to-consumer models, where food brands prioritize clear labelling to strengthen brand reputation and build consumer trust. Convenience, wide product availability, and accessibility to comparative labelling details are additional factors contributing to online sales leadership.

Increasing integration of blockchain-based traceability systems and QR code-enabled packaging in online retail is also enhancing transparency and reinforcing compliance with regulatory standards As consumer reliance on digital channels continues to rise, the online sales distribution channel is expected to remain the most influential driver of GMO labelling adoption in the market.

Market Overview

Historical outlook vs Future forecast for the GMO labelling market

In 2025, the market for GMO labeling has a value of $1,061.4 million. From 2025 to 2025, the GMO labeling market is projected to expand at a CAGR of 4.5%. In 2025, the market for GMO labeling was expected to be valued at USD 1265.78 Million.

The National Academy of Sciences asserts that customers must be aware of whether the items they buy contain transgenic elements in order to weigh the dangers and advantages of their choice. This has been a major driver of market expansion.

Consumer attitudes toward food goods are always changing. FMO food producers are putting a lot of effort into meeting the needs of GMO labeling as consumers become more aware of healthy edible products in order to maintain a devoted customer base. This is yet another important factor that is anticipated to increase the industry throughout the coming years.
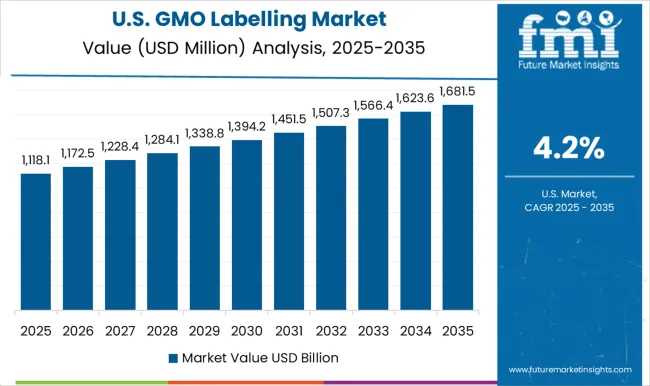
Country wise insights

How American market for GMO labeling is growing?

Gmo Labelling Market Country Value Analysis

After a law supporting the labeling of GMO foods was passed, the American market for GMO labeling is rapidly expanding. Consumer need for increased transparency on the food they are eating has been the driving force behind this.

All food products that contain GMOs must now be clearly labeled as such by law. As a result, many businesses have altered the components of their products or reformulated them to eliminate the use of GMOs.

The market for GMO-free goods is likely to expand as more customers become aware of the problem of GMOs in their food. Customers will have more options as a result, and businesses will face pressure to acquire non-GM ingredients.
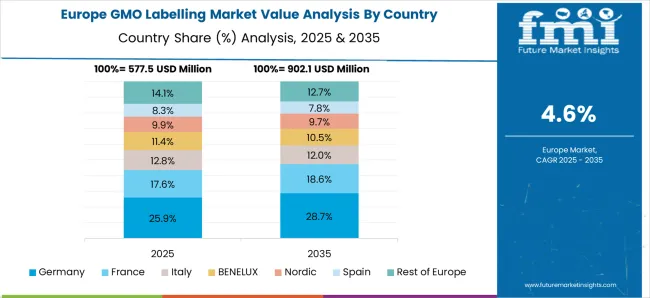
How Europe is the pioneer in GMO labeling?

Gmo Labelling Market Europe Country Market Share Analysis, 2025 & 2035

While some base the amount on the overall food item, most mandatory labeling rules are based on the percentage of GMOs in any one ingredient in a food product. The 0.9% level is used by countries with the strictest regulations, such as the European Union, Saudi Arabia, Turkey, and Australia. Others permit a higher level of GMO incorporation, with Japan allowing 5% and South Korea allowing 3%. In Australia and New Zealand, unless the entire product is genetically modified, GMO ingredients must be disclosed in the ingredient panel. According to the organization Food Standards Australia New Zealand, in that situation, the details must be listed next to the name. The GMO labeling criterion is higher in South Korea, where anything less than 3% is regarded as accidental.

Category wise Insights

How supermarkets are responsible for the growth of the GMO labeling market?

According to a recent study, supermarkets are to blame for the market for GMO labeling expanding. When stores were located in states with obligatory GMO labeling legislation, they were more likely to sell products with GMO

labels, according to the University of California, Berkeley study that examined data from more than 9,000 products in the USA.

According to Michele Simon, the study's primary author, stores are responding to customer demand for genetically modified foods (GMOs). We expect to see many more products on shop shelves wearing these labels as additional states approve mandatory GMO labeling laws, she said.

The study is being released as the American argument for requiring GMO labeling rages on.

How new product launches are propelling the growth of the GMO labeling market?

According to a recent study, supermarkets are to blame for the market for GMO labeling expanding. When stores were located in states with obligatory GMO labeling legislation, they were more likely to sell products with GMO labels, according to the University of California, Berkeley study that examined data from more than 9,000 products in the USA.

According to FMI, stores are responding to customer demand for genetically modified foods (GMOs). We expect to see many more products on shop shelves wearing these labels as additional states approve mandatory GMO labeling laws.
Competitive landscape

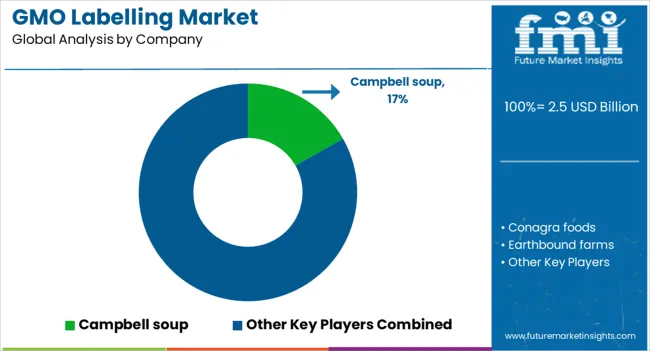
Gmo Labelling Market Analysis By Company

To satisfy consumers' growing demand for GMO labeling and to maintain their market dominance, the majority of businesses are concentrating on innovation and new product launches.

In order to fulfill evolving consumer expectations and seize the largest market possible, businesses in the GMO labeling sector are constantly producing new sorts of products. Additionally, businesses are focusing on growing their distribution networks in order to enter new markets.
Analysis of GMO Labelling Market By Key Countries

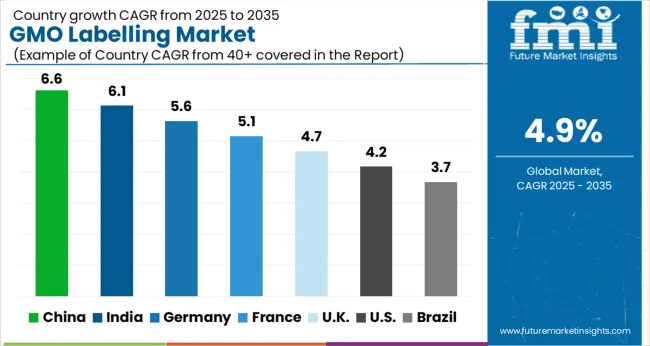
Gmo Labelling Market Cagr Analysis By Country

Country CAGR
China 6.6%
India 6.1%
Germany 5.6%
France 5.1%
UK 4.7%
USA 4.2%
Brazil 3.7%

Country-wise Analysis

The GMO Labelling Market is expected to register a CAGR of 4.9% during the forecast period, exhibiting varied country level momentum. China leads with the highest CAGR of 6.6%, followed by India at 6.1%. Developed markets such as Germany, France, and the UK continue to expand steadily, while the USA is likely to grow at consistent rates. Brazil posts the lowest CAGR at 3.7%, yet still underscores a broadly positive trajectory for the global GMO Labelling Market. In 2024, Germany held a dominant revenue in the Western Europe market and is expected to grow with a CAGR of 5.6%. The USA GMO Labelling Market is estimated to be valued at USD 907.8 million in 2025 and is anticipated to reach a valuation of USD 1.4 billion by 2035. Sales are projected to rise at a CAGR of 4.2% over the forecast period between 2025 and 2035. While Japan and South Korea markets are estimated to be valued at USD 126.5 million and USD 64.2 million respectively in 2025.

Key Players in the GMO Labelling Market

  • Campbell soup
  • Conagra foods
  • Earthbound farms
  • General Mills
  • Danone
  • Nature path foods
  • Ingredion incorporated
  • Organic Valley
  • Kerry ingredients

Scope of the Report

Item Value
Quantitative Units USD 2.5 Billion
Sales Distribution Channel Online and Offline
Regions Covered North America, Europe, Asia-Pacific, Latin America, Middle East & Africa
Country Covered United States, Canada, Germany, France, United Kingdom, China, Japan, India, Brazil, South Africa
Key Companies Profiled Campbell soup, Conagra foods, Earthbound farms, General Mills, Danone, Nature path foods, Ingredion incorporated, Organic Valley, and Kerry ingredients
Additional Attributes  

GMO Labelling Market by Segments

Sales Distribution Channel:

  • Online
  • Offline

Region:

  • North America
    • USA
    • Canada
    • Mexico
  • Latin America
    • Brazil
    • Chile
    • Rest of Latin America
  • Western Europe
    • Germany
    • UK
    • Italy
    • Spain
    • France
    • Nordic
    • BENELUX
    • Rest of Western Europe
  • Eastern Europe
    • Russia
    • Poland
    • Hungary
    • Balkan & Baltic
    • Rest of Eastern Europe
  • East Asia
    • China
    • Japan
    • South Korea
  • South Asia and Pacific
    • India
    • ASEAN
    • Australia & New Zealand
    • Rest of South Asia and Pacific
  • Middle East & Africa
    • Kingdom of Saudi Arabia
    • Other GCC Countries
    • Turkiye
    • South Africa
    • Other African Union
    • Rest of Middle East & Africa

Table of Content

  1. Executive Summary
    • Global Market Outlook
    • Demand-side Trends
    • Supply-side Trends
    • Technology Roadmap Analysis
    • Analysis and Recommendations
  2. Market Overview
    • Market Coverage / Taxonomy
    • Market Definition / Scope / Limitations
  3. Market Background
    • Market Dynamics
      • Drivers
      • Restraints
      • Opportunity
      • Trends
    • Scenario Forecast
      • Demand in Optimistic Scenario
      • Demand in Likely Scenario
      • Demand in Conservative Scenario
    • Opportunity Map Analysis
    • Product Life Cycle Analysis
    • Supply Chain Analysis
    • Investment Feasibility Matrix
    • Value Chain Analysis
    • PESTLE and Porter’s Analysis
    • Regulatory Landscape
    • Regional Parent Market Outlook
    • Production and Consumption Statistics
    • Import and Export Statistics
  4. Global Market Analysis 2020 to 2024 and Forecast, 2025 to 2035
    • Historical Market Size Value (USD Million) Analysis, 2020 to 2024
    • Current and Future Market Size Value (USD Million) Projections, 2025 to 2035
      • Y-o-Y Growth Trend Analysis
      • Absolute $ Opportunity Analysis
  5. Global Market Pricing Analysis 2020 to 2024 and Forecast 2025 to 2035
  6. Global Market Analysis 2020 to 2024 and Forecast 2025 to 2035, By Sales Distribution Channel
    • Introduction / Key Findings
    • Historical Market Size Value (USD Million) Analysis By Sales Distribution Channel , 2020 to 2024
    • Current and Future Market Size Value (USD Million) Analysis and Forecast By Sales Distribution Channel , 2025 to 2035
      • Online
        • Company websites
        • E-tailing companies
      • Offline
        • Supermarkets
        • Retail shops
    • Y-o-Y Growth Trend Analysis By Sales Distribution Channel , 2020 to 2024
    • Absolute $ Opportunity Analysis By Sales Distribution Channel , 2025 to 2035
  7. Global Market Analysis 2020 to 2024 and Forecast 2025 to 2035, By Region
    • Introduction
    • Historical Market Size Value (USD Million) Analysis By Region, 2020 to 2024
    • Current Market Size Value (USD Million) Analysis and Forecast By Region, 2025 to 2035
      • North America
      • Latin America
      • Western Europe
      • Eastern Europe
      • East Asia
      • South Asia and Pacific
      • Middle East & Africa
    • Market Attractiveness Analysis By Region
  8. North America Market Analysis 2020 to 2024 and Forecast 2025 to 2035, By Country
    • Historical Market Size Value (USD Million) Trend Analysis By Market Taxonomy, 2020 to 2024
    • Market Size Value (USD Million) Forecast By Market Taxonomy, 2025 to 2035
      • By Country
        • USA
        • Canada
        • Mexico
      • By Sales Distribution Channel
    • Market Attractiveness Analysis
      • By Country
      • By Sales Distribution Channel
    • Key Takeaways
  9. Latin America Market Analysis 2020 to 2024 and Forecast 2025 to 2035, By Country
    • Historical Market Size Value (USD Million) Trend Analysis By Market Taxonomy, 2020 to 2024
    • Market Size Value (USD Million) Forecast By Market Taxonomy, 2025 to 2035
      • By Country
        • Brazil
        • Chile
        • Rest of Latin America
      • By Sales Distribution Channel
    • Market Attractiveness Analysis
      • By Country
      • By Sales Distribution Channel
    • Key Takeaways
  10. Western Europe Market Analysis 2020 to 2024 and Forecast 2025 to 2035, By Country
    • Historical Market Size Value (USD Million) Trend Analysis By Market Taxonomy, 2020 to 2024
    • Market Size Value (USD Million) Forecast By Market Taxonomy, 2025 to 2035
      • By Country
        • Germany
        • UK
        • Italy
        • Spain
        • France
        • Nordic
        • BENELUX
        • Rest of Western Europe
      • By Sales Distribution Channel
    • Market Attractiveness Analysis
      • By Country
      • By Sales Distribution Channel
    • Key Takeaways
  11. Eastern Europe Market Analysis 2020 to 2024 and Forecast 2025 to 2035, By Country
    • Historical Market Size Value (USD Million) Trend Analysis By Market Taxonomy, 2020 to 2024
    • Market Size Value (USD Million) Forecast By Market Taxonomy, 2025 to 2035
      • By Country
        • Russia
        • Poland
        • Hungary
        • Balkan & Baltic
        • Rest of Eastern Europe
      • By Sales Distribution Channel
    • Market Attractiveness Analysis
      • By Country
      • By Sales Distribution Channel
    • Key Takeaways
  12. East Asia Market Analysis 2020 to 2024 and Forecast 2025 to 2035, By Country
    • Historical Market Size Value (USD Million) Trend Analysis By Market Taxonomy, 2020 to 2024
    • Market Size Value (USD Million) Forecast By Market Taxonomy, 2025 to 2035
      • By Country
        • China
        • Japan
        • South Korea
      • By Sales Distribution Channel
    • Market Attractiveness Analysis
      • By Country
      • By Sales Distribution Channel
    • Key Takeaways
  13. South Asia and Pacific Market Analysis 2020 to 2024 and Forecast 2025 to 2035, By Country
    • Historical Market Size Value (USD Million) Trend Analysis By Market Taxonomy, 2020 to 2024
    • Market Size Value (USD Million) Forecast By Market Taxonomy, 2025 to 2035
      • By Country
        • India
        • ASEAN
        • Australia & New Zealand
        • Rest of South Asia and Pacific
      • By Sales Distribution Channel
    • Market Attractiveness Analysis
      • By Country
      • By Sales Distribution Channel
    • Key Takeaways
  14. Middle East & Africa Market Analysis 2020 to 2024 and Forecast 2025 to 2035, By Country
    • Historical Market Size Value (USD Million) Trend Analysis By Market Taxonomy, 2020 to 2024
    • Market Size Value (USD Million) Forecast By Market Taxonomy, 2025 to 2035
      • By Country
        • Kingdom of Saudi Arabia
        • Other GCC Countries
        • Turkiye
        • South Africa
        • Other African Union
        • Rest of Middle East & Africa
      • By Sales Distribution Channel
    • Market Attractiveness Analysis
      • By Country
      • By Sales Distribution Channel
    • Key Takeaways
  15. Key Countries Market Analysis
    • USA
      • Pricing Analysis
      • Market Share Analysis, 2024
        • By Sales Distribution Channel
    • Canada
      • Pricing Analysis
      • Market Share Analysis, 2024
        • By Sales Distribution Channel
    • Mexico
      • Pricing Analysis
      • Market Share Analysis, 2024
        • By Sales Distribution Channel
    • Brazil
      • Pricing Analysis
      • Market Share Analysis, 2024
        • By Sales Distribution Channel
    • Chile
      • Pricing Analysis
      • Market Share Analysis, 2024
        • By Sales Distribution Channel
    • Germany
      • Pricing Analysis
      • Market Share Analysis, 2024
        • By Sales Distribution Channel
    • UK
      • Pricing Analysis
      • Market Share Analysis, 2024
        • By Sales Distribution Channel
    • Italy
      • Pricing Analysis
      • Market Share Analysis, 2024
        • By Sales Distribution Channel
    • Spain
      • Pricing Analysis
      • Market Share Analysis, 2024
        • By Sales Distribution Channel
    • France
      • Pricing Analysis
      • Market Share Analysis, 2024
        • By Sales Distribution Channel
    • India
      • Pricing Analysis
      • Market Share Analysis, 2024
        • By Sales Distribution Channel
    • ASEAN
      • Pricing Analysis
      • Market Share Analysis, 2024
        • By Sales Distribution Channel
    • Australia & New Zealand
      • Pricing Analysis
      • Market Share Analysis, 2024
        • By Sales Distribution Channel
    • China
      • Pricing Analysis
      • Market Share Analysis, 2024
        • By Sales Distribution Channel
    • Japan
      • Pricing Analysis
      • Market Share Analysis, 2024
        • By Sales Distribution Channel
    • South Korea
      • Pricing Analysis
      • Market Share Analysis, 2024
        • By Sales Distribution Channel
    • Russia
      • Pricing Analysis
      • Market Share Analysis, 2024
        • By Sales Distribution Channel
    • Poland
      • Pricing Analysis
      • Market Share Analysis, 2024
        • By Sales Distribution Channel
    • Hungary
      • Pricing Analysis
      • Market Share Analysis, 2024
        • By Sales Distribution Channel
    • Kingdom of Saudi Arabia
      • Pricing Analysis
      • Market Share Analysis, 2024
        • By Sales Distribution Channel
    • Turkiye
      • Pricing Analysis
      • Market Share Analysis, 2024
        • By Sales Distribution Channel
    • South Africa
      • Pricing Analysis
      • Market Share Analysis, 2024
        • By Sales Distribution Channel
  16. Market Structure Analysis
    • Competition Dashboard
    • Competition Benchmarking
    • Market Share Analysis of Top Players
      • By Regional
      • By Sales Distribution Channel
  17. Competition Analysis
    • Competition Deep Dive
      • Campbell soup
        • Overview
        • Product Portfolio
        • Profitability by Market Segments (Product/Age /Sales Channel/Region)
        • Sales Footprint
        • Strategy Overview
          • Marketing Strategy
          • Product Strategy
          • Channel Strategy
      • Conagra foods
      • Earthbound farms
      • General Mills
      • Danone
      • Nature path foods
      • Ingredion incorporated
      • Organic Valley
      • Kerry ingredients
  18. Assumptions & Acronyms Used
  19. Research Methodology

List of Tables

  • Table 1: Global Market Value (USD Million) Forecast by Region, 2020-2035
  • Table 2: Global Market Value (USD Million) Forecast by Sales Distribution Channel , 2020-2035
  • Table 3: North America Market Value (USD Million) Forecast by Country, 2020-2035
  • Table 4: North America Market Value (USD Million) Forecast by Sales Distribution Channel , 2020-2035
  • Table 5: Latin America Market Value (USD Million) Forecast by Country, 2020-2035
  • Table 6: Latin America Market Value (USD Million) Forecast by Sales Distribution Channel , 2020-2035
  • Table 7: Western Europe Market Value (USD Million) Forecast by Country, 2020-2035
  • Table 8: Western Europe Market Value (USD Million) Forecast by Sales Distribution Channel , 2020-2035
  • Table 9: Eastern Europe Market Value (USD Million) Forecast by Country, 2020-2035
  • Table 10: Eastern Europe Market Value (USD Million) Forecast by Sales Distribution Channel , 2020-2035
  • Table 11: East Asia Market Value (USD Million) Forecast by Country, 2020-2035
  • Table 12: East Asia Market Value (USD Million) Forecast by Sales Distribution Channel , 2020-2035
  • Table 13: South Asia and Pacific Market Value (USD Million) Forecast by Country, 2020-2035
  • Table 14: South Asia and Pacific Market Value (USD Million) Forecast by Sales Distribution Channel , 2020-2035
  • Table 15: Middle East & Africa Market Value (USD Million) Forecast by Country, 2020-2035
  • Table 16: Middle East & Africa Market Value (USD Million) Forecast by Sales Distribution Channel , 2020-2035

List of Figures

  • Figure 1: Global Market Pricing Analysis
  • Figure 2: Global Market Value (USD Million) Forecast 2020-2035
  • Figure 3: Global Market Value (USD Million) Share and BPS Analysis by Region, 2025 and 2035
  • Figure 4: Global Market Y-o-Y Growth Comparison by Region, 2025-2035
  • Figure 5: Global Market Attractiveness Analysis by Region
  • Figure 6: North America Market Incremental Dollar Opportunity, 2025-2035
  • Figure 7: Latin America Market Incremental Dollar Opportunity, 2025-2035
  • Figure 8: Western Europe Market Incremental Dollar Opportunity, 2025-2035
  • Figure 9: Eastern Europe Market Incremental Dollar Opportunity, 2025-2035
  • Figure 10: East Asia Market Incremental Dollar Opportunity, 2025-2035
  • Figure 11: South Asia and Pacific Market Incremental Dollar Opportunity, 2025-2035
  • Figure 12: Middle East & Africa Market Incremental Dollar Opportunity, 2025-2035
  • Figure 13: North America Market Value Share and BPS Analysis by Country, 2025 and 2035
  • Figure 14: Latin America Market Value Share and BPS Analysis by Country, 2025 and 2035
  • Figure 15: Western Europe Market Value Share and BPS Analysis by Country, 2025 and 2035
  • Figure 16: Eastern Europe Market Value Share and BPS Analysis by Country, 2025 and 2035
  • Figure 17: East Asia Market Value Share and BPS Analysis by Country, 2025 and 2035
  • Figure 18: South Asia and Pacific Market Value Share and BPS Analysis by Country, 2025 and 2035
  • Figure 19: Middle East & Africa Market Value Share and BPS Analysis by Country, 2025 and 2035
  • Figure 20: Global Market - Tier Structure Analysis
  • Figure 21: Global Market - Company Share Analysis

Frequently Asked Questions

How big is the gmo labelling market in 2025?

The global gmo labelling market is estimated to be valued at USD 2.5 billion in 2025.

What will be the size of gmo labelling market in 2035?

The market size for the gmo labelling market is projected to reach USD 4.0 billion by 2035.

How much will be the gmo labelling market growth between 2025 and 2035?

The gmo labelling market is expected to grow at a 4.9% CAGR between 2025 and 2035.

What are the key product types in the gmo labelling market?

The key product types in gmo labelling market are online, _company websites, _e-tailing companies, offline, _supermarkets and _retail shops.

Which segment to contribute significant share in the gmo labelling market in 2025?

In terms of , segment to command 0.0% share in the gmo labelling market in 2025.

Explore Similar Insights

Future Market Insights

GMO Labelling Market

Chat With MaRIA

Chat With

MaRIA

Hi There, I am MaRIA, Your Market Research Intelligence Assistant. How may I help you?