

- Market Size (2026)
- USD 11.4 Bn
- Forecast (2036)
- USD 19.0 Bn
- CAGR (2026 to 2036)
- 5.2%
How big is the non-GMO verified sports drink market in 2026?
USD 11.4 billion in 2026, reaching USD 19.0 billion by 2036 at a 5.2% CAGR
The non-GMO verified sports drink market was valued at USD 10.9 billion in 2025. The market is set to reach USD 11.4 billion by 2026-end and grow at a CAGR of 5.2% between 2026-2036 to reach USD 19.0 billion by 2036. Isotonic will dominate with a 57.0% share, while Online will lead with a 63.0% share.
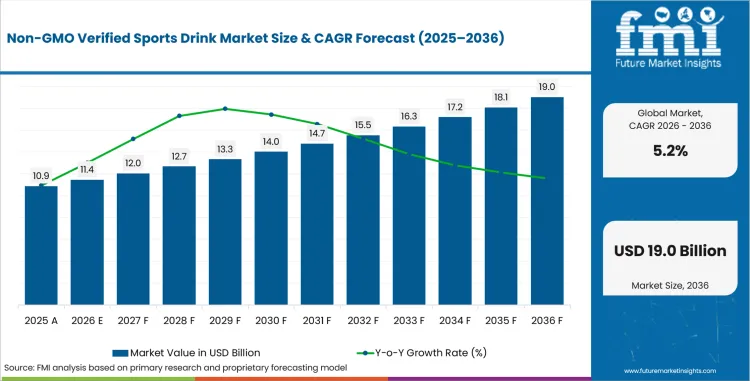
Key Takeaways, Market Size, and Forecast
- Non-GMO Verified Sports Drink Market Value (2025): USD 11.4 Bn
- Non-GMO Verified Sports Drink Market Forecast Value (2036): USD 19.0 Bn
- Non-GMO Verified Sports Drink Market CAGR (2026 TO 2036): 5.2%
- Non-GMO Verified Sports Drink Market Leading Product Type Segment: Isotonic (57.0%)
- Non-GMO Verified Sports Drink Market Key Growth Regions: China, India, Japan, South Korea, USA, UK
- Non-GMO Verified Sports Drink Market Key Players: PepsiCo (Gatorade), The Coca-Cola Company (Powerade), Red Bull GmbH, Nestlé (Nestlé Pure Life), Glacéau (Vitaminwater), Bodyarmor, Icelandic Glacial
| Parameter | Details |
|---|---|
| Market Size in 2026 (Value) | USD 11.4 Bn |
| Market Forecast in 2036 (Value) | USD 19.0 Bn |
| CAGR (2026 to 2036) | 5.2% |
| Years Considered | 2021 to 2036 |
| Base Year | 2025 |
| Forecast Period | 2026 to 2036 |
| Units Considered | Value (USD Bn) |
| Leading Sub-Region | China |
Summary of the Non-GMO Verified Sports Drink Market
- Demand and Growth Drivers
- Consumers are increasingly demanding Non-GMO Project Verified sports drinks as they prefer clean-label and non-GMO certified beverages in both retail and online channels.
- The growing online distribution channels are accelerating product discovery and purchase conversion of non-GMO verified sports drinks, especially among health-conscious younger demographics.
- As recreational fitness and organized sporting events become more popular, the consumer base is shifting from professional athletes to casual users seeking healthier hydration.
- Product and Segment View
- Isotonic formulations account for 57.0% of product type share as the athletes prefer quick replenishment of electrolytes during moderate to high intensity physical activity.
- The online distribution channels have a share of 63.0%, which is attributed to the direct-to-consumer subscription models and the availability of specialty beverage products on e-commerce platforms.
- Bottles drive 58.0% of packaging type because of the convenience and portability needs of active consumers in gyms, outdoors and at events.
- Geography and Competitive Outlook
- China is the leader in growth at 7.0% CAGR, fueled by growing participation in fitness, increasing health awareness and the rapid growth of e-commerce channels for functional beverages.
- North America accounted for the largest market share, owing to the existing non-GMO certification infrastructure and high consumer demand for clean-label sports nutrition products.
- Manufacturers with wide retail distribution and online presence, along with an existing non-GMO certification, are in a good position to capitalize on increasing demand across athlete and casual consumer segments.
- Analyst Opinion
- Nandini Roy Choudhury, Principal Consultant at FMI says, 'Brands that can balance clean-label formulations with competitive pricing and broad retail availability are likely to capture the growing casual consumer segment over the forecast period.'
- The non-GMO verified sports drink market is evolving from a niche certification category into a mainstream consumer expectation for sports hydration products.
- Adoption is increasing due to retailer shelf space allocation policies that prioritize clean-label and non-GMO certified beverages in health and wellness sections.
- Demand is supported by expansion of fitness culture and organized recreational sports participation across urban centers in Asia-Pacific and Latin American markets.
- Growth reflects consumer willingness to pay a modest premium for verified non-GMO ingredients in daily hydration and sports nutrition products.
What is a non-GMO verified sports drink and what does the market cover?
Hydration, electrolyte and sports-nutrition beverages carrying Non-GMO Project Verification or equivalent certification
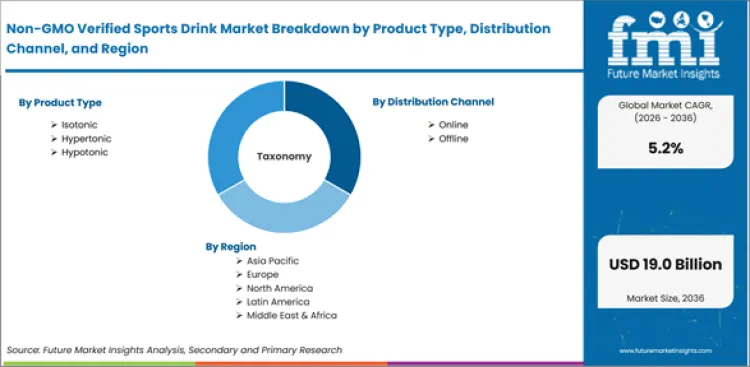
The non-GMO verified sports drink market includes beverages formulated for hydration, electrolyte replenishment, and sports nutrition that carry Non-GMO Project Verification or equivalent non-GMO certification. Products span isotonic, hypertonic, and hypotonic formulations distributed through online and offline channels in bottle, can, and pouch packaging formats.
What is included in the non-GMO verified sports drink market scope?
Isotonic, hypertonic and hypotonic non-GMO verified sports drinks, 2026 to 2036.
Market scope covers all commercially traded non-GMO verified sports drinks categorized by product type (isotonic, hypertonic, hypotonic), distribution channel (online, offline), end use (athletes, casual sports drink consumers, recreational users), ingredients (electrolytes, vitamins, carbohydrates, sodium), flavor (citrus flavors, berry flavors, tropical flavors), and packaging type (bottles, cans, pouches). Revenue is tracked from 2026 to 2036.
What is excluded from the non-GMO verified sports drink market scope?
Conventional non-verified sports drinks, energy drinks, and plain water-based beverages without electrolytes
The scope excludes:
- Conventional sports drinks that are not non-GMO verified
- Energy drinks, which are marketed for their caffeine content and not for sports hydration
- Water-based beverages without an electrolyte or sports nutrition formulation.
How was the non-GMO verified sports drink market research conducted?
Primary interviews, desk research, bottom-up sizing, and quarterly validation
- Primary research: FMI analysts spoke with beverage brand managers, sports nutrition formulators, retail category buyers and non-GMO certification bodies in key markets.
- Desk Research: Aggregated data from retail scanner datasets, online retail sales tracking and revenue disclosures from beverage manufacturers.
- Market Sizing and Forecasting: Aggregation of retail and online sales volumes bottom-up by product types, distribution channels and geo markets with consumer adoptions projections.
- Data Validation: Perform quarterly reconciliation against retail point-of-sale data, e-commerce platform analytics and manufacturer shipment data.
Why is the non-GMO verified sports drink market growing?
Rising clean-label demand and certification-conscious purchasing among health-focused consumers
- Health-conscious buyers are increasingly likely to check certification labels prior to purchase, which is expanding the addressable market for non-GMO verified sports drinks, as consumers are increasingly interested in clean-label ingredients.
- Direct-to-consumer sales models, with 63.0% channel share of online distribution growth, are aiding brands with better margin structure and increasing product accessibility across geographies.
- China is leading at 7.0% CAGR driven by rapid growth of fitness culture, e-commerce beverage purchasing and increased consumer awareness of ingredient quality standards.
Clean-label movement in packaged beverages drives demand for non-GMO verified sports drinks. Ingredient transparency and third-party certification are consistently part of consumer surveys and influence purchase decisions, especially among millennials and Gen Z. 57.0% product type share for isotonic formulations, the most popular format for active hydration during exercise and sport participation. These formulas provide the electrolyte and carbohydrate balance to assist with fluid absorption during moderate to high intensity exercise.
The market share of online channels is 63.0% and the distribution dynamics are in favor of them. The limitations of traditional retail shelf space are overcome by e-commerce platforms which provide a wider assortment of products and a direct link between brands and consumers. Non-GMO sports drink brands for regular consumers see demand visibility and reduced customer acquisition costs through subscription purchasing models. Impulse purchase occasions still play a role in offline channels such as convenience stores, gyms and sports venues where immediate hydration creates a point of sale need.
Regional growth patterns are a reflection of varying maturity levels of fitness culture, awareness of certification and distribution infrastructure. North America has the most mature non-GMO certification ecosystem, and consumers are highly aware of the Non-GMO Project Verified seal. The fastest-growing markets are in the region of Asia-Pacific with China and India leading the charge owing to the increasing involvement in fitness activities outside of urban centers and dismantling of distribution barriers for specialty beverage products by e-commerce platforms.
How is the non-GMO verified sports drink market segmented?
By product type, distribution channel, end use, ingredients, flavor and packaging type
- Isotonic formulations account for 57.0% of product type demand, as they are suited to quickly replenish electrolytes during physical activity while providing the right balance of sodium and carbohydrates.
- Online distribution contributes a 63.0% channel share, driven by growth in e-commerce platforms and direct to consumer subscription models for specialty beverage products.
- The end use share is held by athletes at 48.0%. Casual sports drink consumers and recreational users are a fast growing segment of the addressable market.
Why do isotonic sports drinks lead the non-GMO verified sports drink market?
They hold 57.0% share, led by electrolyte- and carbohydrate-balanced formulations
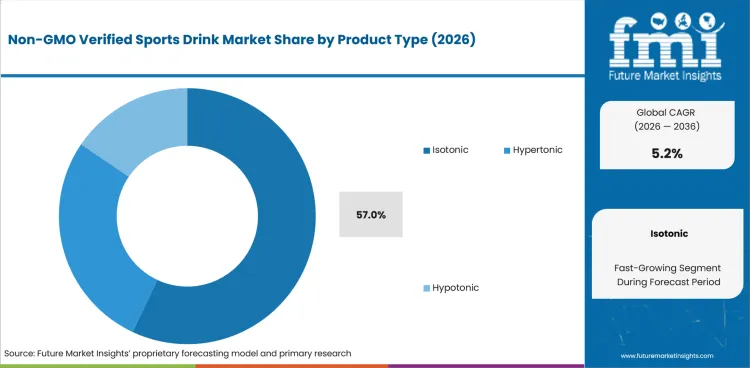
By product type, isotonic formulations are projected to account for a share of 57.0% by 2026. The products have a concentration of electrolytes and carbohydrates similar to the concentration of these substances in the body fluids, and therefore quickly absorbed during physical exertion. Recreational exercisers and athletes prefer isotonic formats, as they provide both hydration and energy replacement.
The flavor segment is led by the citrus flavored isotonic drinks with 42.0% share followed by berry and tropical variants. Manufacturers are diversifying their flavor portfolios to suit consumers’ varied taste preferences in global markets, with regional flavor adaptations for Asia-Pacific and Latin American consumers.
How big is the online distribution segment in the non-GMO verified sports drink market?
About 63.0% share, led by e-commerce platforms with product discovery and reviews
Online distribution will account for 63.0% of channel share in 2026. Product discovery e-commerce platforms support consumers in finding verified products by search, reviews and filtering for non-GMO certification. Subscriptions on direct-to-consumer brand websites drive higher order frequency and customer retention.
Offline channels such as supermarkets, convenience stores and gym retail outlets cater to impulse and immediate need purchase occasions. The spread of sports venues offers prime real estate when the demand for refreshment is at its peak. The channel mix is shifting to online with consumers of all ages getting more comfortable buying beverages e-commerce.
What drives and restrains the non-GMO verified sports drink market?
Driven by clean-label demand and third-party certification; restrained by costly verified non-GMO sourcing pressuring margins
- The increased use of third-party certification and consumer demand for clean-label products are driving ongoing growth of non-GMO verified sports drinks in both developed and emerging markets.
- Sourcing verified non-GMO raw materials is more expensive, putting pressure on margins, especially for brands competing on price in mass market retail channels.
- The addressable market is expanding out of the traditional athlete-focused sports drink category as it expands into the casual consumer and recreational fitness segments.
The market for non-GMO verified sports drinks is supported by consumer trends for clean-label products, growth in fitness culture and growth in online distribution. Challenges to margins include the cost premium for certified ingredients and competitive pressures from conventional sports drink brands, but opportunities lie in casual consumer segments, flavor expansion and distribution in emerging markets.
What drives clean-label certification demand?
Consumers wanting transparency and third-party Non-GMO verification of ingredients
There’s demand as consumers want to know what’s in their food. The Non-GMO Project Verification and other third-party certifications provide purchase confidence for health-conscious consumers. Retailer shelf space policies increasingly favor certified clean-label products, providing verified brands with greater in-store visibility and sales velocity.
What constrains margins in the market?
Higher costs for non-GMO certified electrolyte and sweetener raw materials
Adoption is constrained by higher costs for non-GMO certified raw materials such as electrolyte compounds, natural sweeteners and flavoring agents. These cost differences drive down gross margins compared to conventional formulations, restricting aggressive pricing strategies needed for mass-market penetration in price-sensitive geographies.
What opportunity does fitness culture create?
Growing gym membership, fitness participation and organized sport worldwide
Growth parallels the worldwide growth of fitness participation, gym membership, and organized recreational sports events. In China, India and Brazil, urban centres are witnessing a rapidly growing consumer population focused on fitness and seeking hydration products that align with their health and wellness values.
How are products diversifying?
Region-targeted flavor profiles and alternative pack formats broadening product lines
Manufacturers are broadening product lines with flavor profiles targeted to regions and alternative packaging formats such as cans and pouches. The tropical and berry flavors are intended to satisfy taste preferences in Asia-Pacific markets, while the pouch formats are to cater to convenience-seeking consumers who prefer portable hydration while engaging in outdoor activities and travelling.
Which countries are growing fastest in the non-GMO verified sports drink market?
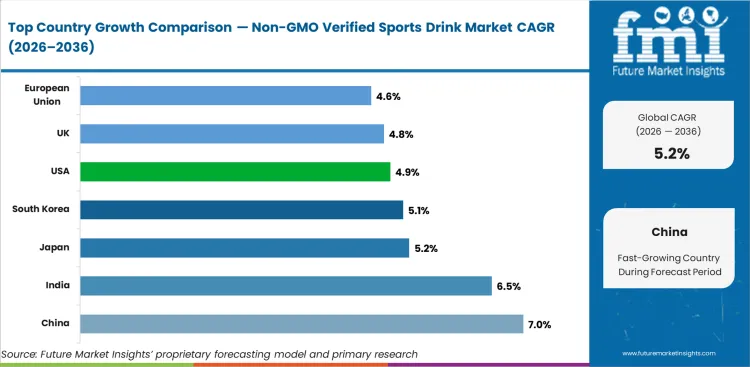
China 7.0%, India 6.5%, Japan 5.2%, South Korea 5.1%, USA 4.9% through 2036
.webp "Top Country Growth Comparison Non Gmo Verified Sports Drink Market Cagr (2026 2036)")
| Country | CAGR |
|---|---|
| China | 7.0% |
| India | 6.5% |
| Japan | 5.2% |
| South Korea | 5.1% |
| USA | 4.9% |
| UK | 4.8% |
| European Union | 4.6% |
- China leads with a 7.0% CAGR driven by substantial investments in healthcare and industrial sectors, fueling the demand for non-GMO verified sports drink products.
- India comes next at 6.5% with infrastructure expansion and increasing market penetration.
- Steady growth is being seen in Japan (5.2%) and South Korea (5.1%) backed by established demand and regulatory support.
Global non-GMO verified sports drink market is anticipated to grow at a CAGR of 5.2% from 2026 to 2036. The study covers more than 30 countries and the key markets are listed below.
What is the non-GMO verified sports drink market outlook in the United States?
4.9% CAGR, driven by Proven market leadership in the verified sports drink category, with established non-GMO
The USA is expected to grow at a CAGR of 4.9% through 2036. Proven market leadership in the verified sports drink category, with established non-GMO certification infrastructure and strong retail demand for clean-label beverages.
- Non-GMO Project Verified labeling is generally recognized by US consumers and the purchase preference that follows results in shelf space at major retail chains.
- Direct-to-consumer e-commerce brands are gaining market share with subscription models that lower customer acquisition costs and improve repeat purchase rates.
- The number of non-GMO verified sports drink SKUs offered across grocery, convenience and specialty retail formats is being driven by sustainability in the retailer and clean-label procurement policies.
How fast is the non-GMO verified sports drink market growing in China?
7.0% CAGR through 2036, the fastest country-level market in the study
China to drive global growth at 7.0% CAGR to 2036. The demand for non-GMO verified sports drinks is being fueled by the fast growth of fitness culture, e-commerce beverage buying, and a growing consumer focus on ingredient quality.
- Non-GMO sports drink brands are using e-commerce platforms, including major domestic marketplaces, to distribute to consumers in tier-1 and tier-2 cities.
- The rising participation in fitness, gym membership and organized sports events are expanding the consumer base for sports hydration products beyond the traditional athlete demographic.
- Domestic beverage makers are earning non-GMO certifications in an effort to distinguish their products in an increasingly crowded sports drink marketplace where price competition is fierce.
What is driving non-GMO verified sports drink growth in India?
6.5% CAGR, driven by Urbanization, growing disposable income,
India is projected to grow at a CAGR of 6.5% through 2036. Urbanization, growing disposable income, and increasing fitness culture are creating a huge consumer base for premium hydration products with clean-label positioning.
- As fitness centres and recreational sports become more common in cities, more consumers are being exposed to sports hydration products outside the context of cricket and outdoor activities.
- The growth in the e-commerce channel is overcoming the challenges of traditional retail distribution in tier-2 and tier-3 cities, where availability of specialty beverages has traditionally been limited.
- Beverage companies are ramping up domestic manufacturing, enhancing the cost competitiveness of non-GMO verified formulations for India’s price sensitive consumer segment.
How is the non-GMO verified sports drink market performing in Japan?
5.2% CAGR, driven by Consumer focus on product quality, ingredient transparency and functional health benefits
Japan is expected to register a CAGR of 5.2% through 2036. Consumer focus on product quality, ingredient transparency and functional health benefits supports ongoing demand for verified non-GMO sports hydration products.
- Quality-conscious Japanese consumers’ desire for transparency in ingredient sourcing and third-party verification is driving natural demand for non-GMO certified sports drinks.
- Convenience store distribution networks offer high frequency points of consumer access for single serve non-GMO sports drink purchases in urban and suburban settings.
- Functional beverage positioning, combining hydration and additional health claims, is extending product appeal beyond sports-specific use occasions.
What is the non-GMO verified sports drink market forecast for South Korea?
5.1% CAGR, driven by Health and wellness consumer trends and sophisticated e-commerce infrastructure
South Korea CAGR is expected to register 5.1% till 2036. Health and wellness consumer trends and sophisticated e-commerce infrastructure underpin the uptake of premium non-GMO verified sports hydration products.
- Online shopping sites offer sophisticated product filters that make it easy for consumers to find and purchase non-GMO verified beverages.
- The growth of fitness culture among younger demographics is driving the expansion of the consumer base for sports hydration products focused on clean-label values.
- Retailer private label development in the non-GMO sports drink category is increasing shelf space availability and price competition.
What is the growth outlook for the non-GMO verified sports drink market in the United Kingdom?
4.8% CAGR, driven by adoption of sports drinks verified as non-GMO
The UK is expected to register CAGR of 4.8% during 2026 to 2036. The adoption of sports drinks verified as non-GMO is being driven by consumer demand for transparent sourcing of ingredients and retailer commitments to sustainability.
- Major UK retailers are growing their non-GMO and clean-label product ranges to cater to consumer demand for ingredient transparency.
- Post-Brexit packaging and labelling rules are establishing differentiated compliance obligations that favor well-known, certified brands.
- Growth in fitness participation across gym chains and outdoor activity demographics is driving increasing occasions of consumption of sports drinks.
Who are the leading companies in the non-GMO verified sports drink market?
PepsiCo (Gatorade), The Coca-Cola Company (Powerade), Glacéau (Vitaminwater), and Bodyarmor
- PepsiCo (Gatorade) dominates the market, with broad retail distribution, brand awareness and continued line extensions to clean-label and non-GMO certified formulations.
- Powerade (The Coca-Cola Company) is competing on extensive retail presence and marketing investment with increasing focus on functional hydration and ingredient transparency positioning.
- Faster-growing challengers like Bodyarmor that have gained share through health-focused positioning and strong online distribution strategies.
- The competitive environment is heating up with traditional sports drink brands rushing to get non-GMO certified to protect market share from clean-label specialists.
Who are the key players in the non-GMO verified sports drink market?
PepsiCo (Gatorade), The Coca-Cola Company (Powerade), Glacéau (Vitaminwater) and Bodyarmor, plus regional players
Key global companies leading the non-GMO verified sports drink market include:
- PepsiCo (USA), The Coca-Cola Company (USA), lead global non-GMO verified sports drink markets through extensive retail distribution networks, established brand equity, and portfolio diversification into clean-label and functional hydration categories.
- Bodyarmor (USA) have established strong positions through health-focused brand positioning, digital marketing strategies, and targeted distribution in fitness and wellness retail channels.
- Karma Wellness Water (USA) are gaining traction through differentiated product formulations, premium ingredient sourcing, and direct-to-consumer distribution models that appeal to health-conscious early adopters.
How do top non-GMO verified sports drink companies compare?
PepsiCo (Gatorade) and The Coca-Cola Company (Powerade) lead globally; Glacéau (Vitaminwater) and Bodyarmor are regional specialists
| Company | Product Portfolio Breadth | Retail Distribution Strength | Online/DTC Presence | Geographic Footprint |
|---|---|---|---|---|
| PepsiCo (Gatorade) | High | Strong | Strong | Global |
| Coca-Cola (Powerade) | High | Strong | Strong | Global |
| Red Bull GmbH | Medium | Strong | Moderate | Global |
| Bodyarmor | Medium | Moderate | Moderate | N. America |
| Karma Wellness Water | Low | Low | Low | N. America |
Source: Future Market Insights competitive analysis, 2026.
Key Developments in Non-GMO Verified Sports Drink Market
- In 2025, PepsiCo continued strengthening its health-focused beverage portfolio through ongoing innovation across the Gatorade brand, addressing consumer demand for cleaner-label hydration products and transparent ingredient sourcing.
- In 2025, BODYARMOR continued expanding its presence in the premium sports hydration category, emphasizing naturally sourced ingredients, coconut water-based formulations, and clean-label positioning to appeal to health-conscious consumers.
Key Players in the Non-GMO Verified Sports Drink Market
Major Global Players
- PepsiCo (Gatorade)
- The Coca-Cola Company (Powerade)
- Glacéau (Vitaminwater)
- Bodyarmor
Emerging Players/Startups
- Karma Wellness Water
- ROAR Organic
- NOOMA
- GoodSport Nutrition
- Cure Hydration
- Greater Than Sports Drink
Non-GMO Verified Sports Drink Market - Research Methodology
| Method | Description |
|---|---|
| Primary Research | FMI analysts conducted interviews with manufacturers, distributors, procurement specialists, and end-use operators across China, India, and Japan to validate demand patterns and pricing structures for Isotonic, and Hypertonic and related product categories. |
| Desk Research | Combined trade statistics, regulatory filings, industry association data, and manufacturer disclosures to establish baseline parameters for Non-GMO Verified Sports Drink across product, distribution channel, end use, ingredients, flavor, and packaging segments. |
| Market Sizing & Forecasting | Bottom-up aggregation across Isotonic, Hypertonic, and Hypotonic product categories and Online, and Offline distribution channel segments, triangulated with top-down macro indicators and regional adoption curves. |
| Data Validation | Cross-checked quarterly against production statistics, trade flow data, and manufacturer revenue disclosures for Non-GMO Verified Sports Drink products. |
What does the non-GMO verified sports drink market report cover?
2016 to 2025 history and 2026 to 2036 forecasts across all segments and 30+ countries
| Parameter | Details |
|---|---|
| Market size by 2036 | USD 19.0 Bn |
| Growth rate | 5.2% CAGR (2026 to 2036) |
| Forecast period | 2026 to 2036 |
| Base year value (2025) | USD 10.9 Bn |
| Key Segment Covered | Product Type, Distribution Channel, End Use, Ingredients, Flavor, Packaging Type |
| Regions covered | North America, Latin America, Eastern Europe, Western Europe, East Asia, South Asia and Pacific, Middle East and Africa |
| Countries covered | USA, China, India, Japan, South Korea, UK, European Union, 30 plus countries |
| Key companies profiled | PepsiCo (Gatorade), The Coca-Cola Company (Powerade), Glacéau (Vitaminwater), Bodyarmor, Karma Wellness Water |
| Approach | Hybrid bottom-up and top-down methodology starting with verified transaction data, projecting adoption velocity across segments and regions. |
Market Segmentation Analysis
Non-GMO Verified Sports Drink Market Segmented by Product Type:
- Isotonic
- Balanced Electrolyte Formulation
- Rapid Hydration Support
- Exercise Recovery Benefits
- Endurance Performance Drinks
- Fluid Replacement Efficiency
- Energy Balance Maintenance
- Balanced Electrolyte Formulation
- Hypertonic
- High Carbohydrate Formulation
- Post Workout Energy Recovery
- Glycogen Restoration Support
- Concentrated Sports Drinks
- Intense Training Recovery
- Long Duration Energy Supply
- High Carbohydrate Formulation
- Hypotonic
- Low Carbohydrate Formulation
- Fast Fluid Absorption
- Light Hydration Support
- Quick Rehydration Drinks
- Low Calorie Sports Nutrition
- Short Duration Activity Support
- Low Carbohydrate Formulation
Non-GMO Verified Sports Drink Market Segmented by Distribution Channel:
- Online
- E Commerce Platforms
- Direct To Consumer Sales
- Subscription Based Deliveries
- Brand Websites
- Personalized Product Offerings
- Home Delivery Services
- E Commerce Platforms
- Offline
- Supermarkets And Hypermarkets
- Mass Market Availability
- Retail Shelf Presence
- Health And Specialty Stores
- Organic Sports Nutrition Products
- Premium Product Selection
- Fitness Centers And Gyms
- On Site Sports Drink Sales
- Targeted Athlete Distribution
- Supermarkets And Hypermarkets
Non-GMO Verified Sports Drink Market Segmented by End Use:
- Athletes
- Professional Athletes
- Performance Hydration Support
- Intensive Training Recovery
- Amateur Athletes
- Workout Energy Replacement
- Endurance Enhancement
- Professional Athletes
- Casual Sports Drink Consumers
- Daily Fitness Consumers
- General Hydration Support
- Healthy Lifestyle Products
- Health Conscious Consumers
- Natural Ingredient Preference
- Non GMO Beverage Demand
- Daily Fitness Consumers
- Recreational Users
- Outdoor Activity Participants
- Hydration During Recreation
- Convenient Energy Support
- Gym And Fitness Users
- Post Exercise Recovery
- Low Sugar Beverage Preference
- Outdoor Activity Participants
Non-GMO Verified Sports Drink Market Segmented by Ingredients:
- Electrolytes
- Potassium And Magnesium
- Hydration Balance Support
- Muscle Function Maintenance
- Calcium Electrolytes
- Cramp Prevention Support
- Fluid Retention Control
- Potassium And Magnesium
- Vitamins
- Vitamin B Complex
- Energy Metabolism Support
- Exercise Performance Benefits
- Vitamin C And E
- Antioxidant Protection
- Immune System Support
- Vitamin B Complex
- Carbohydrates
- Natural Sugars
- Quick Energy Supply
- Workout Endurance Support
- Complex Carbohydrates
- Sustained Energy Release
- Recovery Nutrition Benefits
- Natural Sugars
- Sodium
- Sodium Chloride Formulations
- Electrolyte Replenishment
- Sweat Loss Compensation
- Low Sodium Variants
- Controlled Sodium Intake
- Health Focused Hydration
- Sodium Chloride Formulations
Non-GMO Verified Sports Drink Market Segmented by Flavor:
- Citrus Flavors
- Lemon And Lime Variants
- Refreshing Taste Profile
- Popular Hydration Choice
- Orange Based Drinks
- Vitamin Rich Flavor Appeal
- Workout Recovery Support
- Lemon And Lime Variants
- Berry Flavors
- Blueberry And Raspberry
- Antioxidant Rich Ingredients
- Natural Fruit Taste
- Mixed Berry Blends
- Premium Flavor Experience
- Health Focused Formulations
- Blueberry And Raspberry
- Tropical Flavors
- Mango And Pineapple
- Exotic Taste Preference
- Summer Sports Hydration
- Coconut Based Variants
- Natural Electrolyte Support
- Functional Hydration Benefits
- Mango And Pineapple
Non-GMO Verified Sports Drink Market Segmented by Packaging Type:
- Bottles
- PET Bottles
- Lightweight Packaging Solution
- Convenient On The Go Usage
- Recyclable Bottles
- Sustainable Packaging Preference
- Eco Friendly Product Appeal
- PET Bottles
- Cans
- Aluminum Cans
- Extended Shelf Stability
- Portable Sports Packaging
- Slim Can Formats
- Modern Product Presentation
- Quick Consumption Convenience
- Aluminum Cans
- Pouches
- Resealable Pouches
- Flexible Packaging Design
- Travel Friendly Hydration
- Single Serve Sachets
- Portion Controlled Consumption
- Easy Mixing Applications
- Resealable Pouches
Non-GMO Verified Sports Drink Market by Region:
- North America
- USA
- Canada
- Mexico
- Latin America
- Brazil
- Chile
- Rest of Latin America
- Western Europe
- Germany
- UK
- Italy
- Spain
- France
- Nordic
- BENELUX
- Rest of Western Europe
- Eastern Europe
- Russia
- Poland
- Hungary
- Balkan & Baltic
- Rest of Eastern Europe
- East Asia
- China
- Japan
- South Korea
- South Asia and Pacific
- India
- ASEAN
- Australia & New Zealand
- Rest of South Asia and Pacific
- Middle East & Africa
- Kingdom of Saudi Arabia
- Other GCC Countries
- Türkiye
- South Africa
- Other African Union
- Rest of Middle East & Africa
Research Sources and Bibliography
- Non-GMO Project. (2025). Non-GMO Project Verified Standard. Non-GMO Project.
- USA Food and Drug Administration. (2025). FDA Guidance on Beverage Labeling and Certification. FDA.
- European Food Safety Authority. (2025). EFSA Scientific Opinion on Sports Nutrition Claims. EFSA.
- International Society of Sports Nutrition. (2025). ISSN Position Stand on Electrolyte Supplementation. ISSN.
- World Health Organization. (2025). WHO Guidelines on Nutritional Labeling for Functional Beverages. WHO.
This bibliography is provided for reader reference.
This Report Answers
- Estimating the size of the non-GMO verified sports drink market and projected revenue from 2026 to 2036.
- Segmentation by product type, distribution channel, end use, ingredients, flavor, packaging type.
- Insights about more than 30 regional markets.
- Analysis of key market dynamics including demand drivers, restraints, and emerging opportunities.
- Assessment of the competitive landscape and strategic positioning of leading companies.
- Identifying investment opportunities across key product segments and geographic markets.
- Supply chain and distribution channel analysis.
- Delivery of data in PDF and Excel formats.
Frequently Asked Questions
How big is the non-gmo verified sports drink market in 2026?
The global non-gmo verified sports drink market is estimated to be valued at USD 11.4 billion in 2026.
What will be the size of the non-gmo verified sports drink market in 2036?
The market size for the non-gmo verified sports drink market is projected to reach USD 19.0 billion by 2036.
How much will the non-gmo verified sports drink market growth be between 2026 and 2036?
The non-gmo verified sports drink market is expected to grow at a 5.2% CAGR between 2026 and 2036.
What are the key product types in the non-gmo verified sports drink market?
The key product types in the non-gmo verified sports drink market are Isotonic, Hypertonic and Hypotonic.
Which distribution channel segment is expected to contribute a significant share in the non-gmo verified sports drink market in 2026?
In terms of distribution channel, the online segment is expected to command 63.0% share in the non-gmo verified sports drink market in 2026.
Preview the report firsthand - request a free sample
Get SampleGet the brochure for pricing and purchase details.
Get PDFTable of Content
- Key Takeaways
- Market Size and CAGR
- Top Growth Driver
- Fastest Growing Segment
- Leading Region
- Key Companies
- Emerging Opportunities
- Executive Summary
- Global Market Outlook
- Demand-side Trends
- Supply-side Trends
- Technology Roadmap Analysis
- Analysis and Recommendations
- Analyst Perspective (What is happening? Why now? What should investors know?)
- Key Questions Answered
- How large is the market?
- What is the CAGR?
- What are key trends?
- Which region dominates?
- Who are the leaders?
- Market Overview
- Market Coverage / Taxonomy
- Market Definition / Scope / Limitations
- Research Methodology
- Chapter Orientation
- Analytical Lens and Working Hypotheses
- Market Structure, Signals, and Trend Drivers
- Benchmarking and Cross-market Comparability
- Market Sizing, Forecasting, and Opportunity Mapping
- Research Design and Evidence Framework
- Desk Research Programme (Secondary Evidence)
- Expert Input and Fieldwork (Primary Evidence)
- Tooling, Models, and Reference Databases
- Data Engineering and Model Build
- Quality Assurance and Audit Trail
- Market Background
- Market Dynamics (Drivers, Restraints, Opportunity, Trends)
- Scenario Forecast (Optimistic, Likely, Conservative)
- Impact Analysis
- AI Impact
- Sustainability Impact
- Regulatory Impact
- Technology Impact
- Consumer / Buyer Analysis
- Purchase Drivers
- Adoption Barriers
- Buyer Journey
- Opportunity Map Analysis
- Product Life Cycle Analysis
- Supply Chain Analysis
- Investment Feasibility Matrix
- Value Chain Analysis
- PESTLE and Porter's Analysis
- Regulatory Landscape
- Regional Parent Market Outlook
- Production and Consumption Statistics
- Import and Export Statistics
- Global Market Analysis and Forecast, 2021 to 2036
- Historical Market Size Value (USD Million) Analysis, 2021 to 2025
- Current and Future Market Size Value (USD Million) Projections, 2026 to 2036
- Y-o-Y Growth Trend Analysis
- Absolute $ Opportunity Analysis
- Global Market Pricing Analysis, 2021 to 2036
- Global Market Analysis and Forecast, By Product Type, 2021 to 2036
- Introduction / Key Findings
- Historical Market Size Value (USD Million) Analysis By Product Type, 2021 to 2025
- Current and Future Market Size Value (USD Million) Analysis and Forecast By Product Type, 2026 to 2036
- Isotonic
- Balanced Electrolyte Formulation
- Endurance Performance Drinks
- Hypertonic
- High Carbohydrate Formulation
- Concentrated Sports Drinks
- Hypotonic
- Low Carbohydrate Formulation
- Quick Rehydration Drinks
- Isotonic
- Y-o-Y Growth Trend Analysis By Product Type, 2021 to 2025
- Absolute $ Opportunity Analysis By Product Type, 2026 to 2036
- Global Market Analysis and Forecast, By Distribution Channel, 2021 to 2036
- Introduction / Key Findings
- Historical Market Size Value (USD Million) Analysis By Distribution Channel, 2021 to 2025
- Current and Future Market Size Value (USD Million) Analysis and Forecast By Distribution Channel, 2026 to 2036
- Online
- E Commerce Platforms
- Brand Websites
- Offline
- Supermarkets And Hypermarkets
- Health And Specialty Stores
- Online
- Y-o-Y Growth Trend Analysis By Distribution Channel, 2021 to 2025
- Absolute $ Opportunity Analysis By Distribution Channel, 2026 to 2036
- Global Market Analysis and Forecast, By End Use, 2021 to 2036
- Introduction / Key Findings
- Historical Market Size Value (USD Million) Analysis By End Use, 2021 to 2025
- Current and Future Market Size Value (USD Million) Analysis and Forecast By End Use, 2026 to 2036
- Athletes
- Professional Athletes
- Amateur Athletes
- Casual Sports Drink Consumers
- Daily Fitness Consumers
- Health Conscious Consumers
- Recreational Users
- Outdoor Activity Participants
- Gym And Fitness Users
- Athletes
- Y-o-Y Growth Trend Analysis By End Use, 2021 to 2025
- Absolute $ Opportunity Analysis By End Use, 2026 to 2036
- Global Market Analysis and Forecast, By Ingredients, 2021 to 2036
- Introduction / Key Findings
- Historical Market Size Value (USD Million) Analysis By Ingredients, 2021 to 2025
- Current and Future Market Size Value (USD Million) Analysis and Forecast By Ingredients, 2026 to 2036
- Electrolytes
- Potassium And Magnesium
- Calcium Electrolytes
- Vitamins
- Vitamin B Complex
- Vitamin C And E
- Carbohydrates
- Natural Sugars
- Complex Carbohydrates
- Sodium
- Sodium Chloride Formulations
- Low Sodium Variants
- Electrolytes
- Y-o-Y Growth Trend Analysis By Ingredients, 2021 to 2025
- Absolute $ Opportunity Analysis By Ingredients, 2026 to 2036
- Global Market Analysis and Forecast, By Flavor, 2021 to 2036
- Introduction / Key Findings
- Historical Market Size Value (USD Million) Analysis By Flavor, 2021 to 2025
- Current and Future Market Size Value (USD Million) Analysis and Forecast By Flavor, 2026 to 2036
- Citrus Flavors
- Lemon And Lime Variants
- Orange Based Drinks
- Berry Flavors
- Blueberry And Raspberry
- Mixed Berry Blends
- Tropical Flavors
- Mango And Pineapple
- Coconut Based Variants
- Citrus Flavors
- Y-o-Y Growth Trend Analysis By Flavor, 2021 to 2025
- Absolute $ Opportunity Analysis By Flavor, 2026 to 2036
- Global Market Analysis and Forecast, By Packaging Type
- Introduction / Key Findings
- Historical Market Size Value (USD Million) Analysis By Packaging Type, 2021 to 2025
- Current and Future Market Size Value (USD Million) Analysis and Forecast By Packaging Type, 2026 to 2036
- Bottles
- PET Bottles
- Recyclable Bottles
- Cans
- Aluminum Cans
- Slim Can Formats
- Pouches
- Resealable Pouches
- Single Serve Sachets
- Bottles
- Y-o-Y Growth Trend Analysis By Packaging Type, 2021 to 2025
- Absolute $ Opportunity Analysis By Packaging Type, 2026 to 2036
- Global Market Analysis and Forecast, By Region, 2021 to 2036
- Introduction
- Historical Market Size Value (USD Million) Analysis By Region, 2021 to 2025
- Current Market Size Value (USD Million) Analysis and Forecast By Region, 2026 to 2036
- North America
- Latin America
- Western Europe
- Eastern Europe
- East Asia
- South Asia and Pacific
- Middle East & Africa
- Market Attractiveness Analysis By Region
- North America Market Analysis and Forecast, By Country, 2021 to 2036
- Historical Market Size Value (USD Million) Trend Analysis By Market Taxonomy, 2021 to 2025
- Market Size Value (USD Million) Forecast By Market Taxonomy, 2026 to 2036
- By Country
- USA
- Canada
- Mexico
- By Product Type
- By Distribution Channel
- By End Use
- By Ingredients
- By Flavor
- By Packaging Type
- By Country
- Market Attractiveness Analysis
- By Country
- By Product Type
- By Distribution Channel
- By End Use
- By Ingredients
- By Flavor
- By Packaging Type
- Key Takeaways
- Latin America Market Analysis and Forecast, By Country
- Historical Market Size Value (USD Million) Trend Analysis By Market Taxonomy, 2021 to 2025
- Market Size Value (USD Million) Forecast By Market Taxonomy, 2026 to 2036
- By Country
- Brazil
- Chile
- Rest of Latin America
- By Product Type
- By Distribution Channel
- By End Use
- By Ingredients
- By Flavor
- By Packaging Type
- By Country
- Market Attractiveness Analysis
- By Country
- By Product Type
- By Distribution Channel
- By End Use
- By Ingredients
- By Flavor
- By Packaging Type
- Key Takeaways
- Western Europe Market Analysis and Forecast, By Country
- Historical Market Size Value (USD Million) Trend Analysis By Market Taxonomy, 2021 to 2025
- Market Size Value (USD Million) Forecast By Market Taxonomy, 2026 to 2036
- By Country
- Germany
- UK
- Italy
- Spain
- France
- Nordic
- BENELUX
- Rest of Western Europe
- By Product Type
- By Distribution Channel
- By End Use
- By Ingredients
- By Flavor
- By Packaging Type
- By Country
- Market Attractiveness Analysis
- By Country
- By Product Type
- By Distribution Channel
- By End Use
- By Ingredients
- By Flavor
- By Packaging Type
- Key Takeaways
- Eastern Europe Market Analysis and Forecast, By Country
- Historical Market Size Value (USD Million) Trend Analysis By Market Taxonomy, 2021 to 2025
- Market Size Value (USD Million) Forecast By Market Taxonomy, 2026 to 2036
- By Country
- Russia
- Poland
- Hungary
- Balkan & Baltic
- Rest of Eastern Europe
- By Product Type
- By Distribution Channel
- By End Use
- By Ingredients
- By Flavor
- By Packaging Type
- By Country
- Market Attractiveness Analysis
- By Country
- By Product Type
- By Distribution Channel
- By End Use
- By Ingredients
- By Flavor
- By Packaging Type
- Key Takeaways
- East Asia Market Analysis and Forecast, By Country
- Historical Market Size Value (USD Million) Trend Analysis By Market Taxonomy, 2021 to 2025
- Market Size Value (USD Million) Forecast By Market Taxonomy, 2026 to 2036
- By Country
- China
- Japan
- South Korea
- By Product Type
- By Distribution Channel
- By End Use
- By Ingredients
- By Flavor
- By Packaging Type
- By Country
- Market Attractiveness Analysis
- By Country
- By Product Type
- By Distribution Channel
- By End Use
- By Ingredients
- By Flavor
- By Packaging Type
- Key Takeaways
- South Asia and Pacific Market Analysis and Forecast, By Country
- Historical Market Size Value (USD Million) Trend Analysis By Market Taxonomy, 2021 to 2025
- Market Size Value (USD Million) Forecast By Market Taxonomy, 2026 to 2036
- By Country
- India
- ASEAN
- Australia & New Zealand
- Rest of South Asia and Pacific
- By Product Type
- By Distribution Channel
- By End Use
- By Ingredients
- By Flavor
- By Packaging Type
- By Country
- Market Attractiveness Analysis
- By Country
- By Product Type
- By Distribution Channel
- By End Use
- By Ingredients
- By Flavor
- By Packaging Type
- Key Takeaways
- Middle East & Africa Market Analysis and Forecast, By Country
- Historical Market Size Value (USD Million) Trend Analysis By Market Taxonomy, 2021 to 2025
- Market Size Value (USD Million) Forecast By Market Taxonomy, 2026 to 2036
- By Country
- Kingdom of Saudi Arabia
- Other GCC Countries
- Türkiye
- South Africa
- Other African Union
- Rest of Middle East & Africa
- By Product Type
- By Distribution Channel
- By End Use
- By Ingredients
- By Flavor
- By Packaging Type
- By Country
- Market Attractiveness Analysis
- By Country
- By Product Type
- By Distribution Channel
- By End Use
- By Ingredients
- By Flavor
- By Packaging Type
- Key Takeaways
- Key Countries Market Analysis
- USA
- Pricing Analysis
- Market Share Analysis, 2025
- By Product Type
- By Distribution Channel
- By End Use
- By Ingredients
- By Flavor
- By Packaging Type
- Canada
- Pricing Analysis
- Market Share Analysis, 2025
- By Product Type
- By Distribution Channel
- By End Use
- By Ingredients
- By Flavor
- By Packaging Type
- Mexico
- Pricing Analysis
- Market Share Analysis, 2025
- By Product Type
- By Distribution Channel
- By End Use
- By Ingredients
- By Flavor
- By Packaging Type
- Brazil
- Pricing Analysis
- Market Share Analysis, 2025
- By Product Type
- By Distribution Channel
- By End Use
- By Ingredients
- By Flavor
- By Packaging Type
- Chile
- Pricing Analysis
- Market Share Analysis, 2025
- By Product Type
- By Distribution Channel
- By End Use
- By Ingredients
- By Flavor
- By Packaging Type
- Germany
- Pricing Analysis
- Market Share Analysis, 2025
- By Product Type
- By Distribution Channel
- By End Use
- By Ingredients
- By Flavor
- By Packaging Type
- UK
- Pricing Analysis
- Market Share Analysis, 2025
- By Product Type
- By Distribution Channel
- By End Use
- By Ingredients
- By Flavor
- By Packaging Type
- Italy
- Pricing Analysis
- Market Share Analysis, 2025
- By Product Type
- By Distribution Channel
- By End Use
- By Ingredients
- By Flavor
- By Packaging Type
- Spain
- Pricing Analysis
- Market Share Analysis, 2025
- By Product Type
- By Distribution Channel
- By End Use
- By Ingredients
- By Flavor
- By Packaging Type
- France
- Pricing Analysis
- Market Share Analysis, 2025
- By Product Type
- By Distribution Channel
- By End Use
- By Ingredients
- By Flavor
- By Packaging Type
- India
- Pricing Analysis
- Market Share Analysis, 2025
- By Product Type
- By Distribution Channel
- By End Use
- By Ingredients
- By Flavor
- By Packaging Type
- ASEAN
- Pricing Analysis
- Market Share Analysis, 2025
- By Product Type
- By Distribution Channel
- By End Use
- By Ingredients
- By Flavor
- By Packaging Type
- Australia & New Zealand
- Pricing Analysis
- Market Share Analysis, 2025
- By Product Type
- By Distribution Channel
- By End Use
- By Ingredients
- By Flavor
- By Packaging Type
- China
- Pricing Analysis
- Market Share Analysis, 2025
- By Product Type
- By Distribution Channel
- By End Use
- By Ingredients
- By Flavor
- By Packaging Type
- Japan
- Pricing Analysis
- Market Share Analysis, 2025
- By Product Type
- By Distribution Channel
- By End Use
- By Ingredients
- By Flavor
- By Packaging Type
- South Korea
- Pricing Analysis
- Market Share Analysis, 2025
- By Product Type
- By Distribution Channel
- By End Use
- By Ingredients
- By Flavor
- By Packaging Type
- Russia
- Pricing Analysis
- Market Share Analysis, 2025
- By Product Type
- By Distribution Channel
- By End Use
- By Ingredients
- By Flavor
- By Packaging Type
- Poland
- Pricing Analysis
- Market Share Analysis, 2025
- By Product Type
- By Distribution Channel
- By End Use
- By Ingredients
- By Flavor
- By Packaging Type
- Hungary
- Pricing Analysis
- Market Share Analysis, 2025
- By Product Type
- By Distribution Channel
- By End Use
- By Ingredients
- By Flavor
- By Packaging Type
- Kingdom of Saudi Arabia
- Pricing Analysis
- Market Share Analysis, 2025
- By Product Type
- By Distribution Channel
- By End Use
- By Ingredients
- By Flavor
- By Packaging Type
- Türkiye
- Pricing Analysis
- Market Share Analysis, 2025
- By Product Type
- By Distribution Channel
- By End Use
- By Ingredients
- By Flavor
- By Packaging Type
- South Africa
- Pricing Analysis
- Market Share Analysis, 2025
- By Product Type
- By Distribution Channel
- By End Use
- By Ingredients
- By Flavor
- By Packaging Type
- USA
- Market Structure Analysis
- Competition Dashboard
- Competition Benchmarking
- Market Share Analysis of Top Players
- By Regional
- By Product Type
- By Distribution Channel
- By End Use
- By Ingredients
- By Flavor
- By Packaging Type
- Emerging Startups
- Innovation Benchmarking
- Competition Analysis
- Competition Deep Dive
- PepsiCo (Gatorade)
- Overview
- Product Portfolio
- Profitability by Market Segments (Product/Region/Sales Channel)
- Sales Footprint
- Strategy Overview
- Marketing Strategy
- Product Strategy
- Channel Strategy
- The Coca-Cola Company (Powerade)
- Red Bull GmbH
- Nestlé (Nestlé Pure Life)
- Glacéau (Vitaminwater)
- Bodyarmor
- Icelandic Glacial
- Celsius Holdings Inc.
- Sobe Lifewater
- The Smartwater (Coca-Cola)
- Muscle Milk (PepsiCo)
- Lucozade
- Karma Wellness Water
- PepsiCo (Gatorade)
- Case Studies
- Success Stories
- Recent Developments
- Competition Deep Dive
- Assumptions & Acronyms Used


