Drinkable Yogurt Market Outlook (2022 to 2032)

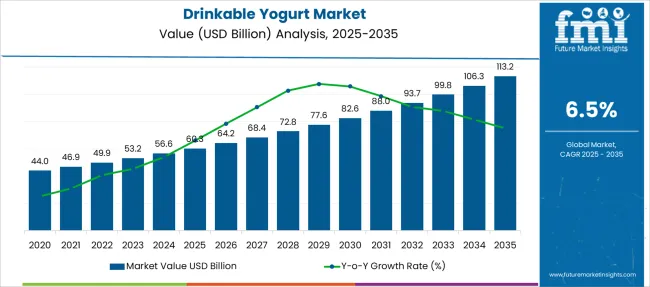
The global drinkable yogurt market is expected to reach a valuation of USD 50 Billion by the end of 2022, accelerating with a CAGR of 6.5% by 2022 to 2032, to reach a value of USD 94 Billion by 2032.

Attribute Details
Drinkable Yogurt Market Size (2022E) USD 50.0 Billion
Drinkable Yogurt Market Projected Size (2032F) USD 94.0 Billion
Value CAGR (2021 to 2031) 6.5 CAGR
Top 3 Countries' Market Share 37%

The drinkable yogurt market accounted for 20% of the total dairy industry globally in 2022 and is expected to rise due to changes in consumer lifestyle and an increase in worldwide disposable income.

The market's expansion can be linked to increased consumer awareness of lifestyle problems and the resulting trend toward healthier, probiotic-rich foods. The food is high in nutrients that promote good health and lower the risk of disorders like obesity. The key drinkable yogurt market trends are driving the demand favorably.

Don't pay for what you don't need

Customize your report by selecting specific countries or regions and save 30%!

How Does Drinkable Yogurt Market Historic and Future Outlook Compare?

In order to maintain good health, consumers have increased the adoption of probiotics in their daily diet. Yogurt is one of the most favored prebiotics. As a result, the demand for drinkable yogurt is expected to rise in the near future.

Key players are focusing on introducing different flavors in order to appeal to a wide range of audiences. In order to utilize the consumer preference for plant-based product flavors like carrot and beetroot in addition to fruit-derived flavors like strawberry, coconut, and banana are easily available in the market. The drinkable yogurt market outlook is expected to shift the dairy consumption dynamics of consumers.

The drinkable yogurt market grew at a CAGR of 5.5% between 2017 and 2021. The period marked rapid product development, with the key players taking advantage of the significant opportunities being presented in the yogurt market.

As per the drinkable yogurt market study, consumers have reduced their intake of sugar in order to fulfill the demand of health-conscious consumers. As a result, stevia - a natural sweetener, is being adopted in drinkable yogurts. In order to maintain gut health, consumers are willing to spend on healthy eatables, thereby driving the sales of drinkable yogurt. All these factors are expected to propel the demand for drinkable yogurt in the market.

The easy availability of different types of drinkable yogurt in the market and consumer inclination toward health and wellness is expected to generate many opportunities in the drinkable yogurt market. Key players are focusing on developing beverages from organic ingredients as consumers prefer clean-label products.

Drinkable Yogurt Market

What are the Market Trends for Drinkable Yogurt Market?

Consumers are emphasizing the importance of maintaining good health and focusing on consuming food and beverages that help build body immunity. The demand for drinkable yogurt is rising as it has multiple functional ingredients.

A surge in the number of cases related to lifestyle illness has pushed consumers to buy healthy food products to maintain gut health. As consumers are aware of the benefits of including probiotic drinks to prevent gastrointestinal conditions like constipation, the demand for drinkable yogurt is expected to rise.

Packaging plays a crucial role in enhancing the shelf life of yogurt. Companies are sharing information related to processes and ingredients used in producing drinkable yogurt in order to maintain transparency to win over consumers. In order to entice consumers, key players are launching drinkable yogurt with additional functional properties and flavors. This marketing strategy being followed by the companies in the drinkable yogurt market is expected to yield favorable results.

Nandini Roy Choudhury

Principal Consultant

Talk to Analyst

Find your sweet spots for generating winning opportunities in this market.

How has the Drinkable Yogurt Market Accelerated Its Growth Post Covid?

As per the drinkable yogurt market analysis, consumers began to pay attention to their health during the pandemic, which led to their purchasing patterns changing significantly. This unexpected pandemic highlighted the importance of staying healthy in order to build resistance against invasive viruses. People began prioritizing the purchase of nutritious fluids, which further influenced the sales of drinkable yogurt.

Probiotics are included in people's everyday diets in order to maintain optimum health. In the coming years, this is projected to boost demand for drinkable yogurt drinks. In order to meet evolving consumer demands, many companies have introduced vegan, low-calorie, and gluten-free options.

Initially, due to the disruption of the supply chain, there was a scarcity of drinkable yogurts in the market. Travel restrictions and the closure of manufacturing industries further affected the sale of drinkable yogurts, but as the situation bounced back, people started spending on health-related products. The drinkable yogurt market has recovered from the pandemic and is expected to show a steady growth rate in the near future.
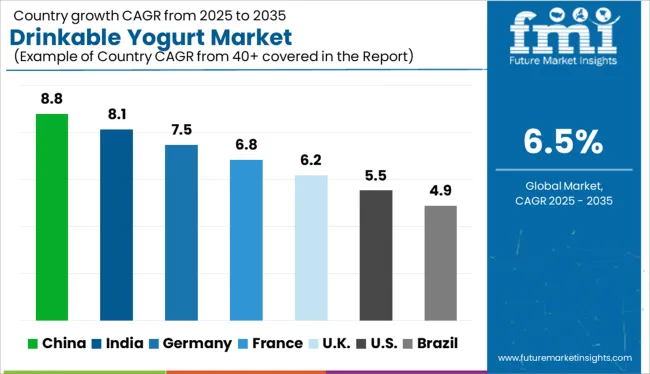
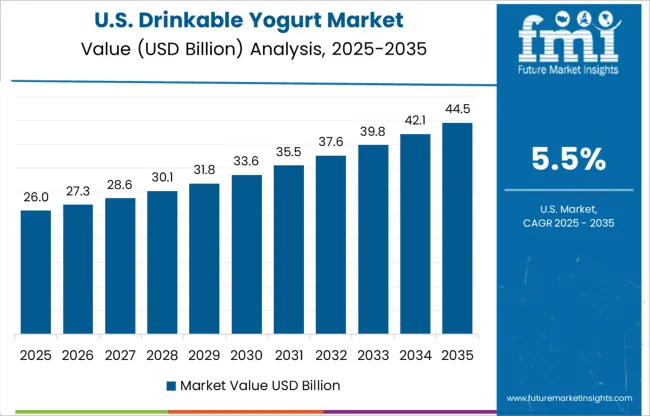
Country-wise Insights

How is the USA Drinkable Yogurt Market Shaping?

North America is at the forefront of the drinkable yogurt market due to the easy availability of the product. There is a regional presence of key players like Chobani and General Mills. They are launching sugar-free, vegan variants of drinkable yogurt in order to fulfill changing consumer requirements.

With the increase in consumer awareness, the demand for immunity-boosting food products has increased in the past few years. The younger generation is mindful of the food they eat and focuses on exercising daily, which in turn is expected to impact the demand for drinkable yogurts in North America. As per FMI, the USA drinkable yogurt market is expected to reach a value of about USD 9.6 Billion in 2022, which is approximately 24% of the global drinkable yogurt drinks market.

Why Asia Pacific is considered a Promising Market for Drinkable Yogurt Market?

With a revenue share of 41.8 percent in 2021, Asia Pacific contributed the most to the worldwide drinkable yogurt market. This increase was attributed to increased product demand as a result of increased consumer knowledge of the need to eat a healthy diet.

Consumers' willingness to spend money on healthy snacks and beverages has aided producers in developing and producing a variety of beverages in the region. The growth in sales of drinkable yogurt will be fueled by key manufacturers' innovations. IFF, for example, developed YO-MIX ViV, a solution for ambient yogurt and other fermented drinks, with an emphasis on China, in June 2021.

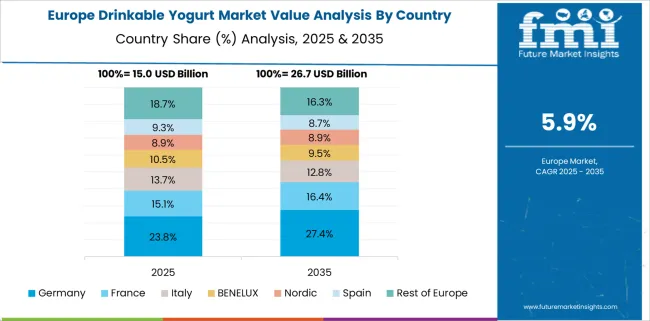
How is the European Drinkable Yogurt Market Shaping?

Consumers in European countries are well aware of the advantages of good health. They are willing to spend money on products that increase their body's resistance to viruses.

Drinkable yogurts are available in bottles and pouches of various sizes that are convenient to carry to work, which is projected to drive demand for drinkable yogurts among working people who prefer energy drinks to refill their energy after a long day at work.

Get the data you need at a Fraction of the cost

Personalize your report by choosing insights you need
and save 40%!

Category-wise Insights

Which Ingredient of Drinkable Yogurt Generates more revenue Market?

Non-dairy yogurt accounted for the maximum share of the drinkable yogurt market. Plant-based drinks and desserts are a flourishing sector. It fits consumers’ desire to relish foods that are delicious, as well as good for their health.

Consumers are also preferring organic products that do not contain any chemical products and prefer brands that follow sustainable business practices. Like recyclable plastic packaging and low carbon footprint across different processes. Brands that offer vegan drinkable yogurt are expected to generate more revenue in long run.

Which Sales Channel is Gaining Eminence in Drinkable Yogurt Market?

Consumers have grown label cautious; they scrutinize all of the ingredients used to create healthy drinks. While standing in the aisles of the store, customers read the contents and choose drinks that contain elements that are good for them. And so considerable revenue generation comes through the sale of goods from fully stocked shelves in supermarkets. These shops have a large selection of drinkable yogurt in various flavors and pack sizes.

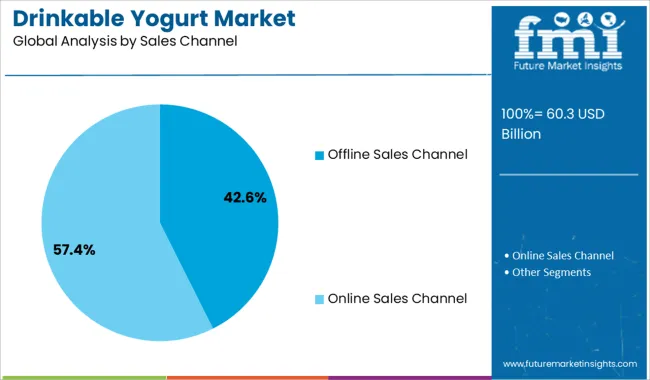
Customers can order drinks with only one click, which in itself is driving online sales. The online distribution channel in the drinkable yogurt market is expected to grow at a rate of 5.2 percent per year from 2022 to 2023. And they account for 60% of all sales.

To provide clients with doorstep delivery, key players partnered with several online marketplaces such as Amazon and Flipkart. Consumers are tempted to buy from online channels through various schemes and discounts offered by e-commerce sites. Many organizations are incorporating artificial intelligence and machine learning skills to improve the purchase experience on their platforms.
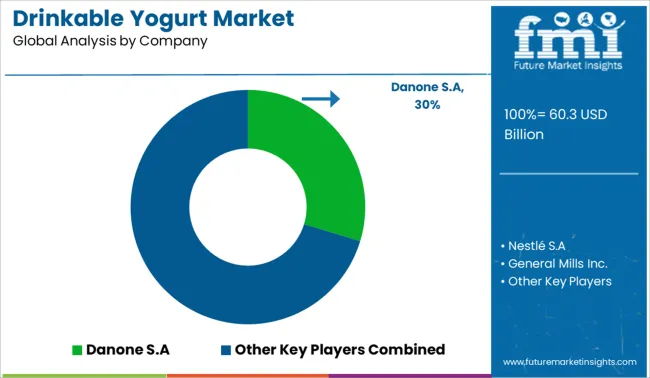
Competitive Landscape

Key companies are investing in launching new products in the drinkable yogurts market to fulfill the consumer demand for healthy products. They are investing in developing technology and product packaging to enhance its shelf life.

  • Horizon Organic® has added low-fat yogurt sachets, drinkable yogurt, low-cholesterol milk half gallons, and single-serve whole milk boxes to its Growing Years collection, which is now available at grocery stores nationwide.

Scope of the Report

Attribute Details
Forecast Period 2022 to 2032
Historical Data Available for 2017 to 2021
Market Analysis USD Million for Value and lots for Volume
Key Regions Covered North America; Latin America; Europe; East Asia; South Asia; and the Middle East & Africa
Key Countries Covered USA, Brazil, Mexico, Germany, United Kingdom, China, India, Japan, Australia, and GCC Countries
Key Segments Covered Category, Type, Sales Channel, and Region
Key Companies Profiled Danone S.A; Nestlé S.A; General Mills Inc.; Chobani LLC; Royal FrieslandCampina N.V.; Groupe Lactalis; Pillars Yogurt; Morinaga Nutritional Foods, Inc
Report Coverage Market Forecast, Company Share Analysis, Competition Intelligence, Drivers, Restraints, Opportunities and Threats Analysis, Market Dynamics and Challenges, and Strategic Growth Initiatives
Customization & Pricing Available upon Request

Drinkable Yogurt Market by Category

By Category:

  • Dairy-based yogurt
  • Non-dairy based yogurt

By Type:

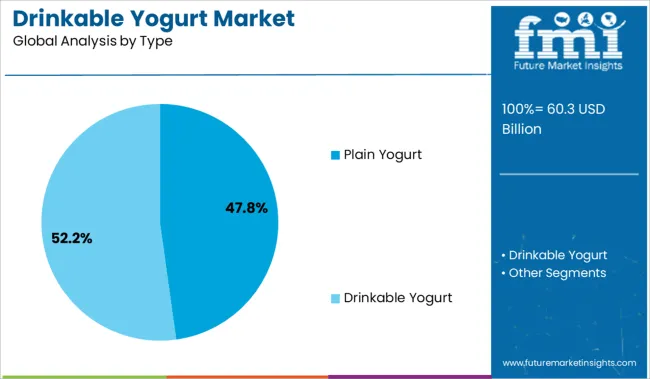
  • Plain Yogurt
  • Drinkable Yogurt

By Sales Channel:

  • Offline Sales Channel
    • Supermarkets/Hypermarkets
    • Departmental Stores
    • Convenience Store
    • Other Sales Channel
  • Online Sales Channel
    • Company Website
    • E-commerce Platform

By Region:

  • North America
  • Latin America
  • Europe
  • East Asia
  • South Asia
  • Oceania
  • Middle East and Africa

Frequently Asked Questions

How much is the Global Market worth?

The Global drinkable yogurt market is estimated to be worth over USD 50 Billion by 2022.

What is the Demand Outlook Forecast for the Market Globally?

The drinkable yogurt market is forecasted to surpass USD 94 Billion by the end of 2032.

What was the last 5-year CAGR for the demand in the Market?

Between 2017 and 2021, the drinkable yogurt market grew at a 5.5% CAGR.

At What Rate will Drinkable Yogurt Demand Grow in Europe?

The demand for drinkable yogurt is expected to grow at a 6.5% CAGR between 2022 and 2032.

What are the Key Trends Shaping the Drinkable Yogurt Demand Market?

Change in consumer lifestyle and increase in consumer spending capacity is expected to drive the drinkable yogurt market globally.

At What Rate Will Drinkable Yogurt Market Demand Grow in North America?

The North American drinkable yogurt market will grow at 6.1% CAGR between 2022 and 2032.

Table of Content
1. Executive Summary | Drinkable Yogurt Market

    1.1. Global Market Outlook

    1.2. Demand-side Trends

    1.3. Supply-side Trends

    1.4. Technology Roadmap Analysis

    1.5. Analysis and Recommendations

2. Market Overview

    2.1. Market Coverage / Taxonomy

    2.2. Market Definition / Scope / Limitations

3. Market Background

    3.1. Market Dynamics

        3.1.1. Drivers

        3.1.2. Restraints

        3.1.3. Opportunity

        3.1.4. Trends

    3.2. Scenario Forecast

        3.2.1. Demand in Optimistic Scenario

        3.2.2. Demand in Likely Scenario

        3.2.3. Demand in Conservative Scenario

    3.3. Product Launches & Recent Developments

    3.4. Product Life Cycle Analysis

    3.5. Value Chain Analysis

        3.5.1. Supply Side Participants and Their Roles

            3.5.1.1. Producers

            3.5.1.2. Mid-Level Participants (Traders/ Agents/ Brokers)

            3.5.1.3. Wholesalers and Distributors

        3.5.2. % of Operating Margin Analysis

        3.5.3. List of Raw Material Suppliers

        3.5.4. List of Existing and Potential Buyers

    3.6. Global Market - Pricing Analysis

        3.6.1. Price Point Assessment by Region

        3.6.2. Price Point Assessment by Type

        3.6.3. Price Forecast till 2032

        3.6.4. Factors Affecting Pricing

    3.7. Forecast Factors - Relevance & Impact

    3.8. Regulatory Landscape

        3.8.1. Packaging & Labelling Regulations

        3.8.2. Certifications and Certifying Agency Overview

        3.8.3. Import/Export Policies

    3.9. Regional Parent Market Outlook

    3.10. Consumers Survey Analysis

    3.11. Macro-Economic Factors

    3.12. Product Claims & Nutritional Information scanned by Buyers

4. Global Market Analysis 2017 to 2021 and Forecast, 2022 to 2032

    4.1. Historical Market Size Value (US$ Million) & Volume (MT) Analysis, 2017 to 2021

    4.2. Current and Future Market Size Value (US$ Million) & Volume (MT) Projections, 2022 to 2032

        4.2.1. Y-o-Y Growth Trend Analysis

        4.2.2. Absolute $ Opportunity Analysis

5. Global Market Analysis 2017 to 2021 and Forecast 2022 to 2032, By Category

    5.1. Introduction / Key Findings

    5.2. Historical Market Size Value (US$ Million) & Volume (MT) Analysis By Category, 2017 to 2021

    5.3. Current and Future Market Size Value (US$ Million) & Volume (MT) Analysis and Forecast By Category, 2022 to 2032

        5.3.1. Dairy-based yogurt

        5.3.2. Non-dairy-based yogurt

    5.4. Y-o-Y Growth Trend Analysis By Category, 2017 to 2021

    5.5. Absolute $ Opportunity Analysis By Category, 2022 to 2032

6. Global Market Analysis 2017 to 2021 and Forecast 2022 to 2032, By Type

    6.1. Introduction / Key Findings

    6.2. Historical Market Size Value (US$ Million) & Volume (MT) Analysis By Type, 2017 to 2021

    6.3. Current and Future Market Size Value (US$ Million) & Volume (MT) Analysis and Forecast By Type, 2022 to 2032

        6.3.1. Plain Yogurt

        6.3.2. Drinkable Yogurt

        6.3.3. Chunk

        6.3.4. Grated

        6.3.5. Others

    6.4. Y-o-Y Growth Trend Analysis By Type, 2017 to 2021

    6.5. Absolute $ Opportunity Analysis By Type, 2022 to 2032

7. Global Market Analysis 2017 to 2021 and Forecast 2022 to 2032, By Sales Channel

    7.1. Introduction / Key Findings

    7.2. Historical Market Size Value (US$ Million) & Volume (MT) Analysis By Sales Channel, 2017 to 2021

    7.3. Current and Future Market Size Value (US$ Million) & Volume (MT) Analysis and Forecast By Sales Channel, 2022 to 2032

        7.3.1. Offline Sales Channel

            7.3.1.1. Supermarkets/Hypermarkets

            7.3.1.2. Departmental Stores

            7.3.1.3. Convenience Store

            7.3.1.4. Other Sales Channel

        7.3.2. Online Sales Channel

            7.3.2.1. Company Website

            7.3.2.2. E-commerce Platform

        7.3.3. Retail Buyers

        7.3.4. Food Service Providers

    7.4. Y-o-Y Growth Trend Analysis By Sales Channel, 2017 to 2021

    7.5. Absolute $ Opportunity Analysis By Sales Channel, 2022 to 2032

8. Global Market Analysis 2017 to 2021 and Forecast 2022 to 2032, By Region

    8.1. Introduction

    8.2. Historical Market Size Value (US$ Million) & Volume (MT) Analysis By Region, 2017 to 2021

    8.3. Current Market Size Value (US$ Million) & Volume (MT) Analysis and Forecast By Region, 2022 to 2032

        8.3.1. North America

        8.3.2. Latin America

        8.3.3. Europe

        8.3.4. East Asia

        8.3.5. South Asia

        8.3.6. Oceania

        8.3.7. Middle East and Africa

    8.4. Market Attractiveness Analysis By Region

9. North America Market Analysis 2017 to 2021 and Forecast 2022 to 2032, By Country

    9.1. Historical Market Size Value (US$ Million) & Volume (MT) Trend Analysis By Market Taxonomy, 2017 to 2021

    9.2. Market Size Value (US$ Million) & Volume (MT) Forecast By Market Taxonomy, 2022 to 2032

        9.2.1. By Country

            9.2.1.1. USA

            9.2.1.2. Canada

        9.2.2. By Category

        9.2.3. By Type

        9.2.4. By Sales Channel

    9.3. Market Attractiveness Analysis

        9.3.1. By Country

        9.3.2. By Category

        9.3.3. By Type

        9.3.4. By Sales Channel

    9.4. Key Takeaways

10. Latin America Market Analysis 2017 to 2021 and Forecast 2022 to 2032, By Country

    10.1. Historical Market Size Value (US$ Million) & Volume (MT) Trend Analysis By Market Taxonomy, 2017 to 2021

    10.2. Market Size Value (US$ Million) & Volume (MT) Forecast By Market Taxonomy, 2022 to 2032

        10.2.1. By Country

            10.2.1.1. Brazil

            10.2.1.2. Mexico

            10.2.1.3. Argentina

            10.2.1.4. Chile

            10.2.1.5. Peru

            10.2.1.6. Rest of Latin America

        10.2.2. By Category

        10.2.3. By Type

        10.2.4. By Sales Channel

    10.3. Market Attractiveness Analysis

        10.3.1. By Country

        10.3.2. By Category

        10.3.3. By Type

        10.3.4. By Sales Channel

    10.4. Key Takeaways

11. Europe Market Analysis 2017 to 2021 and Forecast 2022 to 2032, By Country

    11.1. Historical Market Size Value (US$ Million) & Volume (MT) Trend Analysis By Market Taxonomy, 2017 to 2021

    11.2. Market Size Value (US$ Million) & Volume (MT) Forecast By Market Taxonomy, 2022 to 2032

        11.2.1. By Country

            11.2.1.1. Germany

            11.2.1.2. Italy

            11.2.1.3. France

            11.2.1.4. United Kingdom

            11.2.1.5. Spain

            11.2.1.6. Russia

            11.2.1.7. BENELUX

            11.2.1.8. Poland

            11.2.1.9. Nordic Countries

            11.2.1.10. Rest of Europe

        11.2.2. By Category

        11.2.3. By Type

        11.2.4. By Sales Channel

    11.3. Market Attractiveness Analysis

        11.3.1. By Country

        11.3.2. By Category

        11.3.3. By Type

        11.3.4. By Sales Channel

    11.4. Key Takeaways

12. East Asia Market Analysis 2017 to 2021 and Forecast 2022 to 2032, By Country

    12.1. Historical Market Size Value (US$ Million) & Volume (MT) Trend Analysis By Market Taxonomy, 2017 to 2021

    12.2. Market Size Value (US$ Million) & Volume (MT) Forecast By Market Taxonomy, 2022 to 2032

        12.2.1. By Country

            12.2.1.1. China

            12.2.1.2. Japan

            12.2.1.3. South Korea

        12.2.2. By Category

        12.2.3. By Type

        12.2.4. By Sales Channel

    12.3. Market Attractiveness Analysis

        12.3.1. By Country

        12.3.2. By Category

        12.3.3. By Type

        12.3.4. By Sales Channel

    12.4. Key Takeaways

13. South Asia Market Analysis 2017 to 2021 and Forecast 2022 to 2032, By Country

    13.1. Historical Market Size Value (US$ Million) & Volume (MT) Trend Analysis By Market Taxonomy, 2017 to 2021

    13.2. Market Size Value (US$ Million) & Volume (MT) Forecast By Market Taxonomy, 2022 to 2032

        13.2.1. By Country

            13.2.1.1. India

            13.2.1.2. Thailand

            13.2.1.3. Malaysia

            13.2.1.4. Indonesia

            13.2.1.5. Rest of South Asia

        13.2.2. By Category

        13.2.3. By Type

        13.2.4. By Sales Channel

    13.3. Market Attractiveness Analysis

        13.3.1. By Country

        13.3.2. By Category

        13.3.3. By Type

        13.3.4. By Sales Channel

    13.4. Key Takeaways

14. Oceania Market Analysis 2017 to 2021 and Forecast 2022 to 2032, By Country

    14.1. Historical Market Size Value (US$ Million) & Volume (MT) Trend Analysis By Market Taxonomy, 2017 to 2021

    14.2. Market Size Value (US$ Million) & Volume (MT) Forecast By Market Taxonomy, 2022 to 2032

        14.2.1. By Country

            14.2.1.1. Australia

            14.2.1.2. New Zealand

        14.2.2. By Category

        14.2.3. By Type

        14.2.4. By Sales Channel

    14.3. Market Attractiveness Analysis

        14.3.1. By Country

        14.3.2. By Category

        14.3.3. By Type

        14.3.4. By Sales Channel

    14.4. Key Takeaways

15. Middle East and Africa Market Analysis 2017 to 2021 and Forecast 2022 to 2032, By Country

    15.1. Historical Market Size Value (US$ Million) & Volume (MT) Trend Analysis By Market Taxonomy, 2017 to 2021

    15.2. Market Size Value (US$ Million) & Volume (MT) Forecast By Market Taxonomy, 2022 to 2032

        15.2.1. By Country

            15.2.1.1. GCC Countries

            15.2.1.2. South Africa

            15.2.1.3. Central Africa

            15.2.1.4. North Africa

        15.2.2. By Category

        15.2.3. By Type

        15.2.4. By Sales Channel

    15.3. Market Attractiveness Analysis

        15.3.1. By Country

        15.3.2. By Category

        15.3.3. By Type

        15.3.4. By Sales Channel

    15.4. Key Takeaways

16. Key Countries Market Analysis

    16.1. USA

        16.1.1. Pricing Analysis

        16.1.2. Market Share Analysis, 2021

            16.1.2.1. By Category

            16.1.2.2. By Type

            16.1.2.3. By Sales Channel

    16.2. Canada

        16.2.1. Pricing Analysis

        16.2.2. Market Share Analysis, 2021

            16.2.2.1. By Category

            16.2.2.2. By Type

            16.2.2.3. By Sales Channel

    16.3. Brazil

        16.3.1. Pricing Analysis

        16.3.2. Market Share Analysis, 2021

            16.3.2.1. By Category

            16.3.2.2. By Type

            16.3.2.3. By Sales Channel

    16.4. Mexico

        16.4.1. Pricing Analysis

        16.4.2. Market Share Analysis, 2021

            16.4.2.1. By Category

            16.4.2.2. By Type

            16.4.2.3. By Sales Channel

    16.5. Argentina

        16.5.1. Pricing Analysis

        16.5.2. Market Share Analysis, 2021

            16.5.2.1. By Category

            16.5.2.2. By Type

            16.5.2.3. By Sales Channel

    16.6. Chile

        16.6.1. Pricing Analysis

        16.6.2. Market Share Analysis, 2021

            16.6.2.1. By Category

            16.6.2.2. By Type

            16.6.2.3. By Sales Channel

    16.7. Peru

        16.7.1. Pricing Analysis

        16.7.2. Market Share Analysis, 2021

            16.7.2.1. By Category

            16.7.2.2. By Type

            16.7.2.3. By Sales Channel

    16.8. Germany

        16.8.1. Pricing Analysis

        16.8.2. Market Share Analysis, 2021

            16.8.2.1. By Category

            16.8.2.2. By Type

            16.8.2.3. By Sales Channel

    16.9. Italy

        16.9.1. Pricing Analysis

        16.9.2. Market Share Analysis, 2021

            16.9.2.1. By Category

            16.9.2.2. By Type

            16.9.2.3. By Sales Channel

    16.10. France

        16.10.1. Pricing Analysis

        16.10.2. Market Share Analysis, 2021

            16.10.2.1. By Category

            16.10.2.2. By Type

            16.10.2.3. By Sales Channel

    16.11. Spain

        16.11.1. Pricing Analysis

        16.11.2. Market Share Analysis, 2021

            16.11.2.1. By Category

            16.11.2.2. By Type

            16.11.2.3. By Sales Channel

    16.12. United Kingdom

        16.12.1. Pricing Analysis

        16.12.2. Market Share Analysis, 2021

            16.12.2.1. By Category

            16.12.2.2. By Type

            16.12.2.3. By Sales Channel

    16.13. Russia

        16.13.1. Pricing Analysis

        16.13.2. Market Share Analysis, 2021

            16.13.2.1. By Category

            16.13.2.2. By Type

            16.13.2.3. By Sales Channel

    16.14. Poland

        16.14.1. Pricing Analysis

        16.14.2. Market Share Analysis, 2021

            16.14.2.1. By Category

            16.14.2.2. By Type

            16.14.2.3. By Sales Channel

    16.15. BENELUX

        16.15.1. Pricing Analysis

        16.15.2. Market Share Analysis, 2021

            16.15.2.1. By Category

            16.15.2.2. By Type

            16.15.2.3. By Sales Channel

    16.16. Nordic Countries

        16.16.1. Pricing Analysis

        16.16.2. Market Share Analysis, 2021

            16.16.2.1. By Category

            16.16.2.2. By Type

            16.16.2.3. By Sales Channel

    16.17. China

        16.17.1. Pricing Analysis

        16.17.2. Market Share Analysis, 2021

            16.17.2.1. By Category

            16.17.2.2. By Type

            16.17.2.3. By Sales Channel

    16.18. Japan

        16.18.1. Pricing Analysis

        16.18.2. Market Share Analysis, 2021

            16.18.2.1. By Category

            16.18.2.2. By Type

            16.18.2.3. By Sales Channel

    16.19. South Korea

        16.19.1. Pricing Analysis

        16.19.2. Market Share Analysis, 2021

            16.19.2.1. By Category

            16.19.2.2. By Type

            16.19.2.3. By Sales Channel

    16.20. India

        16.20.1. Pricing Analysis

        16.20.2. Market Share Analysis, 2021

            16.20.2.1. By Category

            16.20.2.2. By Type

            16.20.2.3. By Sales Channel

    16.21. Thailand

        16.21.1. Pricing Analysis

        16.21.2. Market Share Analysis, 2021

            16.21.2.1. By Category

            16.21.2.2. By Type

            16.21.2.3. By Sales Channel

    16.22. Indonesia

        16.22.1. Pricing Analysis

        16.22.2. Market Share Analysis, 2021

            16.22.2.1. By Category

            16.22.2.2. By Type

            16.22.2.3. By Sales Channel

    16.23. Malaysia

        16.23.1. Pricing Analysis

        16.23.2. Market Share Analysis, 2021

            16.23.2.1. By Category

            16.23.2.2. By Type

            16.23.2.3. By Sales Channel

    16.24. Singapore

        16.24.1. Pricing Analysis

        16.24.2. Market Share Analysis, 2021

            16.24.2.1. By Category

            16.24.2.2. By Type

            16.24.2.3. By Sales Channel

    16.25. GCC Countries

        16.25.1. Pricing Analysis

        16.25.2. Market Share Analysis, 2021

            16.25.2.1. By Category

            16.25.2.2. By Type

            16.25.2.3. By Sales Channel

    16.26. South Africa

        16.26.1. Pricing Analysis

        16.26.2. Market Share Analysis, 2021

            16.26.2.1. By Category

            16.26.2.2. By Type

            16.26.2.3. By Sales Channel

    16.27. Central Africa

        16.27.1. Pricing Analysis

        16.27.2. Market Share Analysis, 2021

            16.27.2.1. By Category

            16.27.2.2. By Type

            16.27.2.3. By Sales Channel

    16.28. North Africa

        16.28.1. Pricing Analysis

        16.28.2. Market Share Analysis, 2021

            16.28.2.1. By Category

            16.28.2.2. By Type

            16.28.2.3. By Sales Channel

17. Market Structure Analysis

    17.1. Competition Dashboard

    17.2. Competition Benchmarking

    17.3. Market Share Analysis of Top Players

        17.3.1. By Regional

        17.3.2. By Category

        17.3.3. By Type

        17.3.4. By Sales Channel

18. Competition Analysis

    18.1. Competition Deep Dive

        18.1.1. Danone S.A

            18.1.1.1. Overview

            18.1.1.2. Product Portfolio

            18.1.1.3. Profitability by Market Segments

            18.1.1.4. Sales Footprint

            18.1.1.5. Strategy Overview

                18.1.1.5.1. Marketing Strategy

                18.1.1.5.2. Product Strategy

                18.1.1.5.3. Channel Strategy

        18.1.2. Nestlé S.A

            18.1.2.1. Overview

            18.1.2.2. Product Portfolio

            18.1.2.3. Profitability by Market Segments

            18.1.2.4. Sales Footprint

            18.1.2.5. Strategy Overview

                18.1.2.5.1. Marketing Strategy

                18.1.2.5.2. Product Strategy

                18.1.2.5.3. Channel Strategy

        18.1.3. General Mills Inc.

            18.1.3.1. Overview

            18.1.3.2. Product Portfolio

            18.1.3.3. Profitability by Market Segments

            18.1.3.4. Sales Footprint

            18.1.3.5. Strategy Overview

                18.1.3.5.1. Marketing Strategy

                18.1.3.5.2. Product Strategy

                18.1.3.5.3. Channel Strategy

        18.1.4. Chobani LLC

            18.1.4.1. Overview

            18.1.4.2. Product Portfolio

            18.1.4.3. Profitability by Market Segments

            18.1.4.4. Sales Footprint

            18.1.4.5. Strategy Overview

                18.1.4.5.1. Marketing Strategy

                18.1.4.5.2. Product Strategy

                18.1.4.5.3. Channel Strategy

        18.1.5. Royal FrieslandCampina N.V.

            18.1.5.1. Overview

            18.1.5.2. Product Portfolio

            18.1.5.3. Profitability by Market Segments

            18.1.5.4. Sales Footprint

            18.1.5.5. Strategy Overview

                18.1.5.5.1. Marketing Strategy

                18.1.5.5.2. Product Strategy

                18.1.5.5.3. Channel Strategy

        18.1.6. Groupe Lactalis

            18.1.6.1. Overview

            18.1.6.2. Product Portfolio

            18.1.6.3. Profitability by Market Segments

            18.1.6.4. Sales Footprint

            18.1.6.5. Strategy Overview

                18.1.6.5.1. Marketing Strategy

                18.1.6.5.2. Product Strategy

                18.1.6.5.3. Channel Strategy

        18.1.7. Pillars Yogurt

            18.1.7.1. Overview

            18.1.7.2. Product Portfolio

            18.1.7.3. Profitability by Market Segments

            18.1.7.4. Sales Footprint

            18.1.7.5. Strategy Overview

                18.1.7.5.1. Marketing Strategy

                18.1.7.5.2. Product Strategy

                18.1.7.5.3. Channel Strategy

        18.1.8. Morinaga Nutritional Foods, Inc

            18.1.8.1. Overview

            18.1.8.2. Product Portfolio

            18.1.8.3. Profitability by Market Segments

            18.1.8.4. Sales Footprint

            18.1.8.5. Strategy Overview

                18.1.8.5.1. Marketing Strategy

                18.1.8.5.2. Product Strategy

                18.1.8.5.3. Channel Strategy

        18.1.9. Maple Hill Creamery

            18.1.9.1. Overview

            18.1.9.2. Product Portfolio

            18.1.9.3. Profitability by Market Segments

            18.1.9.4. Sales Footprint

            18.1.9.5. Strategy Overview

                18.1.9.5.1. Marketing Strategy

                18.1.9.5.2. Product Strategy

                18.1.9.5.3. Channel Strategy

        18.1.10. Stonyfield farm

            18.1.10.1. Overview

            18.1.10.2. Product Portfolio

            18.1.10.3. Profitability by Market Segments

            18.1.10.4. Sales Footprint

            18.1.10.5. Strategy Overview

                18.1.10.5.1. Marketing Strategy

                18.1.10.5.2. Product Strategy

                18.1.10.5.3. Channel Strategy

        18.1.11. Others (On Additional Request)

19. Assumptions & Acronyms Used

20. Research Methodology
Recommendations

Food and Beverage

Yogurt Powder Market

February 2021

REP-GB-7871

May 2024

250 pages

Food and Beverage

Frozen Yogurt Market

July 2017

REP-GB-4344

March 2024

324 pages

Food and Beverage

Yogurt Dips Market

September 2024

REP-GB-6230

Upcoming

Food and Beverage

Dry Yogurt Market

September 2024

REP-GB-9988

Upcoming

Explore Food and Beverage Insights

View Reports