Yogurt Powder Market Size, Share Forecast and Outlook 2025 to 2035

The global yogurt powder market is forecast to grow from USD 356.0 million in 2025 to USD 687.3 million by 2035, registering an absolute gain of USD 331.3 million and a CAGR of about 6.8%. This translates into a total growth of 93.1%, with the market forecast to expand at a compound annual growth rate (CAGR) of 6.8% between 2025 and 2035. The overall market size is expected to grow by nearly 1.93X during the same period, supported by the rising demand for convenient dairy products and increasing application across diverse food processing industries.
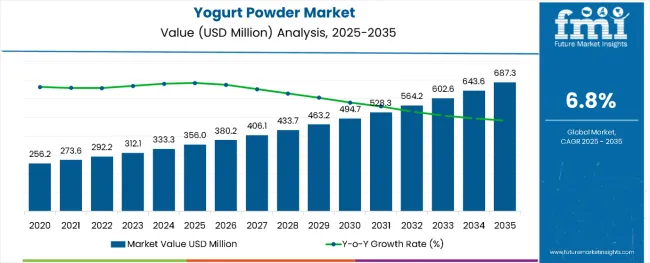
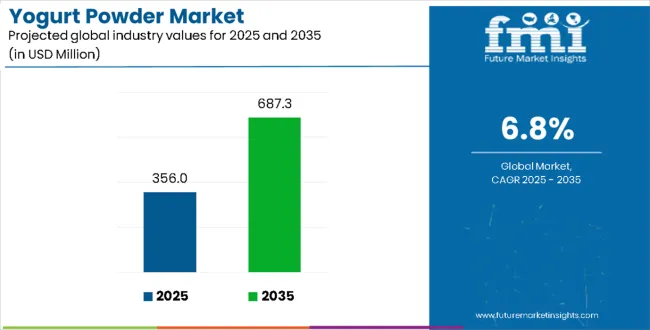
Yogurt Powder Market Value Analysis

Quick Stats for Yogurt Powder Market

  • Yogurt Powder Market Value (2025): USD 356.0 million
  • Yogurt Powder Market Forecast Value (2035): USD 687.3 million
  • Yogurt Powder Market Forecast CAGR: 6.8%
  • Leading Type in Yogurt Powder Market: Regular (44.0%)
  • Key Growth Regions in Yogurt Powder Market: North America, Asia Pacific, and Europe
  • Top Players in Yogurt Powder Market: Nestlé S.A., Danone S.A., General Mills Inc., Kerry Group plc, Glanbia plc

Yogurt Powder Market

Yogurt Powder Market Key Takeaways

Metric Value (USD Million)
Yogurt Powder Market (2025) USD 356.0 Million
Yogurt Powder Market (2035) USD 687.3 Million
Yogurt Powder Market CAGR (2025 to 2035) 6.8%

Between 2020 and 2025, the Yogurt Powder market experienced steady expansion, driven by increasing health awareness and growing applications in food manufacturing. The market developed as food processors recognized the value of yogurt powder in extending shelf life while maintaining nutritional benefits. Consumer preference for convenient, shelf-stable dairy products and the rise of functional food trends contributed significantly to market development during this period.

Between 2025 and 2030, the yogurt powder market is projected to expand from USD 356.0 million to USD 511.2 million, resulting in a value increase of USD 155.2 million, which represents 46.8% of the total forecast growth for the decade. This phase of growth will be shaped by rising health consciousness among consumers, increasing demand for protein-rich functional foods, and expanding applications in the food processing industry. Manufacturers are enhancing production capabilities to meet growing demand for diverse yogurt powder formulations across multiple end-use sectors.

From 2030 to 2035, the market is forecast to grow from USD 511.2 million to USD 687.3 million, adding another USD 176.1 million, which constitutes 53.2% of the overall ten-year expansion. This period is expected to be characterized by technological advancements in spray-drying and freeze-drying processes, development of specialized yogurt powder variants, and increasing penetration in emerging markets. The growing adoption of clean-label products and organic yogurt powders will drive demand for premium formulations and specialized manufacturing expertise.

Why is the Yogurt Powder Market Growing?

Market expansion is being supported by the increasing consumer preference for convenient and shelf-stable dairy products that retain nutritional benefits of fresh yogurt. Yogurt powder offers extended storage capabilities, reduced transportation costs, and versatility in food processing applications, making it an attractive ingredient for manufacturers across various industries. The growing awareness of probiotics and their health benefits is driving demand for yogurt powder in functional food formulations and dietary supplement applications.

The expanding food processing industry and rising demand for natural flavor enhancers are creating opportunities for yogurt powder manufacturers to develop specialized products for different applications. Food service establishments and commercial bakeries are increasingly adopting yogurt powder to improve texture, taste, and nutritional content of their products while maintaining cost effectiveness and operational efficiency.

Segmental Analysis

The market segments include type, flavor, packaging type, application, distribution channel, and region. The type segment covers regular, low fat, and non fat. The flavor segment includes plain and flavored. The packaging type segment comprises sachets/pouches, cans/jars, and bulk packaging. The application segment covers food and beverage industry, nutraceuticals and dietary supplements, and cosmetics and personal care products. The distribution channel segment includes supermarkets and hypermarkets, convenience stores, online retailing, specialty stores, and others such as independent grocery stores, foodservice outlets, institutional buyers, and specialty & ethnic stores. The regional segment includes North America, Latin America, Western Europe, Eastern Europe, Balkans & Baltic, Russia & Belarus, Central Asia, East Asia, South Asia & Pacific, and Middle East & Africa.
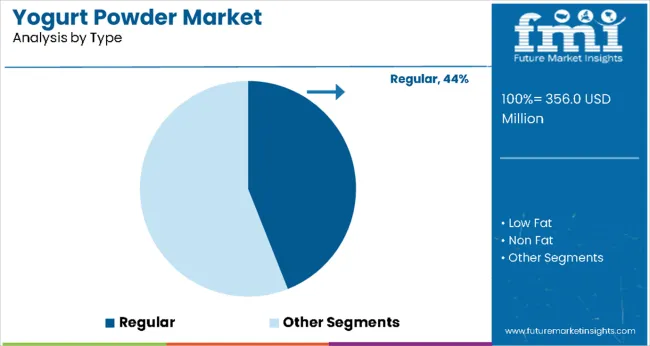
By Type, Regular Segment Accounts for 44% Market Share

Yogurt Powder Market By Type

Regular yogurt powder is projected to account for 44% of the yogurt powder market in 2025. This leading share is supported by the widespread preference for traditional yogurt taste and texture in various food applications. Regular yogurt powder maintains the authentic flavor profile and creamy characteristics that consumers associate with conventional yogurt products. The segment benefits from established manufacturing processes and broad application scope across bakery, confectionery, and beverage industries.

Regular yogurt powder provides optimal functionality in food formulations, offering balanced fat content that enhances texture and mouthfeel in finished products. Food manufacturers prefer regular variants for applications requiring rich taste and smooth consistency, particularly in premium product segments where authentic yogurt characteristics are essential for consumer acceptance and market positioning.
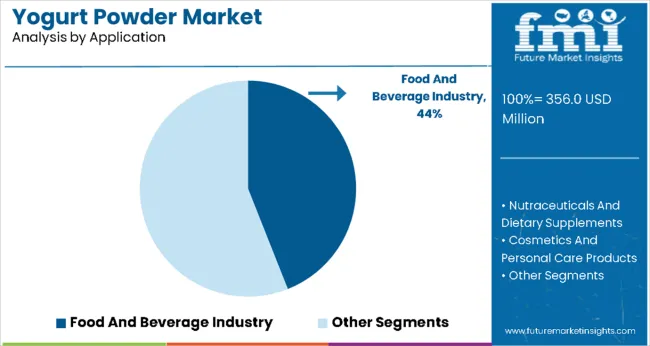
By Application, Food and Beverage Industry Segment Accounts for 44% Market Share

Yogurt Powder Market By Application

The food and beverage industry is expected to represent 44% of yogurt powder demand in 2025. This dominant share reflects the extensive use of yogurt powder as a functional ingredient across diverse food processing applications. Food manufacturers utilize yogurt powder to enhance nutritional profiles, improve texture, and add tangy flavor to various products including baked goods, snacks, beverages, and frozen desserts.

The segment benefits from growing consumer demand for protein-enriched foods and natural ingredients that provide health benefits while maintaining taste and quality. Food processors are increasingly incorporating yogurt powder into formulations to meet clean label requirements and deliver products that align with health-conscious consumer preferences without compromising on taste or functionality.

What are the Drivers, Restraints, and Key Trends of the Yogurt Powder Market?

The yogurt powder market is advancing steadily due to increasing health consciousness and growing demand for convenient nutritional ingredients. However, the market faces challenges including fluctuating raw material prices, need for specialized storage conditions, and competition from fresh dairy alternatives. Quality standardization and supply chain optimization continue to influence market development and competitive positioning.

Expansion of Functional Food Applications

The growing integration of yogurt powder into functional food formulations is enabling manufacturers to develop products that combine taste, nutrition, and health benefits. Food processors are incorporating yogurt powder into protein bars, meal replacement shakes, and fortified snacks to meet consumer demand for convenient nutrition solutions. These applications provide opportunities for premium pricing and market differentiation.

Development of Specialized Production Technologies

Modern yogurt powder manufacturers are implementing advanced spray-drying and freeze-drying technologies that preserve nutritional content and improve product stability. Enhanced processing methods enable production of yogurt powder with superior solubility, flavor retention, and extended shelf life. These technological improvements support expansion into new applications and geographic markets while maintaining product quality standards.
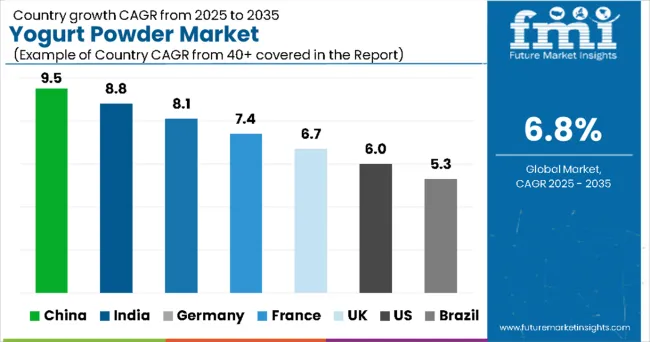
Analysis of Yogurt Powder Market by Key Country

Yogurt Powder Market By Country

Country CAGR
China 9.5%
India 8.8%
Germany 8.1%
France 7.4%
United Kingdom 6.7%
United States 6.0%
Brazil 5.3%

The yogurt powder market demonstrates varied growth dynamics across key countries from 2025 to 2035. China leads with the highest market share of 9.5%, driven by rapid industrial expansion, modernization of food processing facilities, and increasing consumer demand for convenient dairy-based ingredients. India follows closely at 8.8%, supported by a strong dairy industry, growing middle class, and expanding food processing and bakery sectors. Germany holds an 8.1% share, emphasizing premium quality, technological innovation, and organic/natural product offerings. France records a 7.4% share, focusing on culinary applications, product innovation, and gourmet food segments. The United Kingdom maintains 6.7%, propelled by health-conscious consumers and functional food demand. The United States shows 6.0%, driven by diversified applications across food processing, nutraceuticals, and allergen-free or specialty variants. Brazil rounds out the top seven with 5.3%, supported by domestic consumption, food industry modernization, and export opportunities.

The report covers an in-depth analysis of 40+ countries; seven top-performing countries are highlighted below.

China Leads Global Market Growth with Industrial Expansion

Revenue from yogurt powder in China is projected to exhibit strong growth with a 9.5% market share, driven by rapid expansion of food processing industries and increasing consumer acceptance of dairy-based ingredients. The country's growing middle class and urbanization trends are creating demand for convenient food products that incorporate yogurt powder. Major food manufacturers are establishing production facilities to serve both domestic and export markets with cost-effective yogurt powder solutions.

Government initiatives supporting dairy industry development and food safety regulations are encouraging investment in modern yogurt powder production technologies. The expanding e-commerce sector and changing dietary preferences among urban consumers are creating new distribution channels and application opportunities for yogurt powder manufacturers throughout major metropolitan areas.

  • Food processing industry modernization programs are facilitating adoption of advanced drying technologies that enhance yogurt powder quality and production efficiency across manufacturing facilities.
  • Consumer lifestyle changes and increasing health awareness are driving demand for protein-rich ingredients in processed foods and nutritional supplements throughout urban markets.

India Demonstrates Strong Market Potential with Dairy Industry Growth

Revenue from yogurt powder in India is expanding with an 8.8% market share, supported by the country's established dairy industry and growing food processing sector. Traditional yogurt consumption patterns and increasing awareness of convenient dairy alternatives are creating opportunities for yogurt powder manufacturers. The expanding middle class and changing food habits are driving demand for processed foods that incorporate yogurt powder as a functional ingredient.

Dairy cooperatives and food processing companies are investing in yogurt powder production capabilities to serve domestic and international markets. The government's focus on value addition in agriculture and dairy sectors is supporting development of modern processing facilities that can produce high-quality yogurt powder meeting international standards.

  • Dairy industry development initiatives are promoting technology adoption and quality improvements that enhance yogurt powder production capabilities across processing facilities nationwide.
  • Growing food service sector and bakery industry expansion are creating increased demand for yogurt powder applications in commercial food preparation and manufacturing operations.

Germany Focuses on Premium Quality and Technical Innovation

Demand for yogurt powder in Germany is projected with an 8.1% market share, supported by the country's emphasis on food quality and technological innovation in dairy processing. German manufacturers are developing high-quality yogurt powder products that meet stringent European food safety standards and consumer expectations for premium ingredients. The market is characterized by focus on organic and natural variants that align with consumer preferences for clean label products.

Food technology research and development activities are advancing yogurt powder applications in specialized nutrition and functional food segments. German companies are investing in sustainable production methods and innovative packaging solutions that extend product shelf life while maintaining nutritional integrity and flavor characteristics.

  • Advanced food processing technologies are enabling production of specialized yogurt powder variants that meet specific application requirements across diverse industry segments.
  • Sustainability initiatives and environmental regulations are driving adoption of eco-friendly production methods and packaging solutions throughout the yogurt powder manufacturing sector.

France Emphasizes Culinary Applications and Product Innovation

Demand for yogurt powder in France is growing with a 7.4% market share, driven by the country's sophisticated food culture and emphasis on culinary innovation. French food manufacturers are incorporating yogurt powder into premium bakery products, gourmet snacks, and artisanal food preparations that cater to discerning consumer preferences. The market benefits from strong domestic dairy industry and established food processing expertise.

Culinary schools and professional kitchens are adopting yogurt powder for its convenience and consistent quality in food preparation applications. The expanding organic food segment and consumer preference for natural ingredients are creating opportunities for premium yogurt powder products that command higher market prices and margins.

  • Culinary innovation programs are promoting creative applications of yogurt powder in professional food service and gourmet food manufacturing across restaurant and hospitality sectors.
  • Organic farming initiatives and sustainable dairy practices are supporting development of premium yogurt powder variants that meet growing consumer demand for environmentally conscious products.

United Kingdom Focuses on Health and Wellness Applications

Demand for yogurt powder in the United Kingdom is expanding with a 6.7% market share, supported by increasing consumer interest in health and wellness products. British manufacturers are developing yogurt powder formulations for sports nutrition, dietary supplements, and functional foods that address specific health needs. The market is characterized by emphasis on protein content and probiotic benefits that appeal to health-conscious consumers.

Food retailers and supplement companies are expanding yogurt powder product offerings to meet growing demand for convenient nutrition solutions. The increasing prevalence of busy lifestyles and emphasis on portable nutrition are driving adoption of yogurt powder in meal replacement products and on-the-go snack applications.

  • Health and wellness trends are driving product development initiatives that focus on enhancing nutritional profiles and functional benefits of yogurt powder applications.
  • Retail sector expansion and e-commerce growth are creating new distribution opportunities for specialized yogurt powder products targeting health-conscious consumer segments.

United States Emphasizes Innovation and Market Diversification

Demand for yogurt powder in the United States is projected with a 6.0% market share, driven by diverse application opportunities across food processing, nutraceutical, and food service industries. American manufacturers are developing innovative yogurt powder products that cater to specific dietary requirements including organic, non-GMO, and allergen-free variants. The market benefits from advanced food processing technologies and extensive distribution networks.

Food service establishments and commercial bakeries are increasingly adopting yogurt powder to improve product nutritional profiles while maintaining operational efficiency. The growing popularity of high-protein foods and functional ingredients is creating opportunities for yogurt powder manufacturers to develop specialized products for different market segments.

  • Food technology innovation programs are advancing yogurt powder processing methods that improve product functionality and extend application possibilities across diverse industry sectors.
  • Market diversification strategies are enabling manufacturers to develop specialized yogurt powder variants that meet specific dietary requirements and consumer preferences nationwide.

Brazil Maintains Steady Growth with Food Industry Development

Revenue from yogurt powder in Brazil is growing with a 5.3% market share, supported by the country's expanding food processing industry and increasing consumer acceptance of dairy-based ingredients. Brazilian manufacturers are developing yogurt powder products that cater to local taste preferences while meeting international quality standards. The market benefits from abundant raw material availability and growing domestic consumption of processed foods.

Food processing companies are investing in modern production facilities that can produce high-quality yogurt powder for both domestic and export markets. The expanding middle class and urbanization trends are creating demand for convenient food products that incorporate yogurt powder as a nutritional and functional ingredient.
  • Food industry modernization programs are facilitating technology adoption and quality improvements that enhance yogurt powder production capabilities across manufacturing facilities.
  • Domestic market expansion and export opportunities are driving investment in yogurt powder production capacity and quality certification programs throughout the processing sector.

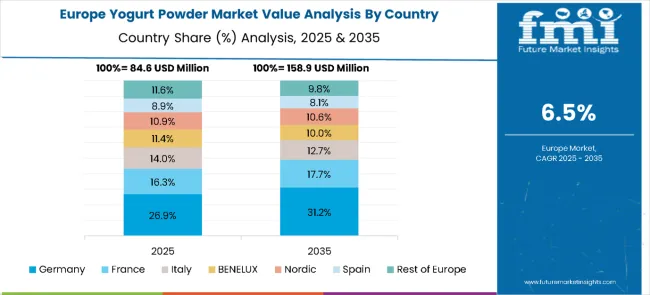
Europe Market Split by Country

Europe Yogurt Powder Market

The yogurt powder market in Europe is projected to grow from USD 84.6 million in 2025 to USD 158.9 million by 2035, registering a CAGR of 6.5% over the forecast period. Germany is expected to dominate with a 26.9% share in 2025, followed by France at 16.3%, reflecting strong applications in dairy-based food and beverage formulations. Italy accounts for 14.0% of the market, while BENELUX represents 11.4% and the Nordic countries hold 10.9%.

Spain contributes 8.9%, while the Rest of Europe collectively makes up 11.6%. By 2035, Germany will expand its lead to 31.2%, France will grow to 17.7%, and Italy will slightly reduce to 12.7%. BENELUX and the Nordic countries are projected at 10.0% and 10.6%, respectively, while Spain will reach 8.1%, and the Rest of Europe will ease to 9.8%, highlighting increasing concentration of demand in Europe’s top dairy innovation hubs.
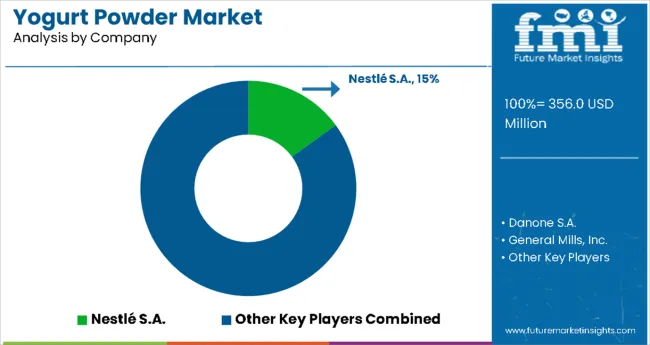
Competitive Landscape of Yogurt Powder Market

Yogurt Powder Market By Company

The yogurt powder market is characterized by competition among established dairy companies, food ingredient manufacturers, and specialized powder production facilities. Companies are investing in advanced processing technologies, product innovation, and quality assurance systems to deliver consistent, high-quality yogurt powder products that meet diverse application requirements.

Major players focus on developing specialized yogurt powder variants, expanding production capacity, and establishing strategic partnerships with food manufacturers to strengthen market presence. Technological innovation, supply chain optimization, and geographic expansion are central to competitive positioning and market growth strategies.

Global Yogurt Powder Market - Stakeholder Contribution Framework

Yogurt powder is a versatile ingredient bridging dairy nutrition and convenience - used in instant drinking yogurts, beverage mixes, baked goods, clinical nutrition, and shelf-stable food kits. Its growth is driven by demand for longer-shelf-life dairy proteins, probiotic-enabled products, easier cold-chain logistics, and new applications (snacking, on-the-go nutrition, military & disaster rations). Scaling the category requires attention to probiotic viability, sensory equivalence on reconstitution, energy-intensive drying processes, and dairy supply resilience - and that’s where coordinated stakeholder action matters.

How Governments Could Spur Local Production and Adoption?

  • Regulatory clarity for probiotics: Publish clear rules on allowable probiotic strains, viable-count labelling, and health claim thresholds so manufacturers can confidently develop functional powdered yogurts.
  • Incentives for decentralized processing: Offer capex support, tax breaks or concessional loans for micro-drying units (near cooperatives) to lower transport distances and add value locally.
  • Energy & emissions support: Provide grants or low-interest financing for energy-efficient spray/ freeze-drying technologies and renewable energy integration in processing plants.
  • Food safety & export facilitation: Harmonize pasteurization, moisture/activity limits, and export documentation to open refrigerated-free markets to powdered dairy exports.
  • Public procurement pilots: Use school feeding and emergency food programs to trial fortified, rehydratable yogurt powder formulations, building demand and validation data.

How Industry Bodies Could Support Market Development?

  • Standards for reconstitution & viability: Define testing protocols (rehydration time, texture, viable probiotic counts post-shelf-life) so buyers can compare suppliers objectively.
  • Labeling guidance & consumer education: Run campaigns explaining reconstitution ratios, nutritional equivalence to fresh yogurt, and proper storage - reducing perception barriers.
  • Export consortia & trade facilitation: Help small producers meet importer testing regimes and organize collective booths/credentials for buyers in target markets.
  • Technical training: Upskill operators on nozzle maintenance, inlet/outlet temperature control, and anti-caking strategies to cut product loss and variability.

How OEMs and Food-Tech Players Could Strengthen the Ecosystem?

  • Drying & encapsulation innovations: Advance microencapsulation and low-temperature drying solutions that preserve probiotic viability and creaminess while reducing heat damage.
  • Modular processing lines: Deliver compact spray-dry and freeze-dry units with integrated pasteurization and CIP (clean-in-place) aimed at cooperatives and regional processors.
  • Smart QA tooling: Provide inline moisture, particle-size, and viability sensors plus digital dashboards to reduce batch rejects and improve traceability.
  • Packaging & rehydration tech: Innovate barrier packaging with oxygen/moisture scavengers and single-serve reconstitution sachets that optimize consumer convenience.

How Suppliers Could Navigate the Shift?

  • Formulation finesse: Design carrier systems (e.g., combinations of maltodextrin, native starches, dairy proteins) that balance mouthfeel, solubility, and shelf stability without heavy additives.
  • Probiotic partnerships: Work with culture houses to source robust strains engineered/tuned for drying survival and targeted gut benefits.
  • Traceable milk sourcing: Lock in quality through contract farming, milk-testing protocols, and seasonal supply buffers to ensure consistent solids and flavor.
  • Application support: Offer technical services (dose guides, reconstitution trials, co-development) so food manufacturers can replace or blend fresh yogurt with powder reliably.

How Investors and Financial Enablers Could Unlock Value?

  • Plant capex financing: Provide structured financing for drying plants and upstream cold-chain to convert fresh milk into higher-margin powder products.
  • Growth equity for technology choices: Back firms commercializing low-heat drying, encapsulation for probiotics, or advanced packaging that extend shelf life.
  • Aggregation & scale plays: Fund roll-ups of regional processors and co-packers to create scale for R&D, QA labs, and export logistics.
  • Outcomes-linked finance: Use blended finance or impact capital that ties returns to metrics like rural income uplift, reduced food waste, or emissions saved via decentralized processing.

Key Players in the Yogurt Powder Market

  • Nestlé S.A.
  • Danone S.A.
  • General Mills, Inc.
  • Kerry Group plc
  • Glanbia plc

Scope of the Report

Items Values
Quantitative Units (2025) USD 356 Million
Type Regular, Low Fat, Non Fat
Flavor Plain and Flavored
Packaging Type Sachets/Pouches, Cans/Jars, and Bulk Packaging
Application Food And Beverage Industry, Nutraceuticals And Dietary Supplements, Cosmetics and Personal Care Products
Distribution Channel Supermarkets And Hypermarkets, Convenience Stores, Online Retailing, Specialty Stores, Others
Regions Covered North America, Europe, East Asia, South Asia & Pacific, Latin America, Middle East & Africa
Countries Covered China, India, Germany, France, United Kingdom, United States, Brazil, and 40+ countries
Key Companies Profiled Nestlé S.A., Danone S.A., General Mills, Inc., Kerry Group plc, Glanbia plc
Additional Attributes Dollar sales by type and application, regional demand trends across major markets, competitive landscape analysis, technological innovations in powder processing, quality standards and certification requirements, and emerging applications in functional foods and specialized nutrition products.

Yogurt Powder Market by Segments

Type:

  • Regular
  • Low Fat
  • Non Fat

Flavor

  • Plain
  • Flavored

Packaging Type

  • Sachets/pouches
  • Cans/jars
  • Bulk packaging

Application:

  • Food And Beverage Industry
  • Nutraceuticals And Dietary Supplements
  • Cosmetics And Personal Care Products

Region:

  • North America
    • United States
    • Canada
    • Mexico
  • Europe
    • Germany
    • France
    • United Kingdom
    • Italy
    • Spain
    • Rest of Europe
  • East Asia
    • China
    • Japan
    • South Korea
  • South Asia & Pacific
    • India
    • ASEAN
    • Australia & New Zealand
    • Rest of South Asia & Pacific
  • Latin America
    • Brazil
    • Chile
    • Rest of Latin America
  • Middle East & Africa
    • Kingdom of Saudi Arabia
    • Other GCC Countries
    • Turkey
    • South Africa
    • Rest of Middle East & Africa

Frequently Asked Questions

What is the current value of the Yogurt Powder Industry?

The global Yogurt Powder industry is estimated at a value of USD 356.0 million in 2025.

At what rate did the revenue stream for yogurt powder grow between 2020 and 2024?

Sales of Yogurt Powder increased at 5.2% CAGR between 2020 and 2024.

Who are the leading manufacturers of Yogurt Powder?

Nestlé S.A., Danone S.A., General Mills, Inc., Yakult Honsha Co., Ltd., and FrieslandCampina N.V. are some of the leading players in this industry.

Which region will garner a significant value share by 2035?

The South Asia domain is projected to hold a revenue share of 23% over the forecast period.

What share does North America account for in the global Yogurt Powder demand space in 2025?

North America holds 31% share of the global demand space for Yogurt Powder.

Table of Content

  1. Executive Summary
  2. Industry Introduction, including Taxonomy and Market Definition
  3. Trends and Success Factors, including Macro-economic Factors, Market Dynamics, and Recent Industry Developments
  4. Global Market Demand Analysis 2020 to 2024 and Forecast 2025 to 2035, including Historical Analysis and Future Projections
  5. Pricing Analysis
  6. Global Market Analysis 2020 to 2024 and Forecast 2025 to 2035
    • Type
    • Flavor
    • Packaging Type
    • Application
    • Distribution Channel
  7. Global Market Analysis 2020 to 2024 and Forecast 2025 to 2035, By Type
    • Regular
    • Low Fat
    • Non Fat
  8. Global Market Analysis 2020 to 2024 and Forecast 2025 to 2035, By Flavor
    • Plain
    • Flavored
  9. Global Market Analysis 2020 to 2024 and Forecast 2025 to 2035, By Packaging Type
    • Sachets/Pouches
    • Cans/Jars
    • Bulk Packaging
  10. Global Market Analysis 2020 to 2024 and Forecast 2025 to 2035, By Application
    • Food and Beverage Industry
    • Nutraceuticals and Dietary Supplements
    • Cosmetics and Personal Care Products
  11. Global Market Analysis 2020 to 2024 and Forecast 2025 to 2035, By Distribution Channel
    • Supermarkets and Hypermarkets
    • Convenience Stores
    • Online Retailing
    • Specialty Stores
    • Others
  12. Global Market Analysis 2020 to 2024 and Forecast 2025 to 2035, By Region
    • North America
    • Latin America
    • Western Europe
    • Eastern Europe
    • Balkans & Baltic
    • Russia & Belarus
    • Central Asia
    • East Asia
    • South Asia & Pacific
    • Middle East & Africa
  13. North America Sales Analysis 2020 to 2024 and Forecast 2025 to 2035, by Key Segments and Countries
  14. Latin America Sales Analysis 2020 to 2024 and Forecast 2025 to 2035, by Key Segments and Countries
  15. Western Europe Sales Analysis 2020 to 2024 and Forecast 2025 to 2035, by Key Segments and Countries
  16. Eastern Europe Sales Analysis 2020 to 2024 and Forecast 2025 to 2035, by Key Segments and Countries
  17. Balkans & Baltic Sales Analysis 2020 to 2024 and Forecast 2025 to 2035, by Key Segments and Countries
  18. Russia & Belarus Sales Analysis 2020 to 2024 and Forecast 2025 to 2035, by Key Segments and Countries
  19. Central Asia Sales Analysis 2020 to 2024 and Forecast 2025 to 2035, by Key Segments and Countries
  20. East Asia Sales Analysis 2020 to 2024 and Forecast 2025 to 2035, by Key Segments and Countries
  21. South Asia & Pacific Sales Analysis 2020 to 2024 and Forecast 2025 to 2035, by Key Segments and Countries
  22. Middle East & Africa Sales Analysis 2020 to 2024 and Forecast 2025 to 2035, by Key Segments and Countries
  23. Sales Forecast to 2035 by Type, Flavor, Packaging Type, Application, and Distribution Channel for 30 Countries
  24. Competitive Assessment, Company Share Analysis by Key Players, and Competition Dashboard
  25. Company Profile
    • Nestlé S.A.
    • Danone S.A.
    • General Mills, Inc.
    • Yakult Honsha Co., Ltd.
    • FrieslandCampina N.V.
    • The Kraft Heinz Company
    • Lactalis Group
    • Kerry Group plc
    • Morinaga Milk Industry Co., Ltd.
    • Chobani, LLC

List of Tables

  • Table 1: Global Market Value (USD Billion) Forecast by Region, 2020-2035
  • Table 2: Global Market Volume (Metric Tons) Forecast by Region, 2020-2035
  • Table 3: Global Market Value (USD Billion) Forecast by Type, 2020-2035
  • Table 4: Global Market Volume (Metric Tons) Forecast by Type, 2020-2035
  • Table 5: Global Market Value (USD Billion) Forecast by Flavor, 2020-2035
  • Table 6: Global Market Volume (Metric Tons) Forecast by Flavor, 2020-2035
  • Table 7: Global Market Value (USD Billion) Forecast by Packaging Type, 2020-2035
  • Table 8: Global Market Volume (Metric Tons) Forecast by Packaging Type, 2020-2035
  • Table 9: Global Market Value (USD Billion) Forecast by Application, 2020-2035
  • Table 10: Global Market Volume (Metric Tons) Forecast by Application, 2020-2035
  • Table 11: Global Market Value (USD Billion) Forecast by Distribution Channel, 2020-2035
  • Table 12: Global Market Volume (Metric Tons) Forecast by Distribution Channel, 2020-2035
  • Table 13: North America Market Value (USD Billion) Forecast by Country, 2020-2035
  • Table 14: North America Market Volume (Metric Tons) Forecast by Country, 2020-2035
  • Table 15: North America Market Value (USD Billion) Forecast by Type, 2020-2035
  • Table 16: North America Market Volume (Metric Tons) Forecast by Type, 2020-2035
  • Table 17: North America Market Value (USD Billion) Forecast by Flavor, 2020-2035
  • Table 18: North America Market Volume (Metric Tons) Forecast by Flavor, 2020-2035
  • Table 19: North America Market Value (USD Billion) Forecast by Packaging Type, 2020-2035
  • Table 20: North America Market Volume (Metric Tons) Forecast by Packaging Type, 2020-2035
  • Table 21: North America Market Value (USD Billion) Forecast by Application, 2020-2035
  • Table 22: North America Market Volume (Metric Tons) Forecast by Application, 2020-2035
  • Table 23: North America Market Value (USD Billion) Forecast by Distribution Channel, 2020-2035
  • Table 24: North America Market Volume (Metric Tons) Forecast by Distribution Channel, 2020-2035
  • Table 25: Latin America Market Value (USD Billion) Forecast by Country, 2020-2035
  • Table 26: Latin America Market Volume (Metric Tons) Forecast by Country, 2020-2035
  • Table 27: Latin America Market Value (USD Billion) Forecast by Type, 2020-2035
  • Table 28: Latin America Market Volume (Metric Tons) Forecast by Type, 2020-2035
  • Table 29: Latin America Market Value (USD Billion) Forecast by Flavor, 2020-2035
  • Table 30: Latin America Market Volume (Metric Tons) Forecast by Flavor, 2020-2035
  • Table 31: Latin America Market Value (USD Billion) Forecast by Packaging Type, 2020-2035
  • Table 32: Latin America Market Volume (Metric Tons) Forecast by Packaging Type, 2020-2035
  • Table 33: Latin America Market Value (USD Billion) Forecast by Application, 2020-2035
  • Table 34: Latin America Market Volume (Metric Tons) Forecast by Application, 2020-2035
  • Table 35: Latin America Market Value (USD Billion) Forecast by Distribution Channel, 2020-2035
  • Table 36: Latin America Market Volume (Metric Tons) Forecast by Distribution Channel, 2020-2035
  • Table 37: Western Europe Market Value (USD Billion) Forecast by Country, 2020-2035
  • Table 38: Western Europe Market Volume (Metric Tons) Forecast by Country, 2020-2035
  • Table 39: Western Europe Market Value (USD Billion) Forecast by Type, 2020-2035
  • Table 40: Western Europe Market Volume (Metric Tons) Forecast by Type, 2020-2035
  • Table 41: Western Europe Market Value (USD Billion) Forecast by Flavor, 2020-2035
  • Table 42: Western Europe Market Volume (Metric Tons) Forecast by Flavor, 2020-2035
  • Table 43: Western Europe Market Value (USD Billion) Forecast by Packaging Type, 2020-2035
  • Table 44: Western Europe Market Volume (Metric Tons) Forecast by Packaging Type, 2020-2035
  • Table 45: Western Europe Market Value (USD Billion) Forecast by Application, 2020-2035
  • Table 46: Western Europe Market Volume (Metric Tons) Forecast by Application, 2020-2035
  • Table 47: Western Europe Market Value (USD Billion) Forecast by Distribution Channel, 2020-2035
  • Table 48: Western Europe Market Volume (Metric Tons) Forecast by Distribution Channel, 2020-2035
  • Table 49: Eastern Europe Market Value (USD Billion) Forecast by Country, 2020-2035
  • Table 50: Eastern Europe Market Volume (Metric Tons) Forecast by Country, 2020-2035
  • Table 51: Eastern Europe Market Value (USD Billion) Forecast by Type, 2020-2035
  • Table 52: Eastern Europe Market Volume (Metric Tons) Forecast by Type, 2020-2035
  • Table 53: Eastern Europe Market Value (USD Billion) Forecast by Flavor, 2020-2035
  • Table 54: Eastern Europe Market Volume (Metric Tons) Forecast by Flavor, 2020-2035
  • Table 55: Eastern Europe Market Value (USD Billion) Forecast by Packaging Type, 2020-2035
  • Table 56: Eastern Europe Market Volume (Metric Tons) Forecast by Packaging Type, 2020-2035
  • Table 57: Eastern Europe Market Value (USD Billion) Forecast by Application, 2020-2035
  • Table 58: Eastern Europe Market Volume (Metric Tons) Forecast by Application, 2020-2035
  • Table 59: Eastern Europe Market Value (USD Billion) Forecast by Distribution Channel, 2020-2035
  • Table 60: Eastern Europe Market Volume (Metric Tons) Forecast by Distribution Channel, 2020-2035
  • Table 61: Balkans & Baltic Market Value (USD Billion) Forecast by Country, 2020-2035
  • Table 62: Balkans & Baltic Market Volume (Metric Tons) Forecast by Country, 2020-2035
  • Table 63: Balkans & Baltic Market Value (USD Billion) Forecast by Type, 2020-2035
  • Table 64: Balkans & Baltic Market Volume (Metric Tons) Forecast by Type, 2020-2035
  • Table 65: Balkans & Baltic Market Value (USD Billion) Forecast by Flavor, 2020-2035
  • Table 66: Balkans & Baltic Market Volume (Metric Tons) Forecast by Flavor, 2020-2035
  • Table 67: Balkans & Baltic Market Value (USD Billion) Forecast by Packaging Type, 2020-2035
  • Table 68: Balkans & Baltic Market Volume (Metric Tons) Forecast by Packaging Type, 2020-2035
  • Table 69: Balkans & Baltic Market Value (USD Billion) Forecast by Application, 2020-2035
  • Table 70: Balkans & Baltic Market Volume (Metric Tons) Forecast by Application, 2020-2035
  • Table 71: Balkans & Baltic Market Value (USD Billion) Forecast by Distribution Channel, 2020-2035
  • Table 72: Balkans & Baltic Market Volume (Metric Tons) Forecast by Distribution Channel, 2020-2035
  • Table 73: Russia & Belarus Market Value (USD Billion) Forecast by Country, 2020-2035
  • Table 74: Russia & Belarus Market Volume (Metric Tons) Forecast by Country, 2020-2035
  • Table 75: Russia & Belarus Market Value (USD Billion) Forecast by Type, 2020-2035
  • Table 76: Russia & Belarus Market Volume (Metric Tons) Forecast by Type, 2020-2035
  • Table 77: Russia & Belarus Market Value (USD Billion) Forecast by Flavor, 2020-2035
  • Table 78: Russia & Belarus Market Volume (Metric Tons) Forecast by Flavor, 2020-2035
  • Table 79: Russia & Belarus Market Value (USD Billion) Forecast by Packaging Type, 2020-2035
  • Table 80: Russia & Belarus Market Volume (Metric Tons) Forecast by Packaging Type, 2020-2035
  • Table 81: Russia & Belarus Market Value (USD Billion) Forecast by Application, 2020-2035
  • Table 82: Russia & Belarus Market Volume (Metric Tons) Forecast by Application, 2020-2035
  • Table 83: Russia & Belarus Market Value (USD Billion) Forecast by Distribution Channel, 2020-2035
  • Table 84: Russia & Belarus Market Volume (Metric Tons) Forecast by Distribution Channel, 2020-2035
  • Table 85: Central Asia Market Value (USD Billion) Forecast by Country, 2020-2035
  • Table 86: Central Asia Market Volume (Metric Tons) Forecast by Country, 2020-2035
  • Table 87: Central Asia Market Value (USD Billion) Forecast by Type, 2020-2035
  • Table 88: Central Asia Market Volume (Metric Tons) Forecast by Type, 2020-2035
  • Table 89: Central Asia Market Value (USD Billion) Forecast by Flavor, 2020-2035
  • Table 90: Central Asia Market Volume (Metric Tons) Forecast by Flavor, 2020-2035
  • Table 91: Central Asia Market Value (USD Billion) Forecast by Packaging Type, 2020-2035
  • Table 92: Central Asia Market Volume (Metric Tons) Forecast by Packaging Type, 2020-2035
  • Table 93: Central Asia Market Value (USD Billion) Forecast by Application, 2020-2035
  • Table 94: Central Asia Market Volume (Metric Tons) Forecast by Application, 2020-2035
  • Table 95: Central Asia Market Value (USD Billion) Forecast by Distribution Channel, 2020-2035
  • Table 96: Central Asia Market Volume (Metric Tons) Forecast by Distribution Channel, 2020-2035
  • Table 97: East Asia Market Value (USD Billion) Forecast by Country, 2020-2035
  • Table 98: East Asia Market Volume (Metric Tons) Forecast by Country, 2020-2035
  • Table 99: East Asia Market Value (USD Billion) Forecast by Type, 2020-2035
  • Table 100: East Asia Market Volume (Metric Tons) Forecast by Type, 2020-2035
  • Table 101: East Asia Market Value (USD Billion) Forecast by Flavor, 2020-2035
  • Table 102: East Asia Market Volume (Metric Tons) Forecast by Flavor, 2020-2035
  • Table 103: East Asia Market Value (USD Billion) Forecast by Packaging Type, 2020-2035
  • Table 104: East Asia Market Volume (Metric Tons) Forecast by Packaging Type, 2020-2035
  • Table 105: East Asia Market Value (USD Billion) Forecast by Application, 2020-2035
  • Table 106: East Asia Market Volume (Metric Tons) Forecast by Application, 2020-2035
  • Table 107: East Asia Market Value (USD Billion) Forecast by Distribution Channel, 2020-2035
  • Table 108: East Asia Market Volume (Metric Tons) Forecast by Distribution Channel, 2020-2035
  • Table 109: South Asia & Pacific Market Value (USD Billion) Forecast by Country, 2020-2035
  • Table 110: South Asia & Pacific Market Volume (Metric Tons) Forecast by Country, 2020-2035
  • Table 111: South Asia & Pacific Market Value (USD Billion) Forecast by Type, 2020-2035
  • Table 112: South Asia & Pacific Market Volume (Metric Tons) Forecast by Type, 2020-2035
  • Table 113: South Asia & Pacific Market Value (USD Billion) Forecast by Flavor, 2020-2035
  • Table 114: South Asia & Pacific Market Volume (Metric Tons) Forecast by Flavor, 2020-2035
  • Table 115: South Asia & Pacific Market Value (USD Billion) Forecast by Packaging Type, 2020-2035
  • Table 116: South Asia & Pacific Market Volume (Metric Tons) Forecast by Packaging Type, 2020-2035
  • Table 117: South Asia & Pacific Market Value (USD Billion) Forecast by Application, 2020-2035
  • Table 118: South Asia & Pacific Market Volume (Metric Tons) Forecast by Application, 2020-2035
  • Table 119: South Asia & Pacific Market Value (USD Billion) Forecast by Distribution Channel, 2020-2035
  • Table 120: South Asia & Pacific Market Volume (Metric Tons) Forecast by Distribution Channel, 2020-2035
  • Table 121: Middle East & Africa Market Value (USD Billion) Forecast by Country, 2020-2035
  • Table 122: Middle East & Africa Market Volume (Metric Tons) Forecast by Country, 2020-2035
  • Table 123: Middle East & Africa Market Value (USD Billion) Forecast by Type, 2020-2035
  • Table 124: Middle East & Africa Market Volume (Metric Tons) Forecast by Type, 2020-2035
  • Table 125: Middle East & Africa Market Value (USD Billion) Forecast by Flavor, 2020-2035
  • Table 126: Middle East & Africa Market Volume (Metric Tons) Forecast by Flavor, 2020-2035
  • Table 127: Middle East & Africa Market Value (USD Billion) Forecast by Packaging Type, 2020-2035
  • Table 128: Middle East & Africa Market Volume (Metric Tons) Forecast by Packaging Type, 2020-2035
  • Table 129: Middle East & Africa Market Value (USD Billion) Forecast by Application, 2020-2035
  • Table 130: Middle East & Africa Market Volume (Metric Tons) Forecast by Application, 2020-2035
  • Table 131: Middle East & Africa Market Value (USD Billion) Forecast by Distribution Channel, 2020-2035
  • Table 132: Middle East & Africa Market Volume (Metric Tons) Forecast by Distribution Channel, 2020-2035
  • Table 133: USA Market Value (USD Billion) by Type, 2020-2035
  • Table 134: USA Market Volume (Metric Tons) by Type, 2020-2035
  • Table 135: USA Market Value (USD Billion) by Flavor, 2020-2035
  • Table 136: USA Market Volume (Metric Tons) by Flavor, 2020-2035
  • Table 137: USA Market Value (USD Billion) by Packaging Type, 2020-2035
  • Table 138: USA Market Volume (Metric Tons) by Packaging Type, 2020-2035
  • Table 139: USA Market Value (USD Billion) by Application, 2020-2035
  • Table 140: USA Market Volume (Metric Tons) by Application, 2020-2035
  • Table 141: USA Market Value (USD Billion) by Distribution Channel, 2020-2035
  • Table 142: USA Market Volume (Metric Tons) by Distribution Channel, 2020-2035
  • Table 143: Canada Market Value (USD Billion) by Type, 2020-2035
  • Table 144: Canada Market Volume (Metric Tons) by Type, 2020-2035
  • Table 145: Canada Market Value (USD Billion) by Flavor, 2020-2035
  • Table 146: Canada Market Volume (Metric Tons) by Flavor, 2020-2035
  • Table 147: Canada Market Value (USD Billion) by Packaging Type, 2020-2035
  • Table 148: Canada Market Volume (Metric Tons) by Packaging Type, 2020-2035
  • Table 149: Canada Market Value (USD Billion) by Application, 2020-2035
  • Table 150: Canada Market Volume (Metric Tons) by Application, 2020-2035

List of Figures

  • Figure 1: Global Market Value (USD Billion) by Type, 2025-2035
  • Figure 2: Global Market Value (USD Billion) by Flavor, 2025-2035
  • Figure 3: Global Market Value (USD Billion) by Packaging Type, 2025-2035
  • Figure 4: Global Market Value (USD Billion) by Application, 2025-2035
  • Figure 5: Global Market Value (USD Billion) by Distribution Channel, 2025-2035
  • Figure 6: Global Market Value (USD Billion) by Region, 2025-2035
  • Figure 7: Global Market Value (USD Billion) Analysis by Region, 2020-2035
  • Figure 8: Global Market Volume (Metric Tons) Analysis by Region, 2020-2035
  • Figure 9: Global Market Value Share (%) and BPS Analysis by Region, 2025-2035
  • Figure 10: Global Market Y-o-Y Growth (%) Projections by Region, 2025-2035
  • Figure 11: Global Market Value (USD Billion) Analysis by Type, 2020-2035
  • Figure 12: Global Market Volume (Metric Tons) Analysis by Type, 2020-2035
  • Figure 13: Global Market Value Share (%) and BPS Analysis by Type, 2025-2035
  • Figure 14: Global Market Y-o-Y Growth (%) Projections by Type, 2025-2035
  • Figure 15: Global Market Value (USD Billion) Analysis by Flavor, 2020-2035
  • Figure 16: Global Market Volume (Metric Tons) Analysis by Flavor, 2020-2035
  • Figure 17: Global Market Value Share (%) and BPS Analysis by Flavor, 2025-2035
  • Figure 18: Global Market Y-o-Y Growth (%) Projections by Flavor, 2025-2035
  • Figure 19: Global Market Value (USD Billion) Analysis by Packaging Type, 2020-2035
  • Figure 20: Global Market Volume (Metric Tons) Analysis by Packaging Type, 2020-2035
  • Figure 21: Global Market Value Share (%) and BPS Analysis by Packaging Type, 2025-2035
  • Figure 22: Global Market Y-o-Y Growth (%) Projections by Packaging Type, 2025-2035
  • Figure 23: Global Market Value (USD Billion) Analysis by Application, 2020-2035
  • Figure 24: Global Market Volume (Metric Tons) Analysis by Application, 2020-2035
  • Figure 25: Global Market Value Share (%) and BPS Analysis by Application, 2025-2035
  • Figure 26: Global Market Y-o-Y Growth (%) Projections by Application, 2025-2035
  • Figure 27: Global Market Value (USD Billion) Analysis by Distribution Channel, 2020-2035
  • Figure 28: Global Market Volume (Metric Tons) Analysis by Distribution Channel, 2020-2035
  • Figure 29: Global Market Value Share (%) and BPS Analysis by Distribution Channel, 2025-2035
  • Figure 30: Global Market Y-o-Y Growth (%) Projections by Distribution Channel, 2025-2035
  • Figure 31: Global Market Attractiveness by Type, 2025-2035
  • Figure 32: Global Market Attractiveness by Flavor, 2025-2035
  • Figure 33: Global Market Attractiveness by Packaging Type, 2025-2035
  • Figure 34: Global Market Attractiveness by Application, 2025-2035
  • Figure 35: Global Market Attractiveness by Distribution Channel, 2025-2035
  • Figure 36: Global Market Attractiveness by Region, 2025-2035
  • Figure 37: North America Market Value (USD Billion) by Type, 2025-2035
  • Figure 38: North America Market Value (USD Billion) by Flavor, 2025-2035
  • Figure 39: North America Market Value (USD Billion) by Packaging Type, 2025-2035
  • Figure 40: North America Market Value (USD Billion) by Application, 2025-2035
  • Figure 41: North America Market Value (USD Billion) by Distribution Channel, 2025-2035
  • Figure 42: North America Market Value (USD Billion) by Country, 2025-2035
  • Figure 43: North America Market Value (USD Billion) Analysis by Country, 2020-2035
  • Figure 44: North America Market Volume (Metric Tons) Analysis by Country, 2020-2035
  • Figure 45: North America Market Value Share (%) and BPS Analysis by Country, 2025-2035
  • Figure 46: North America Market Y-o-Y Growth (%) Projections by Country, 2025-2035
  • Figure 47: North America Market Value (USD Billion) Analysis by Type, 2020-2035
  • Figure 48: North America Market Volume (Metric Tons) Analysis by Type, 2020-2035
  • Figure 49: North America Market Value Share (%) and BPS Analysis by Type, 2025-2035
  • Figure 50: North America Market Y-o-Y Growth (%) Projections by Type, 2025-2035
  • Figure 51: North America Market Value (USD Billion) Analysis by Flavor, 2020-2035
  • Figure 52: North America Market Volume (Metric Tons) Analysis by Flavor, 2020-2035
  • Figure 53: North America Market Value Share (%) and BPS Analysis by Flavor, 2025-2035
  • Figure 54: North America Market Y-o-Y Growth (%) Projections by Flavor, 2025-2035
  • Figure 55: North America Market Value (USD Billion) Analysis by Packaging Type, 2020-2035
  • Figure 56: North America Market Volume (Metric Tons) Analysis by Packaging Type, 2020-2035
  • Figure 57: North America Market Value Share (%) and BPS Analysis by Packaging Type, 2025-2035
  • Figure 58: North America Market Y-o-Y Growth (%) Projections by Packaging Type, 2025-2035
  • Figure 59: North America Market Value (USD Billion) Analysis by Application, 2020-2035
  • Figure 60: North America Market Volume (Metric Tons) Analysis by Application, 2020-2035
  • Figure 61: North America Market Value Share (%) and BPS Analysis by Application, 2025-2035
  • Figure 62: North America Market Y-o-Y Growth (%) Projections by Application, 2025-2035
  • Figure 63: North America Market Value (USD Billion) Analysis by Distribution Channel, 2020-2035
  • Figure 64: North America Market Volume (Metric Tons) Analysis by Distribution Channel, 2020-2035
  • Figure 65: North America Market Value Share (%) and BPS Analysis by Distribution Channel, 2025-2035
  • Figure 66: North America Market Y-o-Y Growth (%) Projections by Distribution Channel, 2025-2035
  • Figure 67: North America Market Attractiveness by Type, 2025-2035
  • Figure 68: North America Market Attractiveness by Flavor, 2025-2035
  • Figure 69: North America Market Attractiveness by Packaging Type, 2025-2035
  • Figure 70: North America Market Attractiveness by Application, 2025-2035
  • Figure 71: North America Market Attractiveness by Distribution Channel, 2025-2035
  • Figure 72: North America Market Attractiveness by Country, 2025-2035
  • Figure 73: Latin America Market Value (USD Billion) by Type, 2025-2035
  • Figure 74: Latin America Market Value (USD Billion) by Flavor, 2025-2035
  • Figure 75: Latin America Market Value (USD Billion) by Packaging Type, 2025-2035
  • Figure 76: Latin America Market Value (USD Billion) by Application, 2025-2035
  • Figure 77: Latin America Market Value (USD Billion) by Distribution Channel, 2025-2035
  • Figure 78: Latin America Market Value (USD Billion) by Country, 2025-2035
  • Figure 79: Latin America Market Value (USD Billion) Analysis by Country, 2020-2035
  • Figure 80: Latin America Market Volume (Metric Tons) Analysis by Country, 2020-2035
  • Figure 81: Latin America Market Value Share (%) and BPS Analysis by Country, 2025-2035
  • Figure 82: Latin America Market Y-o-Y Growth (%) Projections by Country, 2025-2035
  • Figure 83: Latin America Market Value (USD Billion) Analysis by Type, 2020-2035
  • Figure 84: Latin America Market Volume (Metric Tons) Analysis by Type, 2020-2035
  • Figure 85: Latin America Market Value Share (%) and BPS Analysis by Type, 2025-2035
  • Figure 86: Latin America Market Y-o-Y Growth (%) Projections by Type, 2025-2035
  • Figure 87: Latin America Market Value (USD Billion) Analysis by Flavor, 2020-2035
  • Figure 88: Latin America Market Volume (Metric Tons) Analysis by Flavor, 2020-2035
  • Figure 89: Latin America Market Value Share (%) and BPS Analysis by Flavor, 2025-2035
  • Figure 90: Latin America Market Y-o-Y Growth (%) Projections by Flavor, 2025-2035
  • Figure 91: Latin America Market Value (USD Billion) Analysis by Packaging Type, 2020-2035
  • Figure 92: Latin America Market Volume (Metric Tons) Analysis by Packaging Type, 2020-2035
  • Figure 93: Latin America Market Value Share (%) and BPS Analysis by Packaging Type, 2025-2035
  • Figure 94: Latin America Market Y-o-Y Growth (%) Projections by Packaging Type, 2025-2035
  • Figure 95: Latin America Market Value (USD Billion) Analysis by Application, 2020-2035
  • Figure 96: Latin America Market Volume (Metric Tons) Analysis by Application, 2020-2035
  • Figure 97: Latin America Market Value Share (%) and BPS Analysis by Application, 2025-2035
  • Figure 98: Latin America Market Y-o-Y Growth (%) Projections by Application, 2025-2035
  • Figure 99: Latin America Market Value (USD Billion) Analysis by Distribution Channel, 2020-2035
  • Figure 100: Latin America Market Volume (Metric Tons) Analysis by Distribution Channel, 2020-2035
  • Figure 101: Latin America Market Value Share (%) and BPS Analysis by Distribution Channel, 2025-2035
  • Figure 102: Latin America Market Y-o-Y Growth (%) Projections by Distribution Channel, 2025-2035
  • Figure 103: Latin America Market Attractiveness by Type, 2025-2035
  • Figure 104: Latin America Market Attractiveness by Flavor, 2025-2035
  • Figure 105: Latin America Market Attractiveness by Packaging Type, 2025-2035
  • Figure 106: Latin America Market Attractiveness by Application, 2025-2035
  • Figure 107: Latin America Market Attractiveness by Distribution Channel, 2025-2035
  • Figure 108: Latin America Market Attractiveness by Country, 2025-2035
  • Figure 109: Western Europe Market Value (USD Billion) by Type, 2025-2035
  • Figure 110: Western Europe Market Value (USD Billion) by Flavor, 2025-2035
  • Figure 111: Western Europe Market Value (USD Billion) by Packaging Type, 2025-2035
  • Figure 112: Western Europe Market Value (USD Billion) by Application, 2025-2035
  • Figure 113: Western Europe Market Value (USD Billion) by Distribution Channel, 2025-2035
  • Figure 114: Western Europe Market Value (USD Billion) by Country, 2025-2035
  • Figure 115: Western Europe Market Value (USD Billion) Analysis by Country, 2020-2035
  • Figure 116: Western Europe Market Volume (Metric Tons) Analysis by Country, 2020-2035
  • Figure 117: Western Europe Market Value Share (%) and BPS Analysis by Country, 2025-2035
  • Figure 118: Western Europe Market Y-o-Y Growth (%) Projections by Country, 2025-2035
  • Figure 119: Western Europe Market Value (USD Billion) Analysis by Type, 2020-2035
  • Figure 120: Western Europe Market Volume (Metric Tons) Analysis by Type, 2020-2035
  • Figure 121: Western Europe Market Value Share (%) and BPS Analysis by Type, 2025-2035
  • Figure 122: Western Europe Market Y-o-Y Growth (%) Projections by Type, 2025-2035
  • Figure 123: Western Europe Market Value (USD Billion) Analysis by Flavor, 2020-2035
  • Figure 124: Western Europe Market Volume (Metric Tons) Analysis by Flavor, 2020-2035
  • Figure 125: Western Europe Market Value Share (%) and BPS Analysis by Flavor, 2025-2035
  • Figure 126: Western Europe Market Y-o-Y Growth (%) Projections by Flavor, 2025-2035
  • Figure 127: Western Europe Market Value (USD Billion) Analysis by Packaging Type, 2020-2035
  • Figure 128: Western Europe Market Volume (Metric Tons) Analysis by Packaging Type, 2020-2035
  • Figure 129: Western Europe Market Value Share (%) and BPS Analysis by Packaging Type, 2025-2035
  • Figure 130: Western Europe Market Y-o-Y Growth (%) Projections by Packaging Type, 2025-2035
  • Figure 131: Western Europe Market Value (USD Billion) Analysis by Application, 2020-2035
  • Figure 132: Western Europe Market Volume (Metric Tons) Analysis by Application, 2020-2035
  • Figure 133: Western Europe Market Value Share (%) and BPS Analysis by Application, 2025-2035
  • Figure 134: Western Europe Market Y-o-Y Growth (%) Projections by Application, 2025-2035
  • Figure 135: Western Europe Market Value (USD Billion) Analysis by Distribution Channel, 2020-2035
  • Figure 136: Western Europe Market Volume (Metric Tons) Analysis by Distribution Channel, 2020-2035
  • Figure 137: Western Europe Market Value Share (%) and BPS Analysis by Distribution Channel, 2025-2035
  • Figure 138: Western Europe Market Y-o-Y Growth (%) Projections by Distribution Channel, 2025-2035
  • Figure 139: Western Europe Market Attractiveness by Type, 2025-2035
  • Figure 140: Western Europe Market Attractiveness by Flavor, 2025-2035
  • Figure 141: Western Europe Market Attractiveness by Packaging Type, 2025-2035
  • Figure 142: Western Europe Market Attractiveness by Application, 2025-2035
  • Figure 143: Western Europe Market Attractiveness by Distribution Channel, 2025-2035
  • Figure 144: Western Europe Market Attractiveness by Country, 2025-2035
  • Figure 145: Eastern Europe Market Value (USD Billion) by Type, 2025-2035
  • Figure 146: Eastern Europe Market Value (USD Billion) by Flavor, 2025-2035
  • Figure 147: Eastern Europe Market Value (USD Billion) by Packaging Type, 2025-2035
  • Figure 148: Eastern Europe Market Value (USD Billion) by Application, 2025-2035
  • Figure 149: Eastern Europe Market Value (USD Billion) by Distribution Channel, 2025-2035
  • Figure 150: Eastern Europe Market Value (USD Billion) by Country, 2025-2035
Dashboard
Dashboard
Dashboard
Dashboard
Dashboard
Dashboard

Full Research Suite comprises of:

Market outlook & trends analysis

Market outlook & trends analysis

Interviews & case studies

Interviews & case studies

Strategic recommendations

Strategic recommendations

Vendor profiles & capabilities analysis

Vendor profiles & capabilities analysis

5-year forecasts

5-year forecasts

8 regions and 60+ country-level data splits

8 regions and 60+ country-level data splits

Market segment data splits

Market segment data splits

12 months of continuous data updates

12 months of continuous data updates

DELIVERED AS:

PDF EXCEL ONLINE

Full Research Suite


$3500

$5000

$6500

Buy Report Now
Similar Industry Reports

Similar Industry Reports

Japan Yogurt Powder Market

Japan Yogurt Powder Market Analysis by Product Type, Flavor, Nature, Application, End-Use, and Distribution Channel Through 2035

Demand and Trend Analysis of Yogurt Powder in Western Europe

Demand and Trend Analysis of Yogurt Powder in Western Europe Size and Share Forecast Outlook 2025 to 2035

Demand and Trend Analysis of Yogurt Powder in Korea

Demand and Trend Analysis of Yogurt Powder in Korea Size and Share Forecast Outlook 2025 to 2035

Yogurt Dips Market
Yogurt Dips Market

Yogurt Dips Market Size, Growth, and Forecast for 2025 to 2035

Yogurt Market
Yogurt Market

Yogurt Market Analysis - Size, Share, & Forecast Outlook 2025 to 2035

Yogurt Maker Market
Yogurt Maker Market

Yogurt Maker Market – Trends, Growth & Forecast 2025 to 2035

Yogurt Packaging Market

Yogurt Packaging Market Trends – Growth & Demand Forecast 2025 to 2035

Yogurt And Probiotic Drink Market

Yogurt And Probiotic Drink Market Analysis by Product Type, Source Type, and Region Through 2035

A2 Yogurt Market
A2 Yogurt Market

A2 Yogurt Market Trends – Growth, Demand & Innovations

Dry Yogurt Market
Dry Yogurt Market

Dry Yogurt Market Outlook - Growth, Demand & Forecast 2025 to 2035

Greek Yogurt Market
Greek Yogurt Market

Greek Yogurt Market Size and Share Forecast Outlook 2025 to 2035

Vegan Yogurt Market
Vegan Yogurt Market

Vegan Yogurt Market Size, Growth, and Forecast for 2025 to 2035

Citrus Yogurt Market

Citrus Yogurt Market Insights – Flavor Trends & Consumer Demand 2025 to 2035

Savory Yogurt Market

Analysis and Growth Projections for Savory Yogurt Market

Frozen Yogurt Market

Frozen Yogurt Market Insights – Growth & Forecast 2024-2034

Non-GMO yogurt Market

Non-GMO yogurt Market Analysis by Product Type, By End use, By Distribution Channel of the and End User Through 2035

Flavored Yogurt Market

Flavored Yogurt Market Analysis by Form, Flavor, End Use and Distribution Channel Through 2035

Non-Dairy Yogurt Market

Non-Dairy Yogurt Market Analysis - Size, Share, and Forecast Outlook 2025 to 2035

Drinkable Yogurt Market

Drinkable Yogurt Market Size and Share Forecast Outlook 2025 to 2035

Probiotic Yogurt Market

Probiotic Yogurt Market Analysis - Size, Share & Forecast 2025 to 2035

Future Market Insights

Yogurt Powder Market

Chat With MaRIA

Chat With

MaRIA

Hi There, I am MaRIA, Your Market Research Intelligence Assistant. How may I help you?