Sales of yogurt powder in Korea are estimated at USD 13.5 million in 2025, with projections indicating a rise to USD 29.1 million by 2035, reflecting a CAGR of approximately 8.0% over the forecast period.
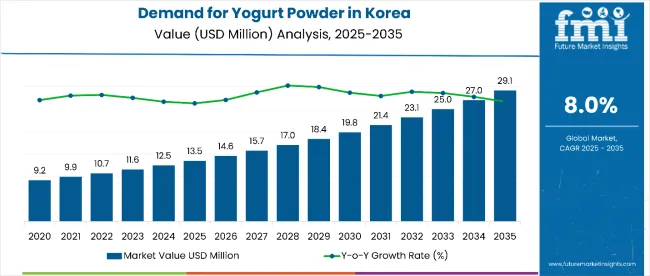
Korea Yogurt Powder Sales Analysis: Key Takeaways
| Metric | Value |
|---|---|
| Industry Size (2025E) | USD 13.5 million |
| Industry Value (2035F) | USD 29.1 million |
| CAGR (2025 to 2035) | 8.0% |
This growth reflects both expanding health consciousness among Korean consumers and increased adoption of functional dairy alternatives across food applications. The rise in demand is linked to growing K-beauty trends, sports nutrition awareness, and evolving convenience food preferences in Korean culture. By 2025, per capita consumption in leading Korean regions such as South Gyeongsang, North Jeolla, and South Jeolla averages between 0.25 to 0.35 kilograms, with projections reaching 0.45 kilograms by 2035. South Gyeongsang leads among Korean regions, expected to generate USD 10.2 million in yogurt powder sales by 2035, followed by North Jeolla (USD 7.5 million), South Jeolla (USD 5.8 million), Jeju (USD 2.9 million), and rest of Korea (USD 2.8 million).
The largest contribution to demand continues to come from skimmed yogurt powder formulations, which are expected to account for 57% of total sales in 2025, owing to health-conscious consumer preferences, weight management trends, and fitness-oriented lifestyle adoption. By flavor profile, regular flavor represents the dominant segment, responsible for 76% of all sales, while specialty flavored variants including fruit and functional options are expanding steadily.
Consumer adoption is particularly concentrated among health-conscious millennials, fitness enthusiasts, and beauty-conscious consumers seeking functional nutrition, with wellness trends and K-beauty influence emerging as significant drivers of demand. While premium positioning supports value growth, the expanding integration into Korean culinary applications and beauty-from-within concepts continues to drive volume expansion. Regional disparities persist, but per capita demand in emerging wellness-focused regions is narrowing the gap with established health and beauty consumption centers in metropolitan Seoul and surrounding areas.
The yogurt powder in Korea include product type, nature, flavour, application, end use, distribution channel, and region. The product type segment covers skimmed, semi-skimmed, and whole. The nature segment includes organic and conventional. The flavour segment comprises regular and flavoured, with flavoured including berries, vanilla, chocolate, peach, mango, banana, apple, and others (passion fruit, blends).
The application segment includes food industry (dips and dressings, fillings, bakery, nutrition and snack bar, desserts, frozen novelties, dry mixes, and others such as meat products, cereals), beverages, and cosmetics & personal care. The end use segment covers household, HoReCa, and industrial (food & beverage processors, cosmetic manufacturers). The distribution channel segment includes B2B, B2C, store-based retail (modern grocery retailers, hypermarkets/supermarkets, convenience stores, food & drink specialty stores, independent small groceries), and online retail. The regional segment includes South Gyeongsang, North Jeolla, South Jeolla, Jeju, and rest of region.
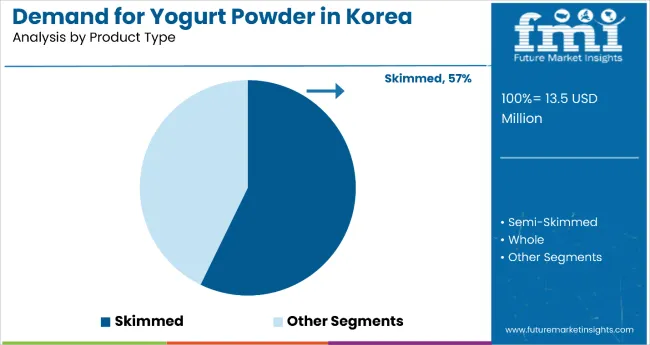
Skimmed yogurt powder formulations are projected to dominate sales in 2025, supported by Korean health and fitness culture, weight management trends, and beauty-from-within philosophy. Other variants such as semi-skimmed and whole powder formats are growing steadily, each serving distinct nutritional and application requirements.
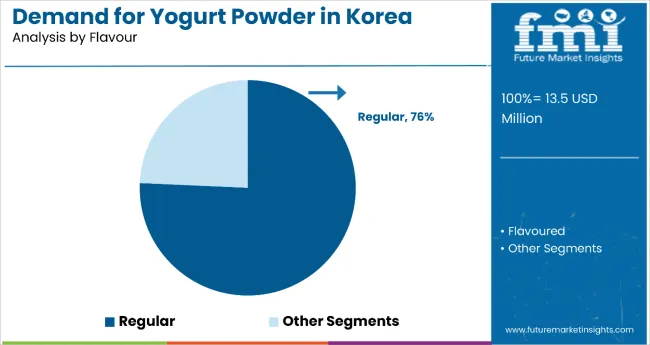
Yogurt powder applications in Korea encompass diverse flavor profiles catering to varying consumer preferences and cultural taste requirements. Regular flavor formulations are expected to remain the primary segment in 2025, followed by fruit-flavored and specialty variants. Flavor preferences are evolving to match Korean culinary traditions and K-beauty application needs.
| Regions | CAGR (2025 to 2035) |
|---|---|
| South Gyeongsang | 8.6% |
| North Jeolla | 8.3% |
| South Jeolla | 7.8% |
| Jeju | 7.5% |
| Rest of Korea | 7.2% |
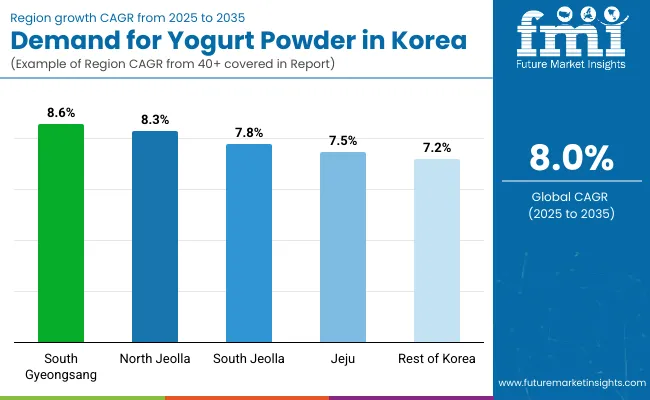
In the demand and trend analysis of yogurt powder in Korea, South Gyeongsang leads growth with a CAGR of 8.6%, reflecting its dominance in production capacity and efficiency. North Jeolla follows closely at 8.3%, driven by capacity expansion and sustainability-focused production. South Jeolla, with a CAGR of 7.8%, balances traditional expertise and modern technology to maintain steady growth. Jeju records 7.5%, carving a premium niche through quality, branding, and tourism-linked marketing. The Rest of Korea shows the slowest yet steady growth at 7.2%, supported by diversified smaller hubs leveraging online sales and flexible production.
Yogurt powder sales will not grow uniformly across every Korean region. Rising health consciousness and K-beauty culture adoption in South Gyeongsang and North Jeolla provide these regions with a measurable advantage, while other Korean regions expand more steadily from varying baseline consumption levels. The table below shows the compound annual growth rate (CAGR) each of the major regions is expected to record between 2025 and 2035.
South Gyeongsang yogurt powder revenue stands as the largest contributor to Korea’s yogurt powder market with a CAGR of 8.6%,driven by its advanced production infrastructure, consistent raw material availability, and modern manufacturing technologies. The region’s dairy processing sector benefits from strong government incentives and proximity to major distribution hubs. South Gyeongsang leads growth through skilled labor, research-backed innovation, and quality improvements. Strategic partnerships with both domestic and international brands enhance market penetration, while automation adoption boosts efficiency. Environmental compliance measures are also enhancing brand reputation. This dominance is expected to sustain as demand for high-quality yogurt powder continues to rise.
North Jeolla yogurt powder demand is projected with a CAGR of 8.3%, plays a critical role.The productionwith a focus on expanding capacity to meet both domestic and export demand. The province has been modernizing processing plants and upgrading technology to improve yield and maintain quality. the region is embracing sustainability as a key differentiator, with eco-friendly production practices gaining momentum. Collaboration between universities, research centers, and industry players drives innovation and product diversification. Local producers are targeting niche flavor profiles and functional yogurt powders to capture health-conscious consumers. Infrastructure improvements are reducing logistical costs and improving delivery times, supporting steady market growth.
Sales of yogurt powder in South Jeolla has a balanced approach to yogurt powder production with a CAGR of 7.8%, blending traditional dairy processing expertise with modern technologies. The region is increasing capacity through modernized facilities, while emphasizing sustainable and energy-efficient processes. South Jeolla is also leveraging strong regional branding to maintain consumer loyalty. Producers are investing in automation to boost output and reduce operational costs. Partnerships with flavor developers and ingredient suppliers enable product diversification that appeals to broader markets. The experienced local workforce continues to ensure consistent quality standards. As demand grows, the region’s adaptability and focus on premium positioning will remain key.
Jeju yogurt powder revenue is projected with a CAGR Of 7.5% leverages its clean image and unique brand identity to produce premium yogurt powder for high-value segments. Known for pristine raw materials and distinctive flavors, the region caters to luxury and export markets. Jeju’s growth is supported by tourism-driven brand recognition and strong sustainability credentials. Local manufacturers are integrating renewable energy in production, enhancing eco-friendly appeal. Efficient cold chain logistics ensure freshness despite geographic isolation. R&D is focused on functional and specialty yogurt powders, helping the region differentiate itself. By combining premium quality with innovation, Jeju continues to carve out a strong niche.
Sales of yogurt powder in the Rest of Korea is projected with a CAGR of 7.2%, includes multiple smaller production hubs that collectively support national yogurt powder supply. These regions focus on cost-effective manufacturing and niche market opportunities, often developing unique flavors or health-oriented products. they are leveraging digital sales channels to connect directly with consumers. Infrastructure upgrades in transport and storage have strengthened supply chain reliability, while government programs provide subsidies and technical training. Although smaller in scale compared to leading provinces, these regions offer flexibility, quick adaptation, and diverse offerings that support steady, long-term growth.
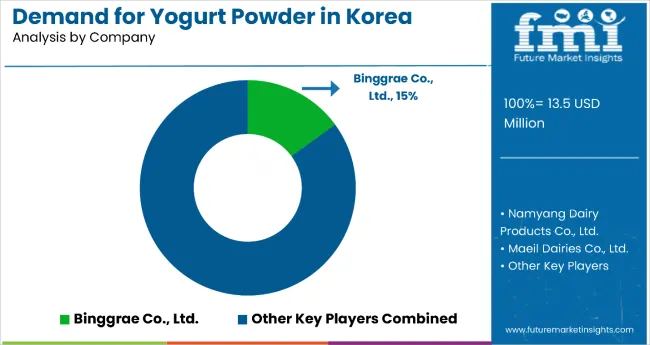
The competitive environment is characterized by a mix of established Korean dairy companies and specialized food ingredient manufacturers. Cultural understanding and Korean consumer relationships rather than product innovation alone remain decisive success factors: the leading suppliers collectively serve more than 8,000 Korean food manufacturing facilities and maintain strong presence across traditional and modern Korean food channels.
Binggrae Co., Ltd. maintains strong positioning as Korea's trusted dairy brand. The company offers comprehensive yogurt powder formulations tailored to Korean taste preferences and cultural applications, with particular strength in understanding Korean consumer behavior and traditional food integration. Its core range of health-focused and culturally-adapted variants provides deep penetration in Korean retail channels while maintaining broad coverage through traditional Korean food distribution networks.
Namyang Dairy Products Co., Ltd., leveraging extensive Korean dairy processing heritage and local supply chain capabilities, positions yogurt powder within its broader Korean nutrition portfolio. The company's focus on Korean health culture and wellness-oriented formulations reinforces its role as a premium supplier for health-conscious Korean consumers and traditional food manufacturers.
Maeil Dairies Co., Ltd. benefits from established Korean dairy expertise and strong relationships with Korean food manufacturers and retailers. Recent product development focuses on K-beauty influenced formulations and functional ingredients that address Korean wellness trends, targeting both efficiency and cultural relevance in Korean food processing.
Seoul Dairy Cooperative maintains significant presence in the Korean cooperative dairy sector with specialized yogurt powder formulations designed for different Korean culinary applications. The cooperative's community-based approach and local sourcing capabilities support premium positioning in Korean traditional and modern food preparation.
Lotte Confectionery Co., Ltd. focuses on confectionery and snack applications and maintains strong presence in Korean food manufacturing sectors. The company's emphasis on Korean taste innovation and cultural integration appeals to Korean food manufacturers seeking ingredients that align with local preferences and modern health trends.
Private-label programs at major Korean retailers are expanding assortment at competitive price points, putting margin pressure on smaller suppliers while supporting broader access to yogurt powder ingredients across Korean consumer segments. Consolidation is likely to continue as cultural adaptation capabilities and Korean food processing partnerships become critical for maintaining supply relationships and application development support in this culturally-specific category.
| Item | Value |
|---|---|
| Quantitative Units (2025) | USD 13.5 million |
| By Product Type | Skimmed, Semi-Skimmed, Whole |
| By Nature | Organic, Conventional |
| By Flavour | Regular, Flavoured (Berries, Vanilla, Chocolate, Peach, Mango, Banana, Apple, Others such as Passion Fruit and Blends) |
| By Application | Food Industry (Dips and Dressings, Fillings, Bakery, Nutrition and Snack Bar, Desserts, Frozen Novelties, Dry Mixes, Others such as Meat Products and Cereals), Beverages, Cosmetics & Personal Care |
| By End Use | Household, HoReCa, Industrial (Food & Beverage Processors, Cosmetic Manufacturers) |
| By Distribution Channel | B2B, B2C, Store-Based Retail (Modern Grocery Retailers, Hypermarkets/Supermarkets, Convenience Stores, Food & Drink Specialty Stores, Independent Small Groceries), Online Retail |
| Regions Covered | South Gyeongsang, North Jeolla, South Jeolla, Jeju, Rest of Korea |
| Top Companies Profiled |
Binggrae Co., Ltd., Namyang Dairy Products Co., Ltd., Maeil Dairies Co., Ltd., Seoul Dairy Cooperative, Lotte Confectionery Co., Ltd., Ottogi Corporation, Yonsei Milk, Pulmuone Co., Ltd., Dongwon F&B Co., Ltd., and Haitai Confectionery & Foods Co., Ltd. |
| Additional Attributes | Rising demand for shelf-stable dairy products, increasing popularity of flavored and functional yogurt powders, growing applications in bakery and beverages, expansion in HoReCa and industrial uses, adoption of online retail channels, focus on clean-label and organic formulations, investment in sustainable dairy sourcing and advanced processing technologies |
The global demand and trend analysis of yogurt powder in Korea is estimated to be valued at USD 13.5 million in 2025.
The market size for the demand and trend analysis of yogurt powder in Korea is projected to reach USD 29.1 million by 2035.
The demand and trend analysis of yogurt powder in Korea is expected to grow at a 8.0% CAGR between 2025 and 2035.
The key product types in demand and trend analysis of yogurt powder in Korea are whole yogurt powder, skimmed yogurt powder and semi-skimmed yogurt powder.
In terms of nature, conventional segment to command 88.4% share in the demand and trend analysis of yogurt powder in Korea in 2025.


Our Research Products

The "Full Research Suite" delivers actionable market intel, deep dives on markets or technologies, so clients act faster, cut risk, and unlock growth.

The Leaderboard benchmarks and ranks top vendors, classifying them as Established Leaders, Leading Challengers, or Disruptors & Challengers.

Locates where complements amplify value and substitutes erode it, forecasting net impact by horizon

We deliver granular, decision-grade intel: market sizing, 5-year forecasts, pricing, adoption, usage, revenue, and operational KPIs—plus competitor tracking, regulation, and value chains—across 60 countries broadly.

Spot the shifts before they hit your P&L. We track inflection points, adoption curves, pricing moves, and ecosystem plays to show where demand is heading, why it is changing, and what to do next across high-growth markets and disruptive tech

Real-time reads of user behavior. We track shifting priorities, perceptions of today’s and next-gen services, and provider experience, then pace how fast tech moves from trial to adoption, blending buyer, consumer, and channel inputs with social signals (#WhySwitch, #UX).

Partner with our analyst team to build a custom report designed around your business priorities. From analysing market trends to assessing competitors or crafting bespoke datasets, we tailor insights to your needs.
Supplier Intelligence
Discovery & Profiling
Capacity & Footprint
Performance & Risk
Compliance & Governance
Commercial Readiness
Who Supplies Whom
Scorecards & Shortlists
Playbooks & Docs
Category Intelligence
Definition & Scope
Demand & Use Cases
Cost Drivers
Market Structure
Supply Chain Map
Trade & Policy
Operating Norms
Deliverables
Buyer Intelligence
Account Basics
Spend & Scope
Procurement Model
Vendor Requirements
Terms & Policies
Entry Strategy
Pain Points & Triggers
Outputs
Pricing Analysis
Benchmarks
Trends
Should-Cost
Indexation
Landed Cost
Commercial Terms
Deliverables
Brand Analysis
Positioning & Value Prop
Share & Presence
Customer Evidence
Go-to-Market
Digital & Reputation
Compliance & Trust
KPIs & Gaps
Outputs
Full Research Suite comprises of:
Market outlook & trends analysis
Interviews & case studies
Strategic recommendations
Vendor profiles & capabilities analysis
5-year forecasts
8 regions and 60+ country-level data splits
Market segment data splits
12 months of continuous data updates
DELIVERED AS:
PDF EXCEL ONLINE
Korea Powdered Cellulose Market Analysis by Source, End-use, Functionality, and Region Through 2035
Yogurt Powder Market Analysis - Size, Share, and Forecast Outlook 2025 to 2035
Korea Baby Powder Market Analysis – Size, Share & Trends 2025 to 2035
Korea Probiotic Yogurt Market Analysis by Product Type, Flavor, Sales Channel, and Region Through 2035
Japan Yogurt Powder Market Analysis by Product Type, Flavor, Nature, Application, End-Use, and Distribution Channel Through 2035
Demand and Trend Analysis of Yogurt Powder in Western Europe Size and Share Forecast Outlook 2025 to 2035
Demand and Trends Analysis of Fat Filled Milk Powder in Korea Size and Share Forecast Outlook 2025 to 2035
Korea Automotive Performance Tuning and Engine Remapping Service Industry Size and Share Forecast Outlook 2025 to 2035
Korea Smart Home Security Camera Market Size and Share Forecast Outlook 2025 to 2035
Korea Automated People Mover Industry Size and Share Forecast Outlook 2025 to 2035
Korea Bicycle Component Aftermarket Analysis Size and Share Forecast Outlook 2025 to 2035
Powdered Cellulose Market Analysis - Size, Share, and Forecast Outlook 2025 to 2035
Powdered Soft Drinks Market Size and Share Forecast Outlook 2025 to 2035
Powder Packing Machine Market Size and Share Forecast Outlook 2025 to 2035
Yogurt Dips Market Size, Growth, and Forecast for 2025 to 2035
Yogurt Market Analysis - Size, Share, & Forecast Outlook 2025 to 2035
Powder Dispenser Market Analysis by Product Type, Size, Dispensing Mode, End-use Industry, and Region through 2025 to 2035
Korea Isomalt Industry – Market Trends & Industry Growth 2025 to 2035
Korea Probiotic Supplement Industry – Industry Insights & Demand 2025 to 2035
Korea Calcium Supplement Market is segmented by form,end-use, application and province through 2025 to 2035.

Thank you!
You will receive an email from our Business Development Manager. Please be sure to check your SPAM/JUNK folder too.
Chat With
MaRIA