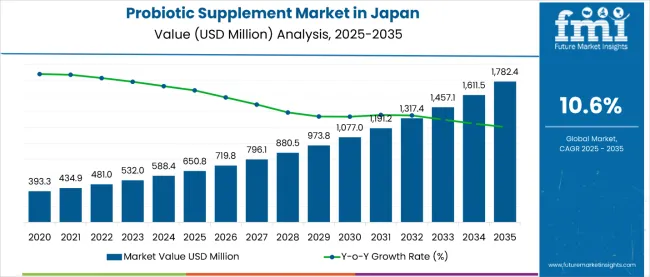
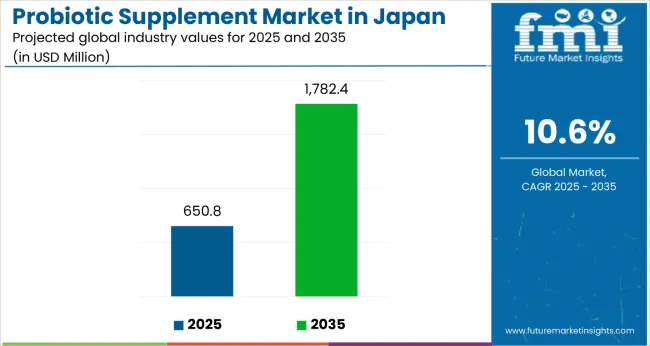
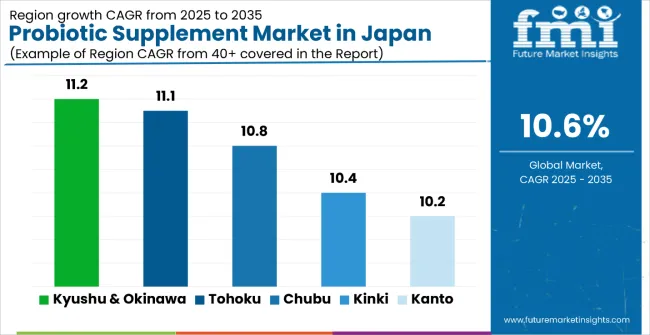
The probiotic supplement industry is anticipated to be worth USD 500.2 million in 2023. The probiotic supplement sales in Japan are on track to reach USD 1,367.4 million by 2033. From 2023 to 2033, the probiotic supplement sector in Japan is anticipated to expand at a notable CAGR of 10.6%.
Demand for probiotic supplement in Japan has increased due to consumers' growing health consciousness and familiarity with their advantages. The probiotic supplement demand in Japan is driven by numerous studies demonstrating probiotic supplementation's beneficial effects on the host. In response to consumer demand, manufacturers of probiotic supplement in Japan are launching cutting-edge supplement.
Determinants of Growth in Japan's Probiotic Supplement Sector
Attributes | Details |
---|---|
Demand Analysis (2023) | USD 500.2 million |
Demand Forecast (2033) | USD 1,367.4 million |
CAGR Estimation (2023 to 2033) | 10.6% |
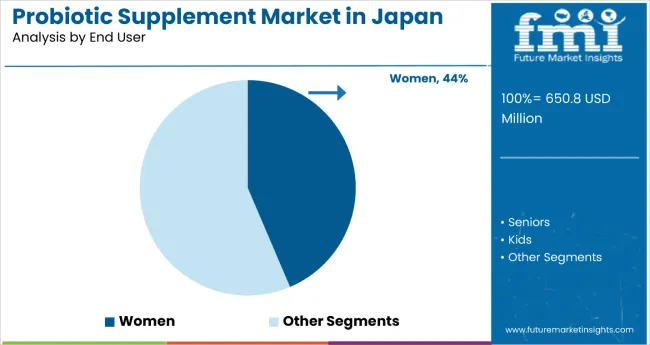
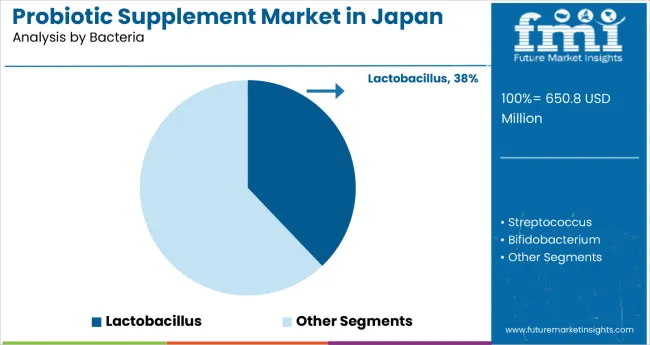
A thorough segmentation analysis of probiotic supplement in Japan is included in this section. The producers of probiotic supplement are closely monitoring market trends and the expanding demand in the women segment. Similarly, the lactobacillus segment outshines other bacteria type categories.
Segment | Women |
---|---|
Industry Share in 2023 | 43.6% |
Segment | Lactobacillus |
---|---|
Industry Share in 2023 | 37.9% |
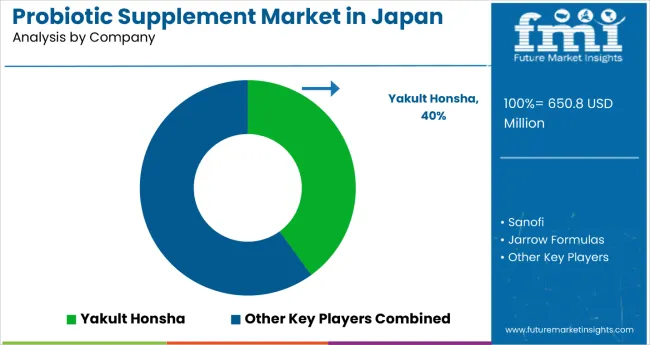
The probiotic supplement industry in Japan is staggeringly competitive. Emerging probiotic supplement manufacturers in Japan are expected to enter the probiotic sector as its popularity increases. Established probiotic supplement companies in Japan are likely to face fierce competition from this. Evolving Japanese probiotic supplement producers are trying to mimic the advertising and publicity campaigns carried out by industry titans.
Recent Developments Observed in Probiotic Supplement in Japan
Attribute | Details |
---|---|
Estimated Valuation (2023) | USD 500.2 million |
Projected Valuation (2033) | USD 1,367.4 million |
Anticipated CAGR (2023 to 2033) | 10.6% |
Historical Analysis of Probiotic Supplement in Japan | 2018 to 2022 |
Demand Forecast for Probiotic Supplement in Japan | 2023 to 2033 |
Quantitative Units | Revenue in USD million and CAGR from 2023 to 2033 |
Report Coverage | Revenue Forecast, Company Ranking, Competitive Landscape, Growth Factors, Trends and Pricing Analysis |
Key Companies Profiled for Probiotic Supplement in Japan | Meiji Holdings Co., Ltd.; Yakult Honsha Co., Ltd.; Morinaga Milk Industry Co., Ltd.; Suntory Holdings Limited; Eisai Co., Ltd. |
Table 1: Industry Analysis and Outlook Value (US$ Million) Forecast by Region, 2018 to 2033
Table 2: Industry Analysis and Outlook Volume (Tons) Forecast by Region, 2018 to 2033
Table 3: Industry Analysis and Outlook Value (US$ Million) Forecast by Bacteria, 2018 to 2033
Table 4: Industry Analysis and Outlook Volume (Tons) Forecast by Bacteria, 2018 to 2033
Table 5: Industry Analysis and Outlook Value (US$ Million) Forecast by Form, 2018 to 2033
Table 6: Industry Analysis and Outlook Volume (Tons) Forecast by Form, 2018 to 2033
Table 7: Industry Analysis and Outlook Value (US$ Million) Forecast by Function, 2018 to 2033
Table 8: Industry Analysis and Outlook Volume (Tons) Forecast by Function, 2018 to 2033
Table 9: Industry Analysis and Outlook Value (US$ Million) Forecast by Distribution Channel, 2018 to 2033
Table 10: Industry Analysis and Outlook Volume (Tons) Forecast by Distribution Channel, 2018 to 2033
Table 11: Industry Analysis and Outlook Value (US$ Million) Forecast by End User, 2018 to 2033
Table 12: Industry Analysis and Outlook Volume (Tons) Forecast by End User, 2018 to 2033
Table 13: Kanto Industry Analysis and Outlook Value (US$ Million) Forecast by Bacteria, 2018 to 2033
Table 14: Kanto Industry Analysis and Outlook Volume (Tons) Forecast by Bacteria, 2018 to 2033
Table 15: Kanto Industry Analysis and Outlook Value (US$ Million) Forecast by Form, 2018 to 2033
Table 16: Kanto Industry Analysis and Outlook Volume (Tons) Forecast by Form, 2018 to 2033
Table 17: Kanto Industry Analysis and Outlook Value (US$ Million) Forecast by Function, 2018 to 2033
Table 18: Kanto Industry Analysis and Outlook Volume (Tons) Forecast by Function, 2018 to 2033
Table 19: Kanto Industry Analysis and Outlook Value (US$ Million) Forecast by Distribution Channel, 2018 to 2033
Table 20: Kanto Industry Analysis and Outlook Volume (Tons) Forecast by Distribution Channel, 2018 to 2033
Table 21: Kanto Industry Analysis and Outlook Value (US$ Million) Forecast by End User, 2018 to 2033
Table 22: Kanto Industry Analysis and Outlook Volume (Tons) Forecast by End User, 2018 to 2033
Table 23: Chubu Industry Analysis and Outlook Value (US$ Million) Forecast by Bacteria, 2018 to 2033
Table 24: Chubu Industry Analysis and Outlook Volume (Tons) Forecast by Bacteria, 2018 to 2033
Table 25: Chubu Industry Analysis and Outlook Value (US$ Million) Forecast by Form, 2018 to 2033
Table 26: Chubu Industry Analysis and Outlook Volume (Tons) Forecast by Form, 2018 to 2033
Table 27: Chubu Industry Analysis and Outlook Value (US$ Million) Forecast by Function, 2018 to 2033
Table 28: Chubu Industry Analysis and Outlook Volume (Tons) Forecast by Function, 2018 to 2033
Table 29: Chubu Industry Analysis and Outlook Value (US$ Million) Forecast by Distribution Channel, 2018 to 2033
Table 30: Chubu Industry Analysis and Outlook Volume (Tons) Forecast by Distribution Channel, 2018 to 2033
Table 31: Chubu Industry Analysis and Outlook Value (US$ Million) Forecast by End User, 2018 to 2033
Table 32: Chubu Industry Analysis and Outlook Volume (Tons) Forecast by End User, 2018 to 2033
Table 33: Kinki Industry Analysis and Outlook Value (US$ Million) Forecast by Bacteria, 2018 to 2033
Table 34: Kinki Industry Analysis and Outlook Volume (Tons) Forecast by Bacteria, 2018 to 2033
Table 35: Kinki Industry Analysis and Outlook Value (US$ Million) Forecast by Form, 2018 to 2033
Table 36: Kinki Industry Analysis and Outlook Volume (Tons) Forecast by Form, 2018 to 2033
Table 37: Kinki Industry Analysis and Outlook Value (US$ Million) Forecast by Function, 2018 to 2033
Table 38: Kinki Industry Analysis and Outlook Volume (Tons) Forecast by Function, 2018 to 2033
Table 39: Kinki Industry Analysis and Outlook Value (US$ Million) Forecast by Distribution Channel, 2018 to 2033
Table 40: Kinki Industry Analysis and Outlook Volume (Tons) Forecast by Distribution Channel, 2018 to 2033
Table 41: Kinki Industry Analysis and Outlook Value (US$ Million) Forecast by End User, 2018 to 2033
Table 42: Kinki Industry Analysis and Outlook Volume (Tons) Forecast by End User, 2018 to 2033
Table 43: Kyushu & Okinawa Industry Analysis and Outlook Value (US$ Million) Forecast by Bacteria, 2018 to 2033
Table 44: Kyushu & Okinawa Industry Analysis and Outlook Volume (Tons) Forecast by Bacteria, 2018 to 2033
Table 45: Kyushu & Okinawa Industry Analysis and Outlook Value (US$ Million) Forecast by Form, 2018 to 2033
Table 46: Kyushu & Okinawa Industry Analysis and Outlook Volume (Tons) Forecast by Form, 2018 to 2033
Table 47: Kyushu & Okinawa Industry Analysis and Outlook Value (US$ Million) Forecast by Function, 2018 to 2033
Table 48: Kyushu & Okinawa Industry Analysis and Outlook Volume (Tons) Forecast by Function, 2018 to 2033
Table 49: Kyushu & Okinawa Industry Analysis and Outlook Value (US$ Million) Forecast by Distribution Channel, 2018 to 2033
Table 50: Kyushu & Okinawa Industry Analysis and Outlook Volume (Tons) Forecast by Distribution Channel, 2018 to 2033
Table 51: Kyushu & Okinawa Industry Analysis and Outlook Value (US$ Million) Forecast by End User, 2018 to 2033
Table 52: Kyushu & Okinawa Industry Analysis and Outlook Volume (Tons) Forecast by End User, 2018 to 2033
Table 53: Tohoku Industry Analysis and Outlook Value (US$ Million) Forecast by Bacteria, 2018 to 2033
Table 54: Tohoku Industry Analysis and Outlook Volume (Tons) Forecast by Bacteria, 2018 to 2033
Table 55: Tohoku Industry Analysis and Outlook Value (US$ Million) Forecast by Form, 2018 to 2033
Table 56: Tohoku Industry Analysis and Outlook Volume (Tons) Forecast by Form, 2018 to 2033
Table 57: Tohoku Industry Analysis and Outlook Value (US$ Million) Forecast by Function, 2018 to 2033
Table 58: Tohoku Industry Analysis and Outlook Volume (Tons) Forecast by Function, 2018 to 2033
Table 59: Tohoku Industry Analysis and Outlook Value (US$ Million) Forecast by Distribution Channel, 2018 to 2033
Table 60: Tohoku Industry Analysis and Outlook Volume (Tons) Forecast by Distribution Channel, 2018 to 2033
Table 61: Tohoku Industry Analysis and Outlook Value (US$ Million) Forecast by End User, 2018 to 2033
Table 62: Tohoku Industry Analysis and Outlook Volume (Tons) Forecast by End User, 2018 to 2033
Table 63: Rest of Industry Analysis and Outlook Value (US$ Million) Forecast by Bacteria, 2018 to 2033
Table 64: Rest of Industry Analysis and Outlook Volume (Tons) Forecast by Bacteria, 2018 to 2033
Table 65: Rest of Industry Analysis and Outlook Value (US$ Million) Forecast by Form, 2018 to 2033
Table 66: Rest of Industry Analysis and Outlook Volume (Tons) Forecast by Form, 2018 to 2033
Table 67: Rest of Industry Analysis and Outlook Value (US$ Million) Forecast by Function, 2018 to 2033
Table 68: Rest of Industry Analysis and Outlook Volume (Tons) Forecast by Function, 2018 to 2033
Table 69: Rest of Industry Analysis and Outlook Value (US$ Million) Forecast by Distribution Channel, 2018 to 2033
Table 70: Rest of Industry Analysis and Outlook Volume (Tons) Forecast by Distribution Channel, 2018 to 2033
Table 71: Rest of Industry Analysis and Outlook Value (US$ Million) Forecast by End User, 2018 to 2033
Table 72: Rest of Industry Analysis and Outlook Volume (Tons) Forecast by End User, 2018 to 2033
Figure 1: Industry Analysis and Outlook Value (US$ Million) by Bacteria, 2023 to 2033
Figure 2: Industry Analysis and Outlook Value (US$ Million) by Form, 2023 to 2033
Figure 3: Industry Analysis and Outlook Value (US$ Million) by Function, 2023 to 2033
Figure 4: Industry Analysis and Outlook Value (US$ Million) by Distribution Channel, 2023 to 2033
Figure 5: Industry Analysis and Outlook Value (US$ Million) by End User, 2023 to 2033
Figure 6: Industry Analysis and Outlook Value (US$ Million) by Region, 2023 to 2033
Figure 7: Industry Analysis and Outlook Value (US$ Million) Analysis by Region, 2018 to 2033
Figure 8: Industry Analysis and Outlook Volume (Tons) Analysis by Region, 2018 to 2033
Figure 9: Industry Analysis and Outlook Value Share (%) and BPS Analysis by Region, 2023 to 2033
Figure 10: Industry Analysis and Outlook Y-o-Y Growth (%) Projections by Region, 2023 to 2033
Figure 11: Industry Analysis and Outlook Value (US$ Million) Analysis by Bacteria, 2018 to 2033
Figure 12: Industry Analysis and Outlook Volume (Tons) Analysis by Bacteria, 2018 to 2033
Figure 13: Industry Analysis and Outlook Value Share (%) and BPS Analysis by Bacteria, 2023 to 2033
Figure 14: Industry Analysis and Outlook Y-o-Y Growth (%) Projections by Bacteria, 2023 to 2033
Figure 15: Industry Analysis and Outlook Value (US$ Million) Analysis by Form, 2018 to 2033
Figure 16: Industry Analysis and Outlook Volume (Tons) Analysis by Form, 2018 to 2033
Figure 17: Industry Analysis and Outlook Value Share (%) and BPS Analysis by Form, 2023 to 2033
Figure 18: Industry Analysis and Outlook Y-o-Y Growth (%) Projections by Form, 2023 to 2033
Figure 19: Industry Analysis and Outlook Value (US$ Million) Analysis by Function, 2018 to 2033
Figure 20: Industry Analysis and Outlook Volume (Tons) Analysis by Function, 2018 to 2033
Figure 21: Industry Analysis and Outlook Value Share (%) and BPS Analysis by Function, 2023 to 2033
Figure 22: Industry Analysis and Outlook Y-o-Y Growth (%) Projections by Function, 2023 to 2033
Figure 23: Industry Analysis and Outlook Value (US$ Million) Analysis by Distribution Channel, 2018 to 2033
Figure 24: Industry Analysis and Outlook Volume (Tons) Analysis by Distribution Channel, 2018 to 2033
Figure 25: Industry Analysis and Outlook Value Share (%) and BPS Analysis by Distribution Channel, 2023 to 2033
Figure 26: Industry Analysis and Outlook Y-o-Y Growth (%) Projections by Distribution Channel, 2023 to 2033
Figure 27: Industry Analysis and Outlook Value (US$ Million) Analysis by End User, 2018 to 2033
Figure 28: Industry Analysis and Outlook Volume (Tons) Analysis by End User, 2018 to 2033
Figure 29: Industry Analysis and Outlook Value Share (%) and BPS Analysis by End User, 2023 to 2033
Figure 30: Industry Analysis and Outlook Y-o-Y Growth (%) Projections by End User, 2023 to 2033
Figure 31: Industry Analysis and Outlook Attractiveness by Bacteria, 2023 to 2033
Figure 32: Industry Analysis and Outlook Attractiveness by Form, 2023 to 2033
Figure 33: Industry Analysis and Outlook Attractiveness by Function, 2023 to 2033
Figure 34: Industry Analysis and Outlook Attractiveness by Distribution Channel, 2023 to 2033
Figure 35: Industry Analysis and Outlook Attractiveness by End User, 2023 to 2033
Figure 36: Industry Analysis and Outlook Attractiveness by Region, 2023 to 2033
Figure 37: Kanto Industry Analysis and Outlook Value (US$ Million) by Bacteria, 2023 to 2033
Figure 38: Kanto Industry Analysis and Outlook Value (US$ Million) by Form, 2023 to 2033
Figure 39: Kanto Industry Analysis and Outlook Value (US$ Million) by Function, 2023 to 2033
Figure 40: Kanto Industry Analysis and Outlook Value (US$ Million) by Distribution Channel, 2023 to 2033
Figure 41: Kanto Industry Analysis and Outlook Value (US$ Million) by End User, 2023 to 2033
Figure 42: Kanto Industry Analysis and Outlook Value (US$ Million) Analysis by Bacteria, 2018 to 2033
Figure 43: Kanto Industry Analysis and Outlook Volume (Tons) Analysis by Bacteria, 2018 to 2033
Figure 44: Kanto Industry Analysis and Outlook Value Share (%) and BPS Analysis by Bacteria, 2023 to 2033
Figure 45: Kanto Industry Analysis and Outlook Y-o-Y Growth (%) Projections by Bacteria, 2023 to 2033
Figure 46: Kanto Industry Analysis and Outlook Value (US$ Million) Analysis by Form, 2018 to 2033
Figure 47: Kanto Industry Analysis and Outlook Volume (Tons) Analysis by Form, 2018 to 2033
Figure 48: Kanto Industry Analysis and Outlook Value Share (%) and BPS Analysis by Form, 2023 to 2033
Figure 49: Kanto Industry Analysis and Outlook Y-o-Y Growth (%) Projections by Form, 2023 to 2033
Figure 50: Kanto Industry Analysis and Outlook Value (US$ Million) Analysis by Function, 2018 to 2033
Figure 51: Kanto Industry Analysis and Outlook Volume (Tons) Analysis by Function, 2018 to 2033
Figure 52: Kanto Industry Analysis and Outlook Value Share (%) and BPS Analysis by Function, 2023 to 2033
Figure 53: Kanto Industry Analysis and Outlook Y-o-Y Growth (%) Projections by Function, 2023 to 2033
Figure 54: Kanto Industry Analysis and Outlook Value (US$ Million) Analysis by Distribution Channel, 2018 to 2033
Figure 55: Kanto Industry Analysis and Outlook Volume (Tons) Analysis by Distribution Channel, 2018 to 2033
Figure 56: Kanto Industry Analysis and Outlook Value Share (%) and BPS Analysis by Distribution Channel, 2023 to 2033
Figure 57: Kanto Industry Analysis and Outlook Y-o-Y Growth (%) Projections by Distribution Channel, 2023 to 2033
Figure 58: Kanto Industry Analysis and Outlook Value (US$ Million) Analysis by End User, 2018 to 2033
Figure 59: Kanto Industry Analysis and Outlook Volume (Tons) Analysis by End User, 2018 to 2033
Figure 60: Kanto Industry Analysis and Outlook Value Share (%) and BPS Analysis by End User, 2023 to 2033
Figure 61: Kanto Industry Analysis and Outlook Y-o-Y Growth (%) Projections by End User, 2023 to 2033
Figure 62: Kanto Industry Analysis and Outlook Attractiveness by Bacteria, 2023 to 2033
Figure 63: Kanto Industry Analysis and Outlook Attractiveness by Form, 2023 to 2033
Figure 64: Kanto Industry Analysis and Outlook Attractiveness by Function, 2023 to 2033
Figure 65: Kanto Industry Analysis and Outlook Attractiveness by Distribution Channel, 2023 to 2033
Figure 66: Kanto Industry Analysis and Outlook Attractiveness by End User, 2023 to 2033
Figure 67: Chubu Industry Analysis and Outlook Value (US$ Million) by Bacteria, 2023 to 2033
Figure 68: Chubu Industry Analysis and Outlook Value (US$ Million) by Form, 2023 to 2033
Figure 69: Chubu Industry Analysis and Outlook Value (US$ Million) by Function, 2023 to 2033
Figure 70: Chubu Industry Analysis and Outlook Value (US$ Million) by Distribution Channel, 2023 to 2033
Figure 71: Chubu Industry Analysis and Outlook Value (US$ Million) by End User, 2023 to 2033
Figure 72: Chubu Industry Analysis and Outlook Value (US$ Million) Analysis by Bacteria, 2018 to 2033
Figure 73: Chubu Industry Analysis and Outlook Volume (Tons) Analysis by Bacteria, 2018 to 2033
Figure 74: Chubu Industry Analysis and Outlook Value Share (%) and BPS Analysis by Bacteria, 2023 to 2033
Figure 75: Chubu Industry Analysis and Outlook Y-o-Y Growth (%) Projections by Bacteria, 2023 to 2033
Figure 76: Chubu Industry Analysis and Outlook Value (US$ Million) Analysis by Form, 2018 to 2033
Figure 77: Chubu Industry Analysis and Outlook Volume (Tons) Analysis by Form, 2018 to 2033
Figure 78: Chubu Industry Analysis and Outlook Value Share (%) and BPS Analysis by Form, 2023 to 2033
Figure 79: Chubu Industry Analysis and Outlook Y-o-Y Growth (%) Projections by Form, 2023 to 2033
Figure 80: Chubu Industry Analysis and Outlook Value (US$ Million) Analysis by Function, 2018 to 2033
Figure 81: Chubu Industry Analysis and Outlook Volume (Tons) Analysis by Function, 2018 to 2033
Figure 82: Chubu Industry Analysis and Outlook Value Share (%) and BPS Analysis by Function, 2023 to 2033
Figure 83: Chubu Industry Analysis and Outlook Y-o-Y Growth (%) Projections by Function, 2023 to 2033
Figure 84: Chubu Industry Analysis and Outlook Value (US$ Million) Analysis by Distribution Channel, 2018 to 2033
Figure 85: Chubu Industry Analysis and Outlook Volume (Tons) Analysis by Distribution Channel, 2018 to 2033
Figure 86: Chubu Industry Analysis and Outlook Value Share (%) and BPS Analysis by Distribution Channel, 2023 to 2033
Figure 87: Chubu Industry Analysis and Outlook Y-o-Y Growth (%) Projections by Distribution Channel, 2023 to 2033
Figure 88: Chubu Industry Analysis and Outlook Value (US$ Million) Analysis by End User, 2018 to 2033
Figure 89: Chubu Industry Analysis and Outlook Volume (Tons) Analysis by End User, 2018 to 2033
Figure 90: Chubu Industry Analysis and Outlook Value Share (%) and BPS Analysis by End User, 2023 to 2033
Figure 91: Chubu Industry Analysis and Outlook Y-o-Y Growth (%) Projections by End User, 2023 to 2033
Figure 92: Chubu Industry Analysis and Outlook Attractiveness by Bacteria, 2023 to 2033
Figure 93: Chubu Industry Analysis and Outlook Attractiveness by Form, 2023 to 2033
Figure 94: Chubu Industry Analysis and Outlook Attractiveness by Function, 2023 to 2033
Figure 95: Chubu Industry Analysis and Outlook Attractiveness by Distribution Channel, 2023 to 2033
Figure 96: Chubu Industry Analysis and Outlook Attractiveness by End User, 2023 to 2033
Figure 97: Kinki Industry Analysis and Outlook Value (US$ Million) by Bacteria, 2023 to 2033
Figure 98: Kinki Industry Analysis and Outlook Value (US$ Million) by Form, 2023 to 2033
Figure 99: Kinki Industry Analysis and Outlook Value (US$ Million) by Function, 2023 to 2033
Figure 100: Kinki Industry Analysis and Outlook Value (US$ Million) by Distribution Channel, 2023 to 2033
Figure 101: Kinki Industry Analysis and Outlook Value (US$ Million) by End User, 2023 to 2033
Figure 102: Kinki Industry Analysis and Outlook Value (US$ Million) Analysis by Bacteria, 2018 to 2033
Figure 103: Kinki Industry Analysis and Outlook Volume (Tons) Analysis by Bacteria, 2018 to 2033
Figure 104: Kinki Industry Analysis and Outlook Value Share (%) and BPS Analysis by Bacteria, 2023 to 2033
Figure 105: Kinki Industry Analysis and Outlook Y-o-Y Growth (%) Projections by Bacteria, 2023 to 2033
Figure 106: Kinki Industry Analysis and Outlook Value (US$ Million) Analysis by Form, 2018 to 2033
Figure 107: Kinki Industry Analysis and Outlook Volume (Tons) Analysis by Form, 2018 to 2033
Figure 108: Kinki Industry Analysis and Outlook Value Share (%) and BPS Analysis by Form, 2023 to 2033
Figure 109: Kinki Industry Analysis and Outlook Y-o-Y Growth (%) Projections by Form, 2023 to 2033
Figure 110: Kinki Industry Analysis and Outlook Value (US$ Million) Analysis by Function, 2018 to 2033
Figure 111: Kinki Industry Analysis and Outlook Volume (Tons) Analysis by Function, 2018 to 2033
Figure 112: Kinki Industry Analysis and Outlook Value Share (%) and BPS Analysis by Function, 2023 to 2033
Figure 113: Kinki Industry Analysis and Outlook Y-o-Y Growth (%) Projections by Function, 2023 to 2033
Figure 114: Kinki Industry Analysis and Outlook Value (US$ Million) Analysis by Distribution Channel, 2018 to 2033
Figure 115: Kinki Industry Analysis and Outlook Volume (Tons) Analysis by Distribution Channel, 2018 to 2033
Figure 116: Kinki Industry Analysis and Outlook Value Share (%) and BPS Analysis by Distribution Channel, 2023 to 2033
Figure 117: Kinki Industry Analysis and Outlook Y-o-Y Growth (%) Projections by Distribution Channel, 2023 to 2033
Figure 118: Kinki Industry Analysis and Outlook Value (US$ Million) Analysis by End User, 2018 to 2033
Figure 119: Kinki Industry Analysis and Outlook Volume (Tons) Analysis by End User, 2018 to 2033
Figure 120: Kinki Industry Analysis and Outlook Value Share (%) and BPS Analysis by End User, 2023 to 2033
Figure 121: Kinki Industry Analysis and Outlook Y-o-Y Growth (%) Projections by End User, 2023 to 2033
Figure 122: Kinki Industry Analysis and Outlook Attractiveness by Bacteria, 2023 to 2033
Figure 123: Kinki Industry Analysis and Outlook Attractiveness by Form, 2023 to 2033
Figure 124: Kinki Industry Analysis and Outlook Attractiveness by Function, 2023 to 2033
Figure 125: Kinki Industry Analysis and Outlook Attractiveness by Distribution Channel, 2023 to 2033
Figure 126: Kinki Industry Analysis and Outlook Attractiveness by End User, 2023 to 2033
Figure 127: Kyushu & Okinawa Industry Analysis and Outlook Value (US$ Million) by Bacteria, 2023 to 2033
Figure 128: Kyushu & Okinawa Industry Analysis and Outlook Value (US$ Million) by Form, 2023 to 2033
Figure 129: Kyushu & Okinawa Industry Analysis and Outlook Value (US$ Million) by Function, 2023 to 2033
Figure 130: Kyushu & Okinawa Industry Analysis and Outlook Value (US$ Million) by Distribution Channel, 2023 to 2033
Figure 131: Kyushu & Okinawa Industry Analysis and Outlook Value (US$ Million) by End User, 2023 to 2033
Figure 132: Kyushu & Okinawa Industry Analysis and Outlook Value (US$ Million) Analysis by Bacteria, 2018 to 2033
Figure 133: Kyushu & Okinawa Industry Analysis and Outlook Volume (Tons) Analysis by Bacteria, 2018 to 2033
Figure 134: Kyushu & Okinawa Industry Analysis and Outlook Value Share (%) and BPS Analysis by Bacteria, 2023 to 2033
Figure 135: Kyushu & Okinawa Industry Analysis and Outlook Y-o-Y Growth (%) Projections by Bacteria, 2023 to 2033
Figure 136: Kyushu & Okinawa Industry Analysis and Outlook Value (US$ Million) Analysis by Form, 2018 to 2033
Figure 137: Kyushu & Okinawa Industry Analysis and Outlook Volume (Tons) Analysis by Form, 2018 to 2033
Figure 138: Kyushu & Okinawa Industry Analysis and Outlook Value Share (%) and BPS Analysis by Form, 2023 to 2033
Figure 139: Kyushu & Okinawa Industry Analysis and Outlook Y-o-Y Growth (%) Projections by Form, 2023 to 2033
Figure 140: Kyushu & Okinawa Industry Analysis and Outlook Value (US$ Million) Analysis by Function, 2018 to 2033
Figure 141: Kyushu & Okinawa Industry Analysis and Outlook Volume (Tons) Analysis by Function, 2018 to 2033
Figure 142: Kyushu & Okinawa Industry Analysis and Outlook Value Share (%) and BPS Analysis by Function, 2023 to 2033
Figure 143: Kyushu & Okinawa Industry Analysis and Outlook Y-o-Y Growth (%) Projections by Function, 2023 to 2033
Figure 144: Kyushu & Okinawa Industry Analysis and Outlook Value (US$ Million) Analysis by Distribution Channel, 2018 to 2033
Figure 145: Kyushu & Okinawa Industry Analysis and Outlook Volume (Tons) Analysis by Distribution Channel, 2018 to 2033
Figure 146: Kyushu & Okinawa Industry Analysis and Outlook Value Share (%) and BPS Analysis by Distribution Channel, 2023 to 2033
Figure 147: Kyushu & Okinawa Industry Analysis and Outlook Y-o-Y Growth (%) Projections by Distribution Channel, 2023 to 2033
Figure 148: Kyushu & Okinawa Industry Analysis and Outlook Value (US$ Million) Analysis by End User, 2018 to 2033
Figure 149: Kyushu & Okinawa Industry Analysis and Outlook Volume (Tons) Analysis by End User, 2018 to 2033
Figure 150: Kyushu & Okinawa Industry Analysis and Outlook Value Share (%) and BPS Analysis by End User, 2023 to 2033
Figure 151: Kyushu & Okinawa Industry Analysis and Outlook Y-o-Y Growth (%) Projections by End User, 2023 to 2033
Figure 152: Kyushu & Okinawa Industry Analysis and Outlook Attractiveness by Bacteria, 2023 to 2033
Figure 153: Kyushu & Okinawa Industry Analysis and Outlook Attractiveness by Form, 2023 to 2033
Figure 154: Kyushu & Okinawa Industry Analysis and Outlook Attractiveness by Function, 2023 to 2033
Figure 155: Kyushu & Okinawa Industry Analysis and Outlook Attractiveness by Distribution Channel, 2023 to 2033
Figure 156: Kyushu & Okinawa Industry Analysis and Outlook Attractiveness by End User, 2023 to 2033
Figure 157: Tohoku Industry Analysis and Outlook Value (US$ Million) by Bacteria, 2023 to 2033
Figure 158: Tohoku Industry Analysis and Outlook Value (US$ Million) by Form, 2023 to 2033
Figure 159: Tohoku Industry Analysis and Outlook Value (US$ Million) by Function, 2023 to 2033
Figure 160: Tohoku Industry Analysis and Outlook Value (US$ Million) by Distribution Channel, 2023 to 2033
Figure 161: Tohoku Industry Analysis and Outlook Value (US$ Million) by End User, 2023 to 2033
Figure 162: Tohoku Industry Analysis and Outlook Value (US$ Million) Analysis by Bacteria, 2018 to 2033
Figure 163: Tohoku Industry Analysis and Outlook Volume (Tons) Analysis by Bacteria, 2018 to 2033
Figure 164: Tohoku Industry Analysis and Outlook Value Share (%) and BPS Analysis by Bacteria, 2023 to 2033
Figure 165: Tohoku Industry Analysis and Outlook Y-o-Y Growth (%) Projections by Bacteria, 2023 to 2033
Figure 166: Tohoku Industry Analysis and Outlook Value (US$ Million) Analysis by Form, 2018 to 2033
Figure 167: Tohoku Industry Analysis and Outlook Volume (Tons) Analysis by Form, 2018 to 2033
Figure 168: Tohoku Industry Analysis and Outlook Value Share (%) and BPS Analysis by Form, 2023 to 2033
Figure 169: Tohoku Industry Analysis and Outlook Y-o-Y Growth (%) Projections by Form, 2023 to 2033
Figure 170: Tohoku Industry Analysis and Outlook Value (US$ Million) Analysis by Function, 2018 to 2033
Figure 171: Tohoku Industry Analysis and Outlook Volume (Tons) Analysis by Function, 2018 to 2033
Figure 172: Tohoku Industry Analysis and Outlook Value Share (%) and BPS Analysis by Function, 2023 to 2033
Figure 173: Tohoku Industry Analysis and Outlook Y-o-Y Growth (%) Projections by Function, 2023 to 2033
Figure 174: Tohoku Industry Analysis and Outlook Value (US$ Million) Analysis by Distribution Channel, 2018 to 2033
Figure 175: Tohoku Industry Analysis and Outlook Volume (Tons) Analysis by Distribution Channel, 2018 to 2033
Figure 176: Tohoku Industry Analysis and Outlook Value Share (%) and BPS Analysis by Distribution Channel, 2023 to 2033
Figure 177: Tohoku Industry Analysis and Outlook Y-o-Y Growth (%) Projections by Distribution Channel, 2023 to 2033
Figure 178: Tohoku Industry Analysis and Outlook Value (US$ Million) Analysis by End User, 2018 to 2033
Figure 179: Tohoku Industry Analysis and Outlook Volume (Tons) Analysis by End User, 2018 to 2033
Figure 180: Tohoku Industry Analysis and Outlook Value Share (%) and BPS Analysis by End User, 2023 to 2033
Figure 181: Tohoku Industry Analysis and Outlook Y-o-Y Growth (%) Projections by End User, 2023 to 2033
Figure 182: Tohoku Industry Analysis and Outlook Attractiveness by Bacteria, 2023 to 2033
Figure 183: Tohoku Industry Analysis and Outlook Attractiveness by Form, 2023 to 2033
Figure 184: Tohoku Industry Analysis and Outlook Attractiveness by Function, 2023 to 2033
Figure 185: Tohoku Industry Analysis and Outlook Attractiveness by Distribution Channel, 2023 to 2033
Figure 186: Tohoku Industry Analysis and Outlook Attractiveness by End User, 2023 to 2033
Figure 187: Rest of Industry Analysis and Outlook Value (US$ Million) by Bacteria, 2023 to 2033
Figure 188: Rest of Industry Analysis and Outlook Value (US$ Million) by Form, 2023 to 2033
Figure 189: Rest of Industry Analysis and Outlook Value (US$ Million) by Function, 2023 to 2033
Figure 190: Rest of Industry Analysis and Outlook Value (US$ Million) by Distribution Channel, 2023 to 2033
Figure 191: Rest of Industry Analysis and Outlook Value (US$ Million) by End User, 2023 to 2033
Figure 192: Rest of Industry Analysis and Outlook Value (US$ Million) Analysis by Bacteria, 2018 to 2033
Figure 193: Rest of Industry Analysis and Outlook Volume (Tons) Analysis by Bacteria, 2018 to 2033
Figure 194: Rest of Industry Analysis and Outlook Value Share (%) and BPS Analysis by Bacteria, 2023 to 2033
Figure 195: Rest of Industry Analysis and Outlook Y-o-Y Growth (%) Projections by Bacteria, 2023 to 2033
Figure 196: Rest of Industry Analysis and Outlook Value (US$ Million) Analysis by Form, 2018 to 2033
Figure 197: Rest of Industry Analysis and Outlook Volume (Tons) Analysis by Form, 2018 to 2033
Figure 198: Rest of Industry Analysis and Outlook Value Share (%) and BPS Analysis by Form, 2023 to 2033
Figure 199: Rest of Industry Analysis and Outlook Y-o-Y Growth (%) Projections by Form, 2023 to 2033
Figure 200: Rest of Industry Analysis and Outlook Value (US$ Million) Analysis by Function, 2018 to 2033
Figure 201: Rest of Industry Analysis and Outlook Volume (Tons) Analysis by Function, 2018 to 2033
Figure 202: Rest of Industry Analysis and Outlook Value Share (%) and BPS Analysis by Function, 2023 to 2033
Figure 203: Rest of Industry Analysis and Outlook Y-o-Y Growth (%) Projections by Function, 2023 to 2033
Figure 204: Rest of Industry Analysis and Outlook Value (US$ Million) Analysis by Distribution Channel, 2018 to 2033
Figure 205: Rest of Industry Analysis and Outlook Volume (Tons) Analysis by Distribution Channel, 2018 to 2033
Figure 206: Rest of Industry Analysis and Outlook Value Share (%) and BPS Analysis by Distribution Channel, 2023 to 2033
Figure 207: Rest of Industry Analysis and Outlook Y-o-Y Growth (%) Projections by Distribution Channel, 2023 to 2033
Figure 208: Rest of Industry Analysis and Outlook Value (US$ Million) Analysis by End User, 2018 to 2033
Figure 209: Rest of Industry Analysis and Outlook Volume (Tons) Analysis by End User, 2018 to 2033
Figure 210: Rest of Industry Analysis and Outlook Value Share (%) and BPS Analysis by End User, 2023 to 2033
Figure 211: Rest of Industry Analysis and Outlook Y-o-Y Growth (%) Projections by End User, 2023 to 2033
Figure 212: Rest of Industry Analysis and Outlook Attractiveness by Bacteria, 2023 to 2033
Figure 213: Rest of Industry Analysis and Outlook Attractiveness by Form, 2023 to 2033
Figure 214: Rest of Industry Analysis and Outlook Attractiveness by Function, 2023 to 2033
Figure 215: Rest of Industry Analysis and Outlook Attractiveness by Distribution Channel, 2023 to 2033
Figure 216: Rest of Industry Analysis and Outlook Attractiveness by End User, 2023 to 2033
The sales of probiotic supplement in Japan were valued at USD 453.4 million in 2022.
The market value of probiotic supplement in Japan is set to reach USD 500.2 million in 2023.
The demand for probiotic supplement in Japan is anticipated to rise at 10.6% CAGR from 2023 to 2033.
The Japan market size for probiotic supplement is set to reach USD 1,367.4 million by 2033.
The women segment is expected to dominate the probiotic supplement industry with a share of 43.6% in 2023.
The HCAGR of sales of probiotic supplement in Japan was 9.4% between 2018 and 2022.
Explore Food Supplement and Nutrition Insights
Thank you!
You will receive an email from our Business Development Manager. Please be sure to check your SPAM/JUNK folder too.