The Japan weight loss supplements demand is valued at USD 240.9 million in 2025 and is projected to reach USD 662.7 million by 2035, supported by a CAGR of 10.7%. Demand is driven by wider use of nutraceutical products that support metabolic balance, calorie management, and structured weight-control routines. Supplement adoption is shaped by increased interest in lifestyle-oriented health products, steady participation in fitness programs, and broader retail availability of formulations positioned for daily use. Weight-management products remain integrated into vitamin stores, pharmacies, digital marketplaces, and direct-selling networks.
Vitamin-based supplements form the leading type. Their use in metabolism support, micronutrient replenishment, and general health maintenance contributes to consistent purchasing across varied age groups. These formulations often combine vitamins with plant extracts, amino acids, and fibre blends, allowing manufacturers to provide multi-function products suited to routine consumption. Their stable formulation profiles and compatibility with capsule, powder, and drink formats strengthen their position within the supplement category.
Kyushu & Okinawa, Kanto, and Kinki register the strongest demand. These regions exhibit high urban concentration, established fitness participation, and strong retail penetration for nutritional products. Supplement producers and contract manufacturers located in these areas further support local distribution and product availability. Amway Corporation, Herbalife Nutrition, GNC, Fermentis Life Sciences, Glanbia Performance Nutrition Inc., and Ajinomoto Health & Nutrition are the principal suppliers. Their portfolios include vitamin-based weight-management formulations, functional blends for metabolic support, and targeted nutritional products developed for structured dietary routines.

Breakpoint analysis indicates two structural shifts across the forecast horizon. The first breakpoint is expected between 2026 and 2028, when consumer adoption accelerates due to rising interest in metabolic-support products, wider promotion of plant-based formulations, and increased use of supplements alongside structured diet and fitness programmes. During this phase, manufacturers expand product lines featuring green-tea extracts, enzyme blends, and probiotic-linked weight-management formulations, creating a distinct early uplift.
A second breakpoint emerges between 2030 and 2032 as the segment transitions from rapid expansion to more predictable growth. By this stage, leading retailers and online platforms will have established stable portfolios, and regulatory clarity surrounding claims and permissible ingredients is likely to streamline product offerings. Growth becomes steadier as procurement centres on established formulations supported by documented safety profiles. Late-period gains arise from incremental improvements in efficacy research, broader use of personalised supplementation tools, and consistent integration of weight-management products in Japan’s wellness retail ecosystem. The breakpoint pattern reflects early demand expansion followed by a mature, regulation-aligned growth phase shaped by routine consumer adoption.
| Metric | Value |
|---|---|
| Japan Weight Loss Supplements Sales Value (2025) | USD 240.9 million |
| Japan Weight Loss Supplements Forecast Value (2035) | USD 662.7 million |
| Japan Weight Loss Supplements Forecast CAGR (2025 to 2035) | 10.7% |
The industry for weight-loss supplements in Japan is expanding as consumers face rising lifestyle-related health challenges such as decreased physical activity, imbalanced diets and age-related metabolic decline. Urban professionals and older adults increasingly seek convenient nutritional supports to manage weight and associated conditions such as diabetes or hypertension. Innovation in functional ingredients, including botanical extracts, amino acids and metabolism-targeting formulations aligns with Japanese consumer preference for products that combine natural origin, scientific backing and tailored health benefits.
E-commerce and retail channels, including specialised health-food stores, enhance availability and encourage recurring purchase behaviours. Challenges include heavy regulatory scrutiny of claims made by weight-loss products, high competition among established brands and imported lines and consumer caution about side-effects and ingredient safety. The premium pricing of advanced formulations may also limit uptake among cost-sensitive segments.
Demand for weight-loss supplements in Japan reflects product preferences shaped by dietary habits, functional-ingredient familiarity, and delivery-format convenience. Type distribution highlights reliance on vitamins, minerals, proteins, amino acids, and botanical extracts selected for metabolic support or nutrient balance. Form-type preferences correspond to storage stability, daily-intake convenience, and product-mix strategies across wellness consumers. End-use patterns show how different age groups participate in weight-management routines with varied supplement-use frequencies.
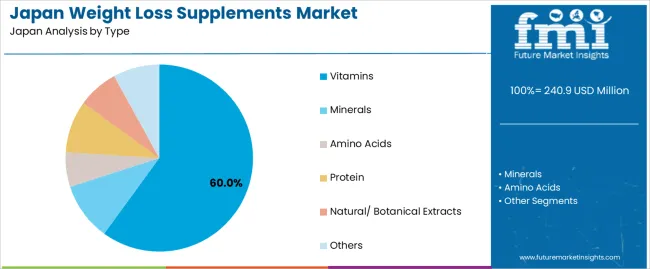
Vitamin-based supplements hold 60.0% of national demand and represent the leading type category. These products support metabolic balance, energy regulation, and diet-related nutrient replenishment, making them widely used in structured weight-management routines. Mineral-based products account for 10.0%, supporting micronutrient recovery and fluid-balance functions. Protein accounts for 9.0%, aiding satiety and muscle-maintenance needs during calorie-deficit diets. Natural and botanical extracts hold 7.0%, offering plant-derived functional ingredients. Amino acids represent 6.0%, while other formulations account for 8.0%, including blended functional mixes. Type distribution reflects dietary practices, ingredient familiarity, and safety considerations guiding Japanese consumer preferences for weight-management support.
Key drivers and attributes:
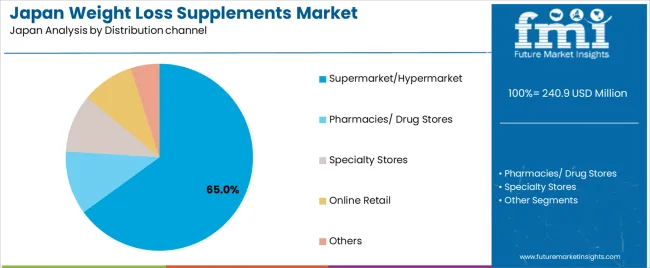
Powder formats hold 65.0% of national demand and represent the dominant form used in weight-management routines. Powders support customisable dosing, easy mixing with beverages, and predictable absorption patterns, aligning with meal-replacement and fitness-oriented consumption. Capsules account for 11.0%, serving users seeking precise dosages and simplified intake. Tablets represent 10.6%, supporting stable shelf life and structured formulations. Liquid formats account for 9.0%, used in ready-to-consume functional beverages. Other forms represent 4.4%, covering chews, sachets, and blended delivery systems. Form-type distribution reflects convenience, formulation stability, flavour adaptability, and consumer familiarity across Japan’s supplement-use practices.
Key drivers and attributes:
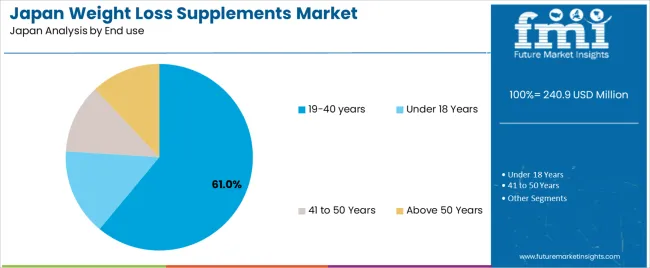
Individuals aged 19-40 years hold 61.0% of national demand and represent the leading end-use category. This group uses supplements to support structured fitness routines, weight-management goals, and lifestyle-related diet practices. Users under 18 years represent 15.0%, often engaging in supervised or low-intensity supplement intake. The 41–50 year segment accounts for 12.0%, using supplements for metabolic regulation and gradual weight control. Individuals aged above 50 years also represent 12.0%, supporting age-related metabolic changes and nutritional needs. End-use distribution reflects lifestyle variation, health priorities, and nutritional awareness across age groups in Japan’s weight-management landscape.
Key drivers and attributes:
Growing health-and-wellness orientation, ageing population metabolism concerns, and rising urban stress/lifestyle factors are driving demand.
In Japan, demand for weight-loss supplements is increasing as consumers become more aware of lifestyle-disease risk, metabolic slowdown associated with ageing, and the importance of maintaining healthy body weight. Urban lifestyles with busy schedules and reduced physical activity prompt supplement use to support dieting and nutritional goals. Health food culture in Japan encourages blending scientific ingredients (such as plant extracts, fibre blends, and thermogenic compounds) with functional food formats, which increases uptake of weight-loss supplement products across adult segments. The growth of e-commerce platforms and supplement subscription models further supports access and repeat usage.
Regulatory caution, cultural attitudes toward dieting and risk of ineffective products restrain adoption.
Japanese regulatory frameworks for food-supplements and “foods with function claims” require careful substantiation of weight-management effects, which slows product launch and drives higher compliance cost. Consumers may prefer moderate lifestyle changes over aggressive weight-loss supplements due to cultural preferences for subtle, sustained change rather than dramatic results, which limits industry novelty. Some consumer skepticism around supplement effectiveness and concerns about side effects may reduce trial and repeat purchase.
Trend toward combination formulations, increased personalised nutrition approaches and stronger e-commerce/influencer-driven marketing define industry trends.
Weight-loss supplements in Japan are evolving toward multi-ingredient blends that combine metabolism-support, appetite-control, gut-health and micronutrient optimisation in one product. Personalised nutrition platforms, including DNA-based or microbiome-based assessments, are influencing tailored supplement offerings for weight-management. Online sales, influencer marketing and social-media communities focused on wellness and body composure are driving product awareness and engagement among younger consumers. These shifts suggest steady demand for weight-loss supplements with higher standards of efficacy and targeted positioning.
Demand for weight loss supplements in Japan is rising through 2035 as consumers adopt structured weight-management routines supported by functional ingredients, metabolism-support blends, and plant-based formulations. Growth is influenced by increasing interest in preventive health, rising engagement with exercise programs, and strong retail expansion across pharmacies and e-commerce platforms.
Brands introduce products containing green tea extract, probiotics, fibers, amino acids, and botanical blends tailored for daily use. Younger consumers favor convenient drink mixes and gummies, while older segments prefer capsules and controlled-dose tablets. Regional variation reflects lifestyle patterns, income levels, and supplement availability. Kyushu & Okinawa lead with 13.3%, followed by Kanto (12.2%), Kinki (10.8%), Chubu (9.5%), Tohoku (8.3%), and the Rest of Japan (7.9%).
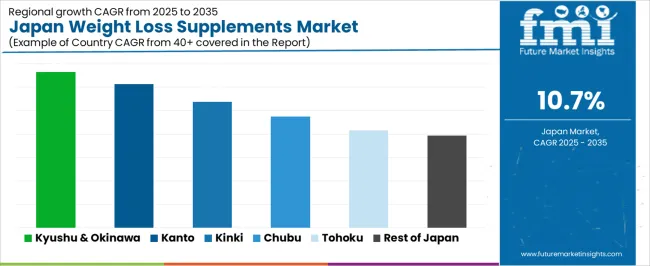
| Region | CAGR (2025-2035) |
|---|---|
| Kyushu & Okinawa | 13.3% |
| Kanto | 12.2% |
| Kinki | 10.8% |
| Chubu | 9.5% |
| Tohoku | 8.3% |
| Rest of Japan | 7.9% |
Kyushu & Okinawa grow at 13.3% CAGR, supported by active wellness participation, strong regional supplement distribution, and expanding consumer adoption of functional formulations. Pharmacies and specialty stores across Fukuoka, Kumamoto, and Kagoshima promote weight-management products containing metabolic enhancers and gut-health blends. Wellness centers and fitness studios incorporate supplement guidance into membership programs, encouraging daily use. Tourists visiting Okinawa’s wellness resorts encounter plant-based supplement offerings that strengthen regional awareness. Local manufacturers introduce formulations using fermented ingredients aligned with regional dietary habits. High consumer interest in lifestyle-oriented health routines supports continued adoption.
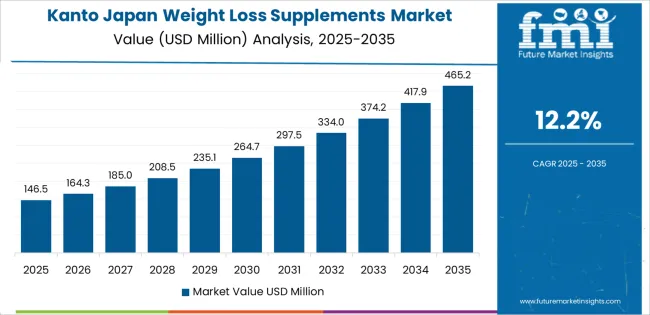
Kanto grows at 12.2% CAGR, driven by dense urban populations, strong e-commerce activity, and high engagement with structured fitness routines across Tokyo, Kanagawa, and Saitama. Consumers adopt weight loss supplements to support calorie-controlled diets, gym programs, and home-based exercise schedules. Online platforms promote metabolism-support capsules, probiotic blends, and fiber-rich formulations. Beauty and health retailers position weight-management products alongside collagen, vitamins, and detox supplements, increasing cross-category adoption. R&D centers in Tokyo support development of new botanical and fermentation-derived ingredients. High health-awareness levels maintain strong regional demand.
Kinki grows at 10.8% CAGR, supported by wellness-focused consumers, active gym culture, and expanding supplement shelves across Osaka, Kyoto, and Hyogo. Retail pharmacies offer weight loss supplements targeting calorie control, appetite management, and metabolic balance. Fitness centers promote supplement use alongside structured training plans. Local manufacturers produce drink-mix powders and convenient sachets suited to busy consumer routines. Skincare and beauty stores increasingly highlight weight-management products due to their overlap with broader wellness trends. Moderate urban density and high lifestyle awareness maintain steady adoption.
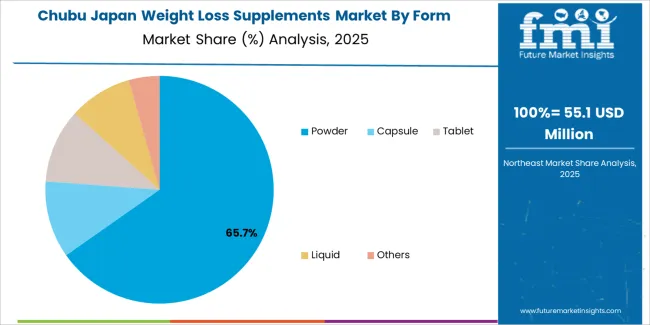
Chubu grows at 9.5% CAGR, shaped by growing interest in functional nutrition, moderate fitness engagement, and strong manufacturing capabilities across Aichi, Shizuoka, and Gifu. Consumers adopt supplements that support daily metabolism, digestive health, and fat-utilization pathways. Regional manufacturers produce capsules, tablets, and powdered blends tailored for clean-label preferences. Pharmacies promote formulations containing green tea extract, soluble fibers, and botanical combinations suited to routine wellness use. Although adoption is slower than in major metropolitan regions, consistent demand from working adults and fitness participants drives growth.
Tohoku grows at 8.3% CAGR, supported by expanding availability of functional supplements, rising awareness of dietary management, and broader engagement with wellness routines across Miyagi, Fukushima, and Akita. Pharmacies introduce affordable weight-management products targeting digestion, metabolism, and calorie balance. Consumers adopt powders and capsules for convenient use alongside walking, home workouts, and local fitness programs. Food producers experiment with supplement-infused beverages for regional industries. Although purchasing power and industry exposure are lower than in metropolitan areas, steady wellness participation drives ongoing adoption.
The Rest of Japan grows at 7.9% CAGR, supported by gradual lifestyle-health awareness, increasing product availability, and broader participation in light fitness routines. Supplement use is centered on practical, low-cost formulations such as fiber powders, probiotic blends, and metabolism-support capsules. Pharmacies and general stores expand shelf space for everyday wellness products. Local supplement makers introduce small-batch plant-derived blends to meet emerging demand. Although adoption levels remain modest, consistent improvements in product access and awareness maintain growth.
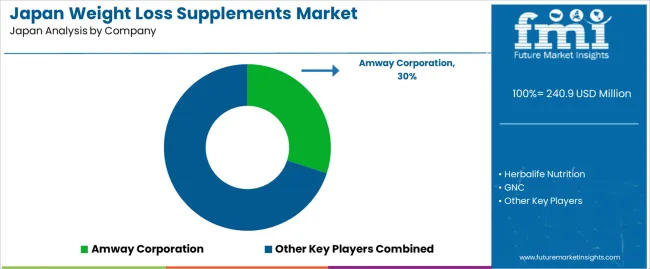
Demand for weight-loss supplements in Japan is shaped by a concentrated group of nutrition and wellness companies supplying thermogenic blends, meal-replacement formulas, plant-based products, and metabolism-support supplements. Amway Corporation holds the leading position with an estimated 30.0% share, supported by controlled formulation standards, consistent ingredient verification, and long-standing consumer adoption across Japan’s health-management segment. Its position is reinforced by predictable product quality and stable distribution through established wellness networks.
Herbalife Nutrition and GNC follow as significant participants. Herbalife provides meal-replacement and metabolic-support products characterised by stable macronutrient composition and reliable flavour consistency. GNC maintains a notable presence through branded thermogenic and weight-management formulas with documented ingredient profiles and steady availability across Japanese retail and e-commerce channels.
Fermentis Life Sciences contributes capability with fermentation-derived ingredients used in weight-management blends that prioritise digestibility and clean-label positioning. Glanbia Performance Nutrition Inc. supports demand through protein-based meal-support products and functional nutritional blends compatible with calorie-control routines. Ajinomoto Health & Nutrition adds further depth through amino-acid-focused formulations designed to support metabolic pathways and complement exercise-driven weight-management programmes.
Competition across this segment centres on ingredient traceability, formulation consistency, bioavailability, safety verification, and reliable sensory characteristics. Demand remains steady as Japanese consumers adopt structured weight-management routines, seek evidence-aligned formulations, and prioritise supplements offering predictable daily-use performance within broader diet and activity programmes.
| Items | Values |
|---|---|
| Quantitative Units | USD million |
| Type | Vitamins, Minerals, Amino Acids, Protein, Natural/Botanical Extracts, Others |
| Form | Powder, Capsule, Tablet, Liquid, Others |
| End Use | 19–40 Years, Under 18 Years, 41–50 Years, Above 50 Years |
| Distribution Channel | Supermarket/Hypermarket, Pharmacies/Drug Stores, Specialty Stores, Online Retail, Others |
| Regions Covered | Kyushu & Okinawa, Kanto, Kinki, Chubu, Tohoku, Rest of Japan |
| Key Companies Profiled | Amway Corporation, Herbalife Nutrition, GNC, Fermentis Life Sciences, Glanbia Performance Nutrition Inc., Ajinomoto Health & Nutrition |
| Additional Attributes | Dollar sales by supplement type, form, age-group end users, and distribution channel; regional adoption trends across Kyushu & Okinawa, Kanto, Kinki, Chubu, Tohoku, and Rest of Japan; competitive landscape of domestic and global weight management supplement manufacturers; developments in clean-label botanical extracts, protein-based weight loss formulations, amino-acid blends, and personalized nutrition products; integration with health-conscious consumer segments, sports nutrition, pharmacies, and online wellness retail channels in Japan. |
The demand for weight loss supplements in Japan is estimated to be valued at USD 240.9 million in 2025.
The market size for the weight loss supplements in Japan is projected to reach USD 662.7 million by 2035.
The demand for weight loss supplements in Japan is expected to grow at a 10.7% CAGR between 2025 and 2035.
The key product types in weight loss supplements in Japan are vitamins, minerals, amino acids, protein, natural/ botanical extracts and others.
In terms of form, powder segment is expected to command 65.0% share in the weight loss supplements in Japan in 2025.


Our Research Products

The "Full Research Suite" delivers actionable market intel, deep dives on markets or technologies, so clients act faster, cut risk, and unlock growth.

The Leaderboard benchmarks and ranks top vendors, classifying them as Established Leaders, Leading Challengers, or Disruptors & Challengers.

Locates where complements amplify value and substitutes erode it, forecasting net impact by horizon

We deliver granular, decision-grade intel: market sizing, 5-year forecasts, pricing, adoption, usage, revenue, and operational KPIs—plus competitor tracking, regulation, and value chains—across 60 countries broadly.

Spot the shifts before they hit your P&L. We track inflection points, adoption curves, pricing moves, and ecosystem plays to show where demand is heading, why it is changing, and what to do next across high-growth markets and disruptive tech

Real-time reads of user behavior. We track shifting priorities, perceptions of today’s and next-gen services, and provider experience, then pace how fast tech moves from trial to adoption, blending buyer, consumer, and channel inputs with social signals (#WhySwitch, #UX).

Partner with our analyst team to build a custom report designed around your business priorities. From analysing market trends to assessing competitors or crafting bespoke datasets, we tailor insights to your needs.
Supplier Intelligence
Discovery & Profiling
Capacity & Footprint
Performance & Risk
Compliance & Governance
Commercial Readiness
Who Supplies Whom
Scorecards & Shortlists
Playbooks & Docs
Category Intelligence
Definition & Scope
Demand & Use Cases
Cost Drivers
Market Structure
Supply Chain Map
Trade & Policy
Operating Norms
Deliverables
Buyer Intelligence
Account Basics
Spend & Scope
Procurement Model
Vendor Requirements
Terms & Policies
Entry Strategy
Pain Points & Triggers
Outputs
Pricing Analysis
Benchmarks
Trends
Should-Cost
Indexation
Landed Cost
Commercial Terms
Deliverables
Brand Analysis
Positioning & Value Prop
Share & Presence
Customer Evidence
Go-to-Market
Digital & Reputation
Compliance & Trust
KPIs & Gaps
Outputs
Full Research Suite comprises of:
Market outlook & trends analysis
Interviews & case studies
Strategic recommendations
Vendor profiles & capabilities analysis
5-year forecasts
8 regions and 60+ country-level data splits
Market segment data splits
12 months of continuous data updates
DELIVERED AS:
PDF EXCEL ONLINE
Demand Signal Repository Solutions Market Size and Share Forecast Outlook 2025 to 2035
Demand Side Management Market Size and Share Forecast Outlook 2025 to 2035
Demand Response Market Analysis - Size, Share, and Forecast Outlook 2025 to 2035
North America Shipping Supplies Market Trends – Innovations & Growth 2024-2034
Demand of Kozani Saffron in Greece Analysis - Size, Share & Forecast 2025 to 2035
Demand of No-acid Whey Strained Dairy Processing Concepts in European Union Size and Share Forecast Outlook 2025 to 2035
Demand for Bronte Pistachio in Italy Analysis - Size, Share & Forecast 2025 to 2035
Demand and Trend Analysis of Gaming Monitor in Western Europe Size and Share Forecast Outlook 2025 to 2035
Demand and Trend Analysis of Gaming Monitor in Korea Size and Share Forecast Outlook 2025 to 2035
Demand and Trend Analysis of Gaming Monitor in Japan Size and Share Forecast Outlook 2025 to 2035
Glycine Soja (Soybean) Seed Extract Market Size and Share Forecast Outlook 2025 to 2035
Demand and Trend Analysis of Yeast in Japan - Size, Share, and Forecast Outlook 2025 to 2035
Demand of Pistachio-based desserts & ingredients in France Analysis - Size, Share & Forecast 2025 to 2035
Western Europe Men’s Skincare Market Analysis – Forecast 2023-2033
Demand and Trends Analysis of Stevia in Japan Size and Share Forecast Outlook 2025 to 2035
Japan Women’s Intimate Care Market Trends – Growth & Forecast 2024-2034
Demand and Trend Analysis of Fabric Stain Remover in Korea Size and Share Forecast Outlook 2025 to 2035
Demand and Sales Analysis of Paper Cup in Korea Size and Share Forecast Outlook 2025 to 2035
Demand and Sales Analysis of Paper Cup in Western Europe Size and Share Forecast Outlook 2025 to 2035
Demand of MFGM-enriched Powders & RTDs in European Union Size and Share Forecast Outlook 2025 to 2035

Thank you!
You will receive an email from our Business Development Manager. Please be sure to check your SPAM/JUNK folder too.
Chat With
MaRIA