The Demand Side Management Market is estimated to be valued at USD 84.5 billion in 2025 and is projected to reach USD 244.3 billion by 2035, registering a compound annual growth rate (CAGR) of 11.2% over the forecast period. Early growth is characterized by steady uptake among industrial and commercial clients, supported by regulatory frameworks that promote energy conservation and operational cost reduction.
As adoption progresses, integration of advanced metering infrastructure, real-time demand response systems, and predictive AI-based load management accelerates expansion. Residential participation also begins to influence growth, with digital monitoring platforms and automated energy management solutions becoming more prevalent. Over time, the market shifts from pilot implementations and niche projects toward widespread deployment across sectors. YoY growth demonstrates a strong upward trajectory, reflecting the combined effect of regulatory support, technological integration, and increasing awareness of energy efficiency benefits.
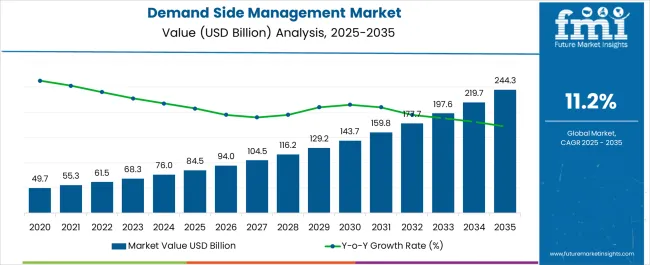
| Metric | Value |
|---|---|
| Demand Side Management Market Estimated Value in (2025 E) | USD 84.5 billion |
| Demand Side Management Market Forecast Value in (2035 F) | USD 244.3 billion |
| Forecast CAGR (2025 to 2035) | 11.2% |
The demand side management market is expanding steadily as utility providers, governments, and consumers increasingly focus on energy efficiency, peak load reduction, and grid reliability. The integration of smart grid infrastructure and real time energy monitoring technologies has enhanced the capability of utilities to influence and optimize energy consumption patterns.
Regulatory frameworks promoting energy conservation and decarbonization are further accelerating the adoption of demand side strategies. Rising energy costs and growing awareness around sustainable energy use have led residential and commercial users to invest in intelligent energy management systems.
As global electricity demand continues to rise, demand side management solutions are positioned as critical tools for achieving load flexibility, enhancing energy security, and supporting renewable energy integration.
The demand-side management market is segmented by service, technology solution, end-use, and geographic region. By service, the demand side management market is divided into Demand Response, Energy Efficiency, and Load Management. In terms of technology solutions, the demand side management market is classified into Smart Thermostats, AMI Meters, and EMS. Based on end-use, the demand-side management market is segmented into Residential, Commercial, and Industrial. Regionally, the demand-side management industry is classified into North America, Latin America, Western Europe, Eastern Europe, the Balkan & Baltic Countries, Russia & Belarus, Central Asia, East Asia, South Asia & Pacific, and the Middle East & Africa.
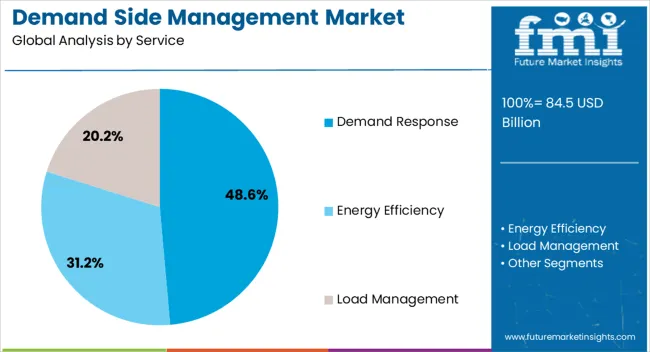
The demand response segment is expected to account for 48.60% of total revenue by 2025 within the service category, making it the leading segment. This growth is driven by its ability to offer real time load adjustments, reduce peak demand, and provide financial incentives to users.
Utilities and grid operators are increasingly leveraging demand response programs to balance supply and demand efficiently without the need for additional power generation. The scalability and cost effectiveness of these programs make them particularly attractive in both developed and emerging energy markets.
As the energy transition advances and grids become more decentralized, demand response remains the most adopted strategy for managing dynamic electricity loads and enhancing grid stability.
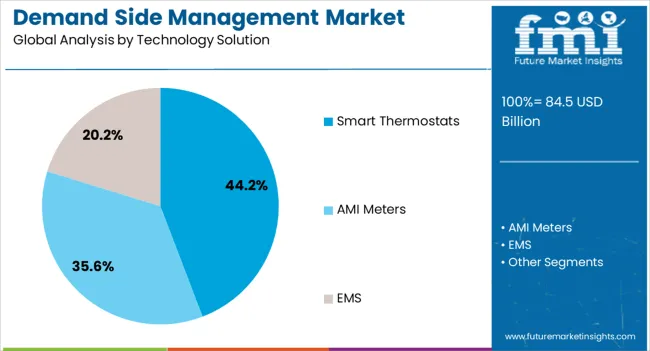
The smart thermostats segment is projected to represent 44.20% of total market revenue by 2025 in the technology solution category, positioning it as the dominant technology. This is attributed to rising consumer interest in home automation, energy savings, and remote control capabilities.
Smart thermostats offer real-time temperature regulation, learning algorithms, and integration with home energy systems, making them essential for demand side optimization. Their compatibility with demand response programs and ability to support dynamic pricing models have further increased their adoption.
With growing emphasis on smart homes and energy-conscious behavior, smart thermostats continue to lead technological innovations in the demand side management space.
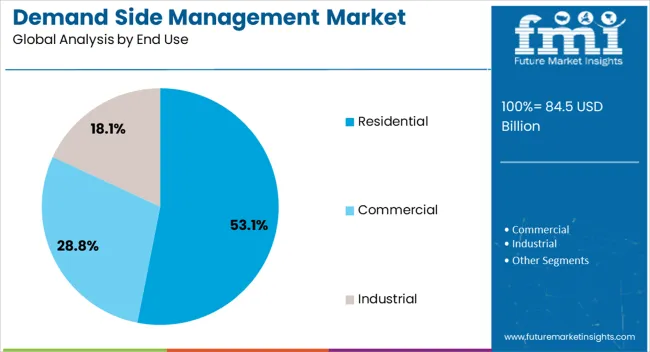
The residential segment is expected to contribute 53.10% of overall market revenue by 2025, making it the leading end use category. This growth is being driven by rising electricity bills, consumer interest in energy efficient appliances, and increased availability of user friendly smart devices.
Residential consumers are actively adopting smart meters, thermostats, and connected home systems that allow for better control over energy usage. Government rebates, energy awareness campaigns, and utility driven demand response programs have further supported this shift.
As homes evolve into smart and sustainable living spaces, the residential sector remains at the forefront of demand side management adoption, driving efficiency and reducing grid stress during peak periods.
The demand side management market is driven by a growing focus on energy efficiency, government regulations, the rise of smart technologies, and the active role of energy providers. These dynamics are expected to fuel the continued expansion of DSM solutions globally.
The demand side management market is seeing a surge in adoption as both consumers and businesses prioritize energy efficiency. With rising electricity costs and the growing awareness of the environmental impact of energy usage, DSM systems have become essential for optimizing consumption. Governments around the world are introducing policies that incentivize energy-saving technologies, further fueling the market. DSM solutions, including smart meters, energy-efficient appliances, and real-time monitoring, are becoming more widespread across residential, commercial, and industrial sectors. As energy costs continue to rise, the need for solutions that help manage peak demand and reduce energy consumption will drive further adoption of DSM technologies.
Government regulations and incentives play a pivotal role in driving the growth of the demand side management market. Many countries are introducing mandates to improve energy efficiency and reduce peak demand through DSM programs. These regulations promote the use of smart grid technologies, energy-efficient appliances, and demand response initiatives to help balance grid demand. In addition to regulations, governments are offering rebates, tax incentives, and subsidies to encourage both residential and industrial adoption of DSM technologies. These policies are critical in accelerating the transition to smarter and more efficient energy systems, benefiting consumers, businesses, and energy providers.
The growing adoption of smart technologies is driving the demand side management market forward. With the proliferation of smart homes, connected devices, and IoT-enabled appliances, consumers have more control over their energy consumption than ever before. Smart thermostats, energy monitoring systems, and demand response tools are becoming integral parts of energy-efficient living and working environments. For businesses, the integration of DSM solutions into operational systems offers better management of energy consumption, reducing operational costs. This increased use of smart devices is helping to create more energy-efficient homes and businesses, which in turn is expanding the demand side management market.
Energy providers are playing an increasingly important role in the expansion of demand side management programs. By offering incentives and actively promoting DSM solutions, utility companies are helping both residential and industrial consumers reduce their energy usage during peak periods. Many energy providers are now implementing demand response programs that encourage customers to shift their energy usage to off-peak times, helping to alleviate strain on the grid. Utility companies are also investing in advanced technologies, including smart meters and real-time data analytics, to enable better energy monitoring and improve grid stability. Their involvement is essential for scaling DSM solutions across various sectors.
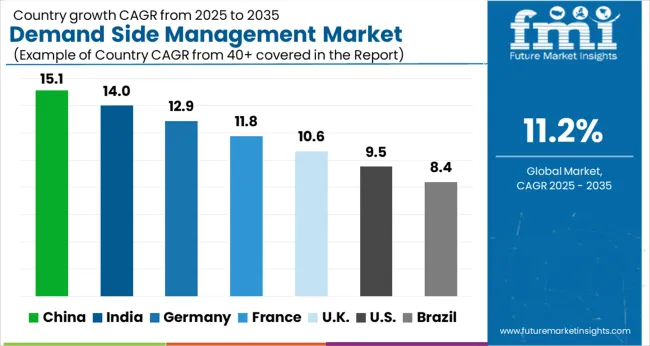
| Countries | CAGR |
|---|---|
| China | 15.1% |
| India | 14.0% |
| Germany | 12.9% |
| France | 11.8% |
| UK | 10.6% |
| USA | 9.5% |
| Brazil | 8.4% |
The demand side management (DSM) market is projected to grow globally at a CAGR of 11.2% from 2025 to 2035, driven by the increasing need for energy efficiency, regulatory policies, and the rise of smart technologies. China leads with a CAGR of 15.1%, driven by the country's aggressive push towards energy conservation and smart grid technologies. India follows at 14.0%, benefiting from the growing adoption of energy-efficient solutions and government incentives for renewable energy projects. France achieves 11.8%, driven by rising energy costs and increased adoption of energy-saving technologies across residential, commercial, and industrial sectors. The UK grows at 10.6%, supported by energy-saving programs and smart home solutions, while the USA maintains a 9.5% CAGR, reflecting steady demand for DSM technologies in both residential and industrial applications. The report highlights insights for over 40 countries, offering a comprehensive view of demand-side market strategies, regional drivers, and emerging technology trends that are shaping the future of energy consumption worldwide.
The UK is projected to grow at a CAGR of 10.6% during 2025–2035, slightly lower than the global average of 11.2%. Between 2020–2024, the market expanded at a rate of approximately 9.2%, driven by government incentives, energy efficiency programs, and the growing adoption of smart technologies. The increased demand for home energy management systems, coupled with industrial energy optimization, fueled this growth. The rise in energy costs and the growing focus on sustainability contributed to the steady expansion during this period. From 2025 onward, the UK is expected to experience a higher CAGR due to more aggressive government regulations, increasing adoption of IoT-based energy solutions, and the greater integration of renewable energy sources into the national grid. DSM technologies are expected to be integrated more widely across residential, commercial, and industrial sectors, further accelerating market growth.
China is expected to achieve a CAGR of 15.1% during 2025–2035, well above the global CAGR of 11.2%. Between 2020–2024, the market expanded at around 12.8%, supported by government-led initiatives to reduce energy consumption, improve grid stability, and promote renewable energy. The rise of smart meters, demand response programs, and increased residential and commercial adoption of energy-efficient solutions were key drivers in this period. The projected growth for 2025–2035 will be further fueled by China’s rapid urbanization, continued investments in smart grid infrastructure, and a larger push towards energy efficiency in both the industrial and residential sectors. As China moves toward its carbon-neutral targets, the demand for advanced DSM technologies is expected to surge.
India is projected to grow at a CAGR of 14.0% during 2025–2035, well above the global 11.2% rate. Between 2020–2024, the market grew at around 11.2%, driven by energy efficiency measures and the increasing adoption of smart grid technologies. Rising energy consumption, especially in residential and commercial sectors, has accelerated the need for efficient DSM solutions. With government schemes like the Smart Cities Mission and Make in India, energy management has gained focus. Over the next decade, DSM adoption will surge due to the growing use of smart meters, the implementation of demand response programs, and increased awareness about energy efficiency. A continued push from government agencies to optimize electricity consumption will further drive market growth in India.
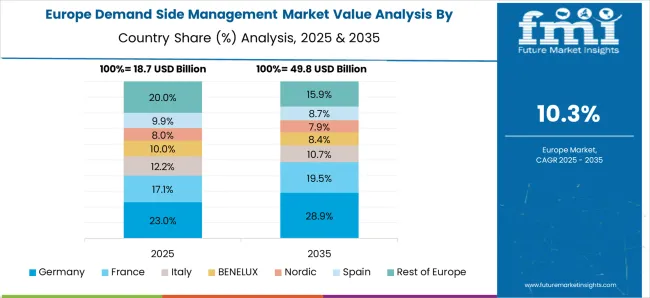
France is expected to grow at a CAGR of 11.8% during 2025–2035, just slightly higher than the global CAGR of 11.2%. Between 2020–2024, the market grew at a CAGR of about 9.5%, with a focus on residential energy optimization and the adoption of renewable energy solutions. The country’s commitment to reducing carbon emissions and meeting EU energy goals has played a significant role in promoting DSM adoption. In the coming years, as the push for energy efficiency intensifies, demand for advanced DSM technologies, such as real-time energy monitoring, home automation systems, and IoT-based solutions, will drive market growth. France's commitment to energy-efficient homes and businesses through government incentives and local energy efficiency programs will remain key to this expansion.
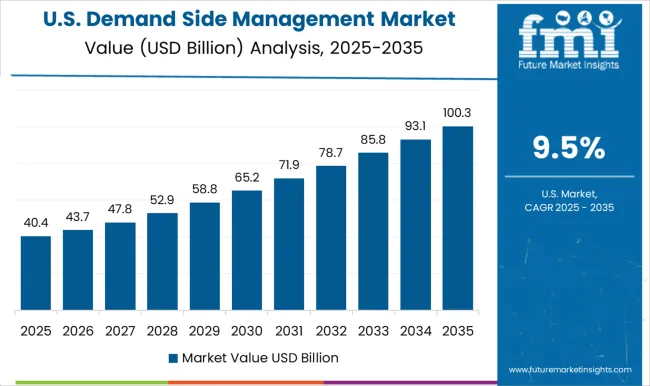
The USA is projected to grow at a CAGR of 9.5% during 2025–2035, below the global average of 11.2%. Between 2020–2024, the market expanded at a slower pace of around 7.5%, driven by the growing adoption of smart grid technologies, residential energy efficiency programs, and demand response initiatives. Government policies and incentives have supported the integration of energy-saving solutions across various sectors, including residential, commercial, and industrial. The expected increase in the market CAGR from 2020 to 2024 to 2025 to 2035 can be attributed to stronger regulatory pressures, the rising need for energy management solutions, and an increasing focus on reducing energy consumption. The introduction of more energy-efficient products, such as smart thermostats and appliances, will further fuel market expansion in the USA, alongside greater participation in demand response programs by utilities and consumers.
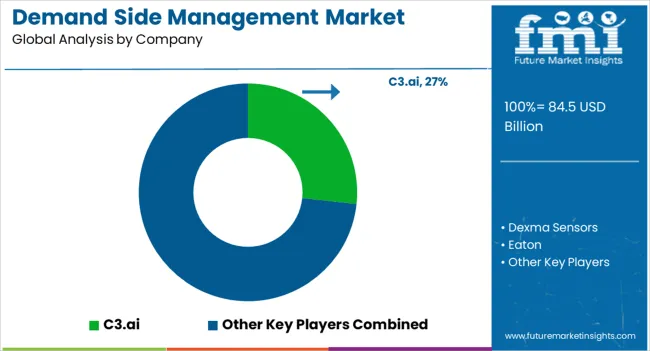
The demand side management (DSM) market is shaped by a blend of established industrial leaders and innovative tech companies delivering energy management solutions across sectors. C3.ai leads the market with its AI-driven energy management solutions, focusing on predictive analytics to optimize energy consumption across industries. Dexma Sensors provides energy monitoring systems with a focus on reducing operational costs through real-time data and integration with cloud-based platforms. Eaton leverages its deep expertise in electrical systems, offering DSM solutions that enhance energy efficiency, improve grid stability, and support renewable energy integration. Emerson Electric delivers advanced energy management technologies with a focus on automation and control systems for large-scale industrial operations. General Electric (GE) remains a major player, using its digital twin technology and smart grid solutions to enhance DSM for utilities and large enterprises. Honeywell provides smart energy solutions and automated building systems that support demand response programs and optimize energy consumption. IBM drives innovation with its AI-powered platforms, helping businesses improve energy efficiency and reduce operational costs. Johnson Controls integrates building automation systems, helping companies monitor and optimize energy use through connected devices and cloud-based platforms.
Optimum Energy provides software solutions for optimizing HVAC and other energy-intensive operations, helping commercial buildings lower energy consumption. Rockwell Automation focuses on energy management systems integrated with industrial automation, enabling businesses to improve energy efficiency and reduce waste. Schneider Electric is a leading provider of DSM solutions, specializing in smart grid technologies, energy monitoring, and sustainability solutions. Siemens delivers digital energy management systems that optimize energy usage across industries, including advanced grid management for utilities. SkyFoundry provides software solutions to monitor and analyze building data, enhancing energy efficiency in commercial buildings. Telkonet offers IoT-enabled energy management systems for hotels, schools, and healthcare facilities to reduce energy consumption. Key strategies in the DSM market include investing in AI, IoT, and cloud computing to offer real-time monitoring, predictive analytics, and optimized energy consumption solutions. Vendors are focusing on energy optimization, integrating renewable energy, and developing scalable solutions for diverse industries. Future growth will favor companies offering holistic energy management solutions that ensure efficiency, sustainability, and adaptability in response to evolving global energy demands.
| Item | Value |
|---|---|
| Quantitative Units | USD 84.5 Billion |
| Service | Demand Response, Energy Efficiency, and Load Management |
| Technology Solution | Smart Thermostats, AMI Meters, and EMS |
| End Use | Residential, Commercial, and Industrial |
| Regions Covered | North America, Europe, Asia-Pacific, Latin America, Middle East & Africa |
| Country Covered | United States, Canada, Germany, France, United Kingdom, China, Japan, India, Brazil, South Africa |
| Key Companies Profiled | C3.ai, Dexma Sensors, Eaton, Emerson Electric, eSight Energy, General Electric, Honeywell, IBM, Johnson Controls, Optimum Energy, Rockwell Automation, Schneider Electric, Siemens, SkyFoundry, and Telkonet |
| Additional Attributes | Dollar sales projections, market share by region and application (residential, commercial, industrial), growth trends in energy management, competitive landscape, and demand for energy-efficient devices like smart meters, thermostats, and IoT-based energy solutions. Insights on government policies, regulatory impacts, and technological advancements would also be key for strategic planning. |
The global demand side management market is estimated to be valued at USD 84.5 billion in 2025.
The market size for the demand side management market is projected to reach USD 244.3 billion by 2035.
The demand side management market is expected to grow at a 11.2% CAGR between 2025 and 2035.
The key product types in demand side management market are demand response, energy efficiency and load management.
In terms of technology solution, smart thermostats segment to command 44.2% share in the demand side management market in 2025.


Our Research Products

The "Full Research Suite" delivers actionable market intel, deep dives on markets or technologies, so clients act faster, cut risk, and unlock growth.

The Leaderboard benchmarks and ranks top vendors, classifying them as Established Leaders, Leading Challengers, or Disruptors & Challengers.

Locates where complements amplify value and substitutes erode it, forecasting net impact by horizon

We deliver granular, decision-grade intel: market sizing, 5-year forecasts, pricing, adoption, usage, revenue, and operational KPIs—plus competitor tracking, regulation, and value chains—across 60 countries broadly.

Spot the shifts before they hit your P&L. We track inflection points, adoption curves, pricing moves, and ecosystem plays to show where demand is heading, why it is changing, and what to do next across high-growth markets and disruptive tech

Real-time reads of user behavior. We track shifting priorities, perceptions of today’s and next-gen services, and provider experience, then pace how fast tech moves from trial to adoption, blending buyer, consumer, and channel inputs with social signals (#WhySwitch, #UX).

Partner with our analyst team to build a custom report designed around your business priorities. From analysing market trends to assessing competitors or crafting bespoke datasets, we tailor insights to your needs.
Supplier Intelligence
Discovery & Profiling
Capacity & Footprint
Performance & Risk
Compliance & Governance
Commercial Readiness
Who Supplies Whom
Scorecards & Shortlists
Playbooks & Docs
Category Intelligence
Definition & Scope
Demand & Use Cases
Cost Drivers
Market Structure
Supply Chain Map
Trade & Policy
Operating Norms
Deliverables
Buyer Intelligence
Account Basics
Spend & Scope
Procurement Model
Vendor Requirements
Terms & Policies
Entry Strategy
Pain Points & Triggers
Outputs
Pricing Analysis
Benchmarks
Trends
Should-Cost
Indexation
Landed Cost
Commercial Terms
Deliverables
Brand Analysis
Positioning & Value Prop
Share & Presence
Customer Evidence
Go-to-Market
Digital & Reputation
Compliance & Trust
KPIs & Gaps
Outputs
Full Research Suite comprises of:
Market outlook & trends analysis
Interviews & case studies
Strategic recommendations
Vendor profiles & capabilities analysis
5-year forecasts
8 regions and 60+ country-level data splits
Market segment data splits
12 months of continuous data updates
DELIVERED AS:
PDF EXCEL ONLINE
Insider Risk Management Market Size and Share Forecast Outlook 2025 to 2035
Commercial Demand Side Management Market Size and Share Forecast Outlook 2025 to 2035
Sidewinder Machine Market Size and Share Forecast Outlook 2025 to 2035
Side Load Case Packing Machines Market Size and Share Forecast Outlook 2025 to 2035
Side Loader Trucks Market Size and Share Forecast Outlook 2025 to 2035
Side Gusset/Quad Seal Bag Market Size and Share Forecast Outlook 2025 to 2035
Key Companies & Market Share in the Side Gusset/Quad Seal Bag Sector
Side Weld Bags Market
Side Sealer Machines Market
Residential Generator Market Size and Share Forecast Outlook 2025 to 2035
Residential Energy-Efficient Technologies Market Size and Share Forecast Outlook 2025 to 2035
Residential Interior Wood Doors Market Size and Share Forecast Outlook 2025 to 2035
Insider Threat Protection Market Analysis Size and Share Forecast Outlook 2025 to 2035
Residential Air-to-Air Heat Pump Market Size and Share Forecast Outlook 2025 to 2035
Residential Automatic Motor Starter Market Size and Share Forecast Outlook 2025 to 2035
Residential AMI Gas Meter Market Size and Share Forecast Outlook 2025 to 2035
Residential Vacuum Circuit Breaker Market Size and Share Forecast Outlook 2025 to 2035
Residential Solar Tracker Market Size and Share Forecast Outlook 2025 to 2035
Residential Non-metal Electrical Conduit Market Size and Share Forecast Outlook 2025 to 2035
Residential Carpet Roll Market Size and Share Forecast Outlook 2025 to 2035

Thank you!
You will receive an email from our Business Development Manager. Please be sure to check your SPAM/JUNK folder too.
Chat With
MaRIA