The Demand and Trend Analysis of Fabric Stain Remover in Korea is estimated to be valued at USD 218.5 million in 2025 and is projected to reach USD 560.7 million by 2035, registering a compound annual growth rate (CAGR) of 9.9% over the forecast period.
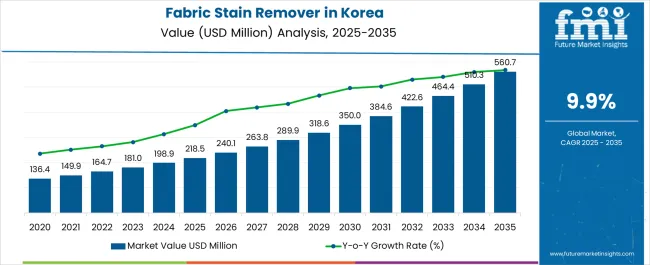
| Metric | Value |
|---|---|
| Demand and Trend Analysis of Fabric Stain Remover in Korea Estimated Value in (2025 E) | USD 218.5 million |
| Demand and Trend Analysis of Fabric Stain Remover in Korea Forecast Value in (2035 F) | USD 560.7 million |
| Forecast CAGR (2025 to 2035) | 9.9% |
The fabric stain remover market in Korea is witnessing steady growth. Increasing consumer awareness regarding garment care, rising disposable incomes, and evolving household cleaning habits are driving demand. Current market dynamics are characterized by diverse product offerings, competitive pricing strategies, and expanding retail penetration, while regulatory standards on chemical safety and environmental compliance are shaping product development and adoption.
The future outlook is influenced by the preference for convenient, effective, and safe cleaning solutions, along with growing e-commerce channels that enhance accessibility. Growth rationale is founded on sustained household usage, innovation in formulation to address various stain types, and strategic positioning by brands to capture value through differentiated products.
Additionally, rising urbanization and lifestyle changes are expected to maintain consistent demand Manufacturers are focusing on product efficacy, safety, and packaging innovations to strengthen consumer loyalty and market share, ensuring long-term growth potential and competitive stability across Korea’s household cleaning segment.
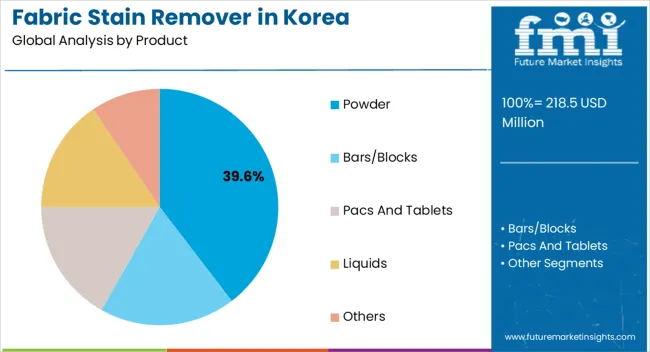
The powder segment, representing 39.60% of the product category, has maintained market leadership due to its perceived effectiveness, ease of storage, and long shelf life. Adoption has been driven by traditional consumer preference for powdered formulations that allow flexible dosing and strong stain removal performance.
Market acceptance has been reinforced by product improvements in solubility and scent, enhancing user experience. Powder variants benefit from lower manufacturing costs and widespread availability in both modern trade and traditional retail channels, which has strengthened their market share.
Innovation in eco-friendly ingredients and improved formulation stability has further enhanced the segment’s positioning Continued focus on meeting consumer expectations for performance, affordability, and convenience is expected to sustain powder’s market dominance and support incremental growth in the overall fabric stain remover market.
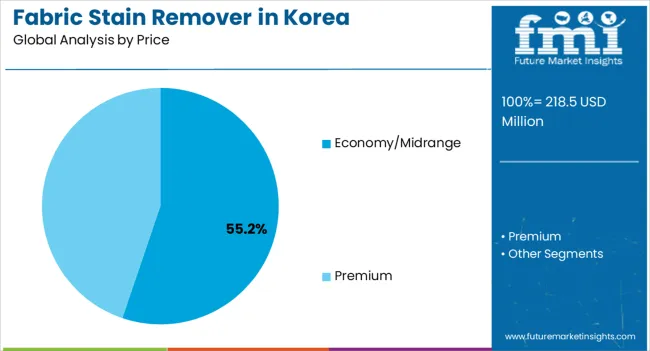
The economy/midrange segment, holding 55.20% of the price category, has emerged as the leading price tier due to its balance of affordability and perceived quality. Adoption has been supported by price-sensitive household consumers who seek effective stain removal without premium pricing.
Retail strategies, promotional campaigns, and competitive pricing structures have reinforced market penetration. Product accessibility through both offline and online channels has strengthened demand.
Brands operating in this segment have emphasized performance consistency, packaging innovation, and brand trust to retain consumer loyalty Growth is expected to be driven by continued urban household demand, brand differentiation, and incremental improvements in product formulation that maintain consumer satisfaction while remaining within accessible price points.
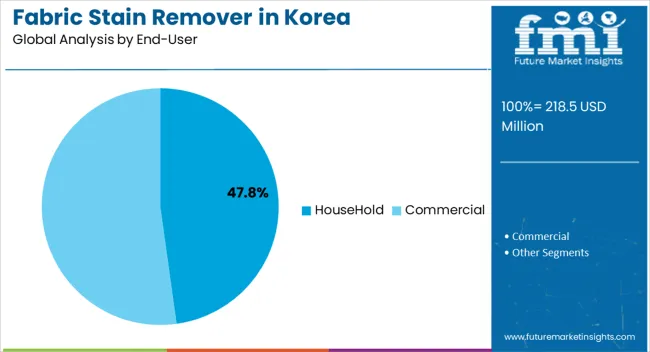
The household segment, accounting for 47.80% of the end-user category, has remained the dominant consumer base owing to consistent domestic demand for fabric care solutions. Adoption has been facilitated by regular laundry routines, heightened awareness of garment maintenance, and preference for effective stain removal products.
Product availability through supermarkets, hypermarkets, and online platforms has enhanced reach and convenience for households. Continued education on stain management and product efficacy has strengthened consumer trust and repeat purchase behavior.
Innovation in formulation, packaging, and multi-functional capabilities is expected to sustain the segment’s leading share The segment’s contribution remains critical for overall market growth, as household consumers continue to drive consistent usage and adoption of fabric stain remover products across Korea.
South Gyeonsang have higher demand for fabric stain remover due to denser populations, busier lifestyles, and greater access to a variety of stain remover products through supermarkets, retail outlets, and online channels. Convenience and availability of these products in local stores might impact demand for fabric stain remover in some rural area.
Higher disposable income in the region lead to increased spending on specialized or premium stain removers, while areas with lower incomes might focus more on value-oriented options. The growing environmental concerns among the population may also influence the demand for specific types of stain removers, such as eco-friendly or natural formulations.
The presence of specific brands, marketing efforts, and promotions in North Jeolla could impact consumer choices and influence the demand for stain remover. The growing industrialization and urbanization to boost the demand for fabric stain remover in North Jeolla.
Stain remover products such as liquid, sprays & powders are in more demand owing to their easy availability through supermarket and hypermarkets.
Based on sales channel, the fabric stain remover industry in Korea is likely to be dominated by the indirect sales segment, with a share of 61.20%. Indirect sales channels, such as retail stores, supermarkets, and online marketplaces, provide a broad reach to a diverse consumer base. These channels allow stain remover brands to access customers across different regions and demographics.
Indirect channels offer convenience to consumers by providing easy access to stain removers during routine shopping trips. Consumers often purchase stain removers alongside other household products, enhancing convenience and impulse purchases.
| Attribute | Details |
|---|---|
| Sales Channel | Indirect |
| Value Share | 61.20% |
Based on product, the fabric stain remover in Korea is likely to be dominated by the Pacs and tablet segment, with a share of 14.30%.
Pacs and tablets offer a hassle-free and convenient way to use stain removers. They come in pre-measured doses, eliminating the need for measuring and reducing the chances of overusing or wasting the product. Consumers appreciate the simplicity of using pacs and tablets.
They can simply toss one into the washing machine along with the laundry load, making the stain removal process straightforward and efficient.
The compact and portable nature makes pacs and tablets easy to store and carry. This convenience is particularly appealing for people with busy lifestyles or those who frequently do laundry outside their homes.
| Attribute | Details |
|---|---|
| Product | Pacs and Tablets |
| Value Share | 14.30% |
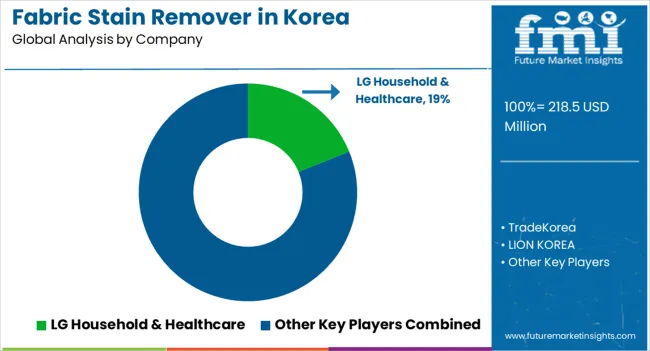
With their extensive expertise, resources, and focus on sustainability, fabric stain remover companies are actively contributing to expansion. Many big players are also using mergers & acquisitions as a critical strategy for expanding their geographical presence and for more business in terms of revenue.
Massive investments in Research and Development and strategic partnerships have allowed the players to establish a firm foothold in the market, enlarging their fabric stain remover share.
Key Product Offerings
| Attribute | Details |
|---|---|
| Estimated Industry Size in 2025 | USD 218.5 million |
| Projected Industry Size in 2035 | USD 560.7 million |
| Anticipated CAGR between 2025 to 2035 | 9.9% CAGR |
| Historical Analysis of Demand for Fabric Stain Remover in Korea | 2020 to 2025 |
| Demand Forecast for Fabric Stain Remover in Korea | 2025 to 2035 |
| Report Coverage | Industry Size, Industry Trends, Analysis of key factors influencing Fabric Stain Remover Sales in Korea, Insights on Global Players and their Industry Strategy in Korea, Ecosystem Analysis of Local Providers in Korea |
| Key Province Analyzed while Studying Opportunities Fabric Stain Remover in Korea | South Gyeongsang, North Jeolla, South Jeolla, Jeju, Rest of Korea |
| Key Companies Profiled | LG Household & Healthcare; TradeKorea; LION KOREA; The Procter & Gamble Company; Colgate-Palmolive Company; S.C. Johnson & Son Inc.; Amway Corporation; Church & Dwight Co. Inc.; AlEn USA LLC; Unilever PLC; Henkel Corporation |
The global demand and trend analysis of fabric stain remover in Korea is estimated to be valued at USD 218.5 million in 2025.
The market size for the demand and trend analysis of fabric stain remover in Korea is projected to reach USD 563.6 million by 2035.
The demand and trend analysis of fabric stain remover in Korea is expected to grow at a 9.9% CAGR between 2025 and 2035.
The key product types in demand and trend analysis of fabric stain remover in Korea are powder, bars/blocks, pacs and tablets, liquids and others.
In terms of price, economy/midrange segment to command 55.2% share in the demand and trend analysis of fabric stain remover in Korea in 2025.


Our Research Products

The "Full Research Suite" delivers actionable market intel, deep dives on markets or technologies, so clients act faster, cut risk, and unlock growth.

The Leaderboard benchmarks and ranks top vendors, classifying them as Established Leaders, Leading Challengers, or Disruptors & Challengers.

Locates where complements amplify value and substitutes erode it, forecasting net impact by horizon

We deliver granular, decision-grade intel: market sizing, 5-year forecasts, pricing, adoption, usage, revenue, and operational KPIs—plus competitor tracking, regulation, and value chains—across 60 countries broadly.

Spot the shifts before they hit your P&L. We track inflection points, adoption curves, pricing moves, and ecosystem plays to show where demand is heading, why it is changing, and what to do next across high-growth markets and disruptive tech

Real-time reads of user behavior. We track shifting priorities, perceptions of today’s and next-gen services, and provider experience, then pace how fast tech moves from trial to adoption, blending buyer, consumer, and channel inputs with social signals (#WhySwitch, #UX).

Partner with our analyst team to build a custom report designed around your business priorities. From analysing market trends to assessing competitors or crafting bespoke datasets, we tailor insights to your needs.
Supplier Intelligence
Discovery & Profiling
Capacity & Footprint
Performance & Risk
Compliance & Governance
Commercial Readiness
Who Supplies Whom
Scorecards & Shortlists
Playbooks & Docs
Category Intelligence
Definition & Scope
Demand & Use Cases
Cost Drivers
Market Structure
Supply Chain Map
Trade & Policy
Operating Norms
Deliverables
Buyer Intelligence
Account Basics
Spend & Scope
Procurement Model
Vendor Requirements
Terms & Policies
Entry Strategy
Pain Points & Triggers
Outputs
Pricing Analysis
Benchmarks
Trends
Should-Cost
Indexation
Landed Cost
Commercial Terms
Deliverables
Brand Analysis
Positioning & Value Prop
Share & Presence
Customer Evidence
Go-to-Market
Digital & Reputation
Compliance & Trust
KPIs & Gaps
Outputs
Full Research Suite comprises of:
Market outlook & trends analysis
Interviews & case studies
Strategic recommendations
Vendor profiles & capabilities analysis
5-year forecasts
8 regions and 60+ country-level data splits
Market segment data splits
12 months of continuous data updates
DELIVERED AS:
PDF EXCEL ONLINE
Fabric Stain Remover Market Growth – Trends, Demand & Innovations 2025-2035
Japan Fabric Stain Remover Market Analysis - Size, Share & Trends 2025 to 2035
Western Europe Fabric Stain Remover Market Analysis – Size, Share & Trends 2025 to 2035
Pet Stain Remover & Odor Control Market Analysis - Growth to 2025 to 2035
Stain-Resistant Fabric Market Analysis – Trends, Growth & Forecast 2025-2035
Stainless Steel 330 Refractory Anchor Market Size and Share Forecast Outlook 2025 to 2035
Stainless Steel One-touch Fitting Market Size and Share Forecast Outlook 2025 to 2035
Stainless Steel Submerged Arc Welding Wire Market Size and Share Forecast Outlook 2025 to 2035
Stainless Steel Direct Acting Solenoid Valve Market Size and Share Forecast Outlook 2025 to 2035
Stainless Steel Miniature Screw Market Size and Share Forecast Outlook 2025 to 2035
Fabric Spreading Machine Market Forecast Outlook 2025 to 2035
Stainless Steel Industry Analysis in India Forecast and Outlook 2025 to 2035
Fabric Freshener Market Forecast and Outlook 2025 to 2035
Fabric Inspection Machine Market Size and Share Forecast Outlook 2025 to 2035
Stainless Steel Welded Pipe Market Size and Share Forecast Outlook 2025 to 2035
Stainless Steel Market Size and Share Forecast Outlook 2025 to 2035
Fabric Cutting Machine Market Size and Share Forecast Outlook 2025 to 2035
Stainless Steel Turning Inserts Market Size and Share Forecast Outlook 2025 to 2035
Stainless Steel Electrical Cabinet Market Size and Share Forecast Outlook 2025 to 2035
Korea Automotive Performance Tuning and Engine Remapping Service Industry Size and Share Forecast Outlook 2025 to 2035

Thank you!
You will receive an email from our Business Development Manager. Please be sure to check your SPAM/JUNK folder too.
Chat With
MaRIA