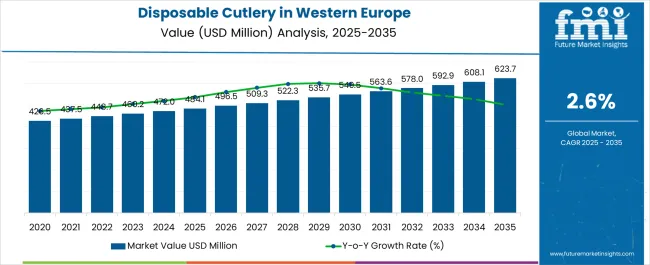
In 2024, disposable cutlery demand in Western Europe is anticipated to reach a value of USD 471.4 million. The demand for disposable cutlery in Western Europe is likely to expand with a 2.70% CAGR from 2024 to 2034. The industry is projected to attain USD 612.9 million by 2034.
Key Insights that Promotes the Demand of Disposable Cutlery in Western Europe
Attributes | Details |
---|---|
Industry Size in 2024 | USD 471.4 million |
Expected Industry Size in 2034 | USD 612.9 million |
Forecasted CAGR between 2024 to 2034 | 2.70% |
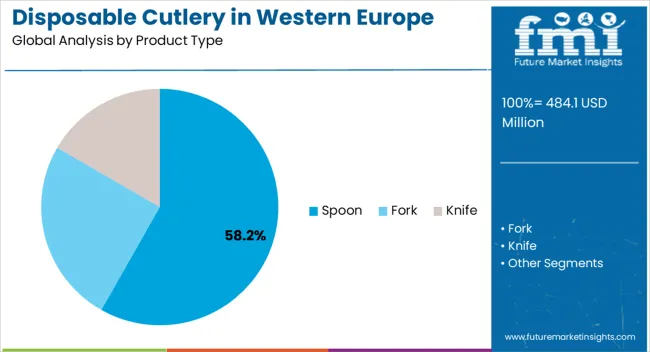
In 2024, the spoon segment is likely to gain a share of 58.20% in Western Europe.
Product Type | Spoons |
---|---|
Expected share in 2024 | 58.20% |
Spoons are popular in the Western Europe disposable cutlery industry due to their versatility in a variety of food consumption settings. They serve a broad variety of foods, such as takeaway, desserts, and soups, which makes them a go to option for eating at home or on the go. Disposable spoons are convenient and fit in well with the fast paced lives that are common in the region.
Spoons are becoming more and more popular in the disposable cutlery industry as a result of the demand for environmentally acceptable materials in their manufacture, which addresses sustainability issues.
The food and beverage segment in Western Europe disposable cutlery industry is estimated to garner a 26.50% share in 2024.
End Use Segment | Food Service |
---|---|
Expected share in 2024 | 61.80% |
The rise in takeaway and delivery services in the food service business in Western Europe is contributing considerably to an increase in disposable flatware sales.
Single use utensils are becoming more and more common due to shifting customer tastes brought on by hectic lives and the growth of food delivery services on the internet. Cafés, restaurants, as well as food delivery services to improve ease and hygiene during these interactions frequently use disposable cutlery.
Sales have also been boosted by the response of this industry to environmental concerns, which has raised consumer demand for eco friendly and sustainable disposable products. The food service industry in Western Europe is seeing a surge in the use of disposable cutlery due to the combination of convenience, cleanliness, and sustainability.
Manufacturers dealing with disposable cutlery have made significant strides in two Western European regions, the United Kingdom and Germany.
Regions Profiled | CAGR from 2024 to 2034 |
---|---|
Germany | 2.70% |
The United Kingdom | 2.90% |
During the forecast period, Germany disposable cutlery industry is likely to garner a 2.70% CAGR. A number of reasons, including shifting lifestyles and an increase in food consumption while on the go, in addition to environmental concerns, impacts the disposable cutlery market in Germany. The need for convenience and busy urban lifestyles have increased demand for single use cutlery for fast food and takeout.
The foodservice industry, which includes coffee shops and meal delivery services, is a major factor in the spread of disposable cutlery. As customers seek more convenient meal options, manufacturers are responding by producing lightweight, portable, as well as disposable utensils.
During the forecast period, the United Kingdom industry is likely to develop with a 2.90% CAGR. The increasing demand for environmentally friendly and sustainable solutions is the main driver of the disposable cutlery sector in the United Kingdom. Consumer demands for less plastic have led to a move towards compostable and biodegradable materials as environmental awareness has grown.
Laws and government programs encouraging the decrease of single use plastics further fuel this tendency. Using resources like sugarcane, bamboo, and cornstarch, manufacturers are coming up with innovative methods to provide environmentally friendly alternatives.
Sustainability is a major factor driving development in the disposable cutlery industry in the United Kingdom. This is because consumers have become more conscious of the adverse environmental impacts of using traditional plastic silverware and prefer it since it is more convenient.
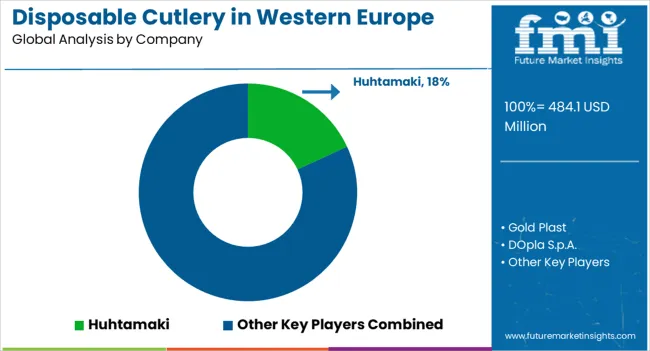
In order to increase revenues, existing companies and startups in the Western Europe disposable cutlery industry are concentrating on innovation and environmental sustainability. Many are making investments in environmentally friendly materials, like compostable substitutes or biodegradable plastics, in response to the increased demand from consumers for goods that are ecologically friendly.
Premium and aesthetic designs, partnerships with retail chains, and product diversity are popular approaches to stand out and gain market dominance. A dynamic market where firms strive to match changing customer tastes and contribute to lowering the ecological footprint for long-term profitability is reflected in the emphasis on aesthetics, convenience, and sustainability.
Recent Developments Observed in Western Europe Disposable Cutlery Ecosystem
Company | Product Portfolio |
---|---|
DOpla S.p.A. |
|
Attribute | Details |
---|---|
Estimated Industry Size in 2024 | USD 471.4 million |
Projected Industry Size in 2034 | USD 612.9 million |
Attributed CAGR between 2024 and 2034 | 2.70% |
Historical Analysis of Demand for disposable cutlery in Western Europe Countries | 2019 to 2023 |
Forecast Period | 2024 to 2034 |
Report Coverage | Industry size, industry trends, analysis of key factors influencing disposable cutlery in Western Europe, insights on global players and their industry strategy in Western Europe, ecosystem analysis of local and regional Western Europe providers |
Key Countries within Western Europe Analyzed while Studying Opportunities for disposable cutlery in Western Europe | The United Kingdom, Germany, Italy, France, Spain, Rest of Western Europe |
Key Companies Profiled | Huhtamaki; Gold Plast; DOpla S.p.A.; Anchor Packaging; Apollo Funds; Biopak; D&W Fine Pack; Dart Container Corporation; Hotpack Global; Pactiv Evergreen |
Table 1: Western Europe Industry Analysis and Outlook Value (US$ Million) Forecast by Country, 2019 to 2034
Table 2: Western Europe Industry Analysis and Outlook Volume (Units) Forecast by Country, 2019 to 2034
Table 3: Western Europe Industry Analysis and Outlook Value (US$ Million) Forecast by Product Type, 2019 to 2034
Table 4: Western Europe Industry Analysis and Outlook Volume (Units) Forecast by Product Type, 2019 to 2034
Table 5: Western Europe Industry Analysis and Outlook Value (US$ Million) Forecast by Fabrication Process, 2019 to 2034
Table 6: Western Europe Industry Analysis and Outlook Volume (Units) Forecast by Fabrication Process, 2019 to 2034
Table 7: Western Europe Industry Analysis and Outlook Value (US$ Million) Forecast by Cutlery Type, 2019 to 2034
Table 8: Western Europe Industry Analysis and Outlook Volume (Units) Forecast by Cutlery Type, 2019 to 2034
Table 9: Western Europe Industry Analysis and Outlook Value (US$ Million) Forecast by Sales Channel, 2019 to 2034
Table 10: Western Europe Industry Analysis and Outlook Volume (Units) Forecast by Sales Channel, 2019 to 2034
Table 11: Western Europe Industry Analysis and Outlook Value (US$ Million) Forecast by End Use, 2019 to 2034
Table 12: Western Europe Industry Analysis and Outlook Volume (Units) Forecast by End Use, 2019 to 2034
Table 13: UK Industry Analysis and Outlook Value (US$ Million) Forecast By Region, 2019 to 2034
Table 14: UK Industry Analysis and Outlook Volume (Units) Forecast By Region, 2019 to 2034
Table 15: UK Industry Analysis and Outlook Value (US$ Million) Forecast by Product Type, 2019 to 2034
Table 16: UK Industry Analysis and Outlook Volume (Units) Forecast by Product Type, 2019 to 2034
Table 17: UK Industry Analysis and Outlook Value (US$ Million) Forecast by Fabrication Process, 2019 to 2034
Table 18: UK Industry Analysis and Outlook Volume (Units) Forecast by Fabrication Process, 2019 to 2034
Table 19: UK Industry Analysis and Outlook Value (US$ Million) Forecast by Cutlery Type, 2019 to 2034
Table 20: UK Industry Analysis and Outlook Volume (Units) Forecast by Cutlery Type, 2019 to 2034
Table 21: UK Industry Analysis and Outlook Value (US$ Million) Forecast by Sales Channel, 2019 to 2034
Table 22: UK Industry Analysis and Outlook Volume (Units) Forecast by Sales Channel, 2019 to 2034
Table 23: UK Industry Analysis and Outlook Value (US$ Million) Forecast by End Use, 2019 to 2034
Table 24: UK Industry Analysis and Outlook Volume (Units) Forecast by End Use, 2019 to 2034
Table 25: Germany Industry Analysis and Outlook Value (US$ Million) Forecast By Region, 2019 to 2034
Table 26: Germany Industry Analysis and Outlook Volume (Units) Forecast By Region, 2019 to 2034
Table 27: Germany Industry Analysis and Outlook Value (US$ Million) Forecast by Product Type, 2019 to 2034
Table 28: Germany Industry Analysis and Outlook Volume (Units) Forecast by Product Type, 2019 to 2034
Table 29: Germany Industry Analysis and Outlook Value (US$ Million) Forecast by Fabrication Process, 2019 to 2034
Table 30: Germany Industry Analysis and Outlook Volume (Units) Forecast by Fabrication Process, 2019 to 2034
Table 31: Germany Industry Analysis and Outlook Value (US$ Million) Forecast by Cutlery Type, 2019 to 2034
Table 32: Germany Industry Analysis and Outlook Volume (Units) Forecast by Cutlery Type, 2019 to 2034
Table 33: Germany Industry Analysis and Outlook Value (US$ Million) Forecast by Sales Channel, 2019 to 2034
Table 34: Germany Industry Analysis and Outlook Volume (Units) Forecast by Sales Channel, 2019 to 2034
Table 35: Germany Industry Analysis and Outlook Value (US$ Million) Forecast by End Use, 2019 to 2034
Table 36: Germany Industry Analysis and Outlook Volume (Units) Forecast by End Use, 2019 to 2034
Table 37: Italy Industry Analysis and Outlook Value (US$ Million) Forecast By Region, 2019 to 2034
Table 38: Italy Industry Analysis and Outlook Volume (Units) Forecast By Region, 2019 to 2034
Table 39: Italy Industry Analysis and Outlook Value (US$ Million) Forecast by Product Type, 2019 to 2034
Table 40: Italy Industry Analysis and Outlook Volume (Units) Forecast by Product Type, 2019 to 2034
Table 41: Italy Industry Analysis and Outlook Value (US$ Million) Forecast by Fabrication Process, 2019 to 2034
Table 42: Italy Industry Analysis and Outlook Volume (Units) Forecast by Fabrication Process, 2019 to 2034
Table 43: Italy Industry Analysis and Outlook Value (US$ Million) Forecast by Cutlery Type, 2019 to 2034
Table 44: Italy Industry Analysis and Outlook Volume (Units) Forecast by Cutlery Type, 2019 to 2034
Table 45: Italy Industry Analysis and Outlook Value (US$ Million) Forecast by Sales Channel, 2019 to 2034
Table 46: Italy Industry Analysis and Outlook Volume (Units) Forecast by Sales Channel, 2019 to 2034
Table 47: Italy Industry Analysis and Outlook Value (US$ Million) Forecast by End Use, 2019 to 2034
Table 48: Italy Industry Analysis and Outlook Volume (Units) Forecast by End Use, 2019 to 2034
Table 49: France Industry Analysis and Outlook Value (US$ Million) Forecast By Region, 2019 to 2034
Table 50: France Industry Analysis and Outlook Volume (Units) Forecast By Region, 2019 to 2034
Table 51: France Industry Analysis and Outlook Value (US$ Million) Forecast by Product Type, 2019 to 2034
Table 52: France Industry Analysis and Outlook Volume (Units) Forecast by Product Type, 2019 to 2034
Table 53: France Industry Analysis and Outlook Value (US$ Million) Forecast by Fabrication Process, 2019 to 2034
Table 54: France Industry Analysis and Outlook Volume (Units) Forecast by Fabrication Process, 2019 to 2034
Table 55: France Industry Analysis and Outlook Value (US$ Million) Forecast by Cutlery Type, 2019 to 2034
Table 56: France Industry Analysis and Outlook Volume (Units) Forecast by Cutlery Type, 2019 to 2034
Table 57: France Industry Analysis and Outlook Value (US$ Million) Forecast by Sales Channel, 2019 to 2034
Table 58: France Industry Analysis and Outlook Volume (Units) Forecast by Sales Channel, 2019 to 2034
Table 59: France Industry Analysis and Outlook Value (US$ Million) Forecast by End Use, 2019 to 2034
Table 60: France Industry Analysis and Outlook Volume (Units) Forecast by End Use, 2019 to 2034
Table 61: Spain Industry Analysis and Outlook Value (US$ Million) Forecast By Region, 2019 to 2034
Table 62: Spain Industry Analysis and Outlook Volume (Units) Forecast By Region, 2019 to 2034
Table 63: Spain Industry Analysis and Outlook Value (US$ Million) Forecast by Product Type, 2019 to 2034
Table 64: Spain Industry Analysis and Outlook Volume (Units) Forecast by Product Type, 2019 to 2034
Table 65: Spain Industry Analysis and Outlook Value (US$ Million) Forecast by Fabrication Process, 2019 to 2034
Table 66: Spain Industry Analysis and Outlook Volume (Units) Forecast by Fabrication Process, 2019 to 2034
Table 67: Spain Industry Analysis and Outlook Value (US$ Million) Forecast by Cutlery Type, 2019 to 2034
Table 68: Spain Industry Analysis and Outlook Volume (Units) Forecast by Cutlery Type, 2019 to 2034
Table 69: Spain Industry Analysis and Outlook Value (US$ Million) Forecast by Sales Channel, 2019 to 2034
Table 70: Spain Industry Analysis and Outlook Volume (Units) Forecast by Sales Channel, 2019 to 2034
Table 71: Spain Industry Analysis and Outlook Value (US$ Million) Forecast by End Use, 2019 to 2034
Table 72: Spain Industry Analysis and Outlook Volume (Units) Forecast by End Use, 2019 to 2034
Table 73: Rest of Western Europe Industry Analysis and Outlook Value (US$ Million) Forecast by Product Type, 2019 to 2034
Table 74: Rest of Western Europe Industry Analysis and Outlook Volume (Units) Forecast by Product Type, 2019 to 2034
Table 75: Rest of Western Europe Industry Analysis and Outlook Value (US$ Million) Forecast by Fabrication Process, 2019 to 2034
Table 76: Rest of Western Europe Industry Analysis and Outlook Volume (Units) Forecast by Fabrication Process, 2019 to 2034
Table 77: Rest of Western Europe Industry Analysis and Outlook Value (US$ Million) Forecast by Cutlery Type, 2019 to 2034
Table 78: Rest of Western Europe Industry Analysis and Outlook Volume (Units) Forecast by Cutlery Type, 2019 to 2034
Table 79: Rest of Western Europe Industry Analysis and Outlook Value (US$ Million) Forecast by Sales Channel, 2019 to 2034
Table 80: Rest of Western Europe Industry Analysis and Outlook Volume (Units) Forecast by Sales Channel, 2019 to 2034
Table 81: Rest of Western Europe Industry Analysis and Outlook Value (US$ Million) Forecast by End Use, 2019 to 2034
Table 82: Rest of Western Europe Industry Analysis and Outlook Volume (Units) Forecast by End Use, 2019 to 2034
Figure 1: Western Europe Industry Analysis and Outlook Value (US$ Million) by Product Type, 2024 to 2034
Figure 2: Western Europe Industry Analysis and Outlook Value (US$ Million) by Fabrication Process, 2024 to 2034
Figure 3: Western Europe Industry Analysis and Outlook Value (US$ Million) by Cutlery Type, 2024 to 2034
Figure 4: Western Europe Industry Analysis and Outlook Value (US$ Million) by Sales Channel, 2024 to 2034
Figure 5: Western Europe Industry Analysis and Outlook Value (US$ Million) by End Use, 2024 to 2034
Figure 6: Western Europe Industry Analysis and Outlook Value (US$ Million) by Country, 2024 to 2034
Figure 7: Western Europe Industry Analysis and Outlook Value (US$ Million) Analysis by Country, 2019 to 2034
Figure 8: Western Europe Industry Analysis and Outlook Volume (Units) Analysis by Country, 2019 to 2034
Figure 9: Western Europe Industry Analysis and Outlook Value Share (%) and BPS Analysis by Country, 2024 to 2034
Figure 10: Western Europe Industry Analysis and Outlook Y-o-Y Growth (%) Projections by Country, 2024 to 2034
Figure 11: Western Europe Industry Analysis and Outlook Value (US$ Million) Analysis by Product Type, 2019 to 2034
Figure 12: Western Europe Industry Analysis and Outlook Volume (Units) Analysis by Product Type, 2019 to 2034
Figure 13: Western Europe Industry Analysis and Outlook Value Share (%) and BPS Analysis by Product Type, 2024 to 2034
Figure 14: Western Europe Industry Analysis and Outlook Y-o-Y Growth (%) Projections by Product Type, 2024 to 2034
Figure 15: Western Europe Industry Analysis and Outlook Value (US$ Million) Analysis by Fabrication Process, 2019 to 2034
Figure 16: Western Europe Industry Analysis and Outlook Volume (Units) Analysis by Fabrication Process, 2019 to 2034
Figure 17: Western Europe Industry Analysis and Outlook Value Share (%) and BPS Analysis by Fabrication Process, 2024 to 2034
Figure 18: Western Europe Industry Analysis and Outlook Y-o-Y Growth (%) Projections by Fabrication Process, 2024 to 2034
Figure 19: Western Europe Industry Analysis and Outlook Value (US$ Million) Analysis by Cutlery Type, 2019 to 2034
Figure 20: Western Europe Industry Analysis and Outlook Volume (Units) Analysis by Cutlery Type, 2019 to 2034
Figure 21: Western Europe Industry Analysis and Outlook Value Share (%) and BPS Analysis by Cutlery Type, 2024 to 2034
Figure 22: Western Europe Industry Analysis and Outlook Y-o-Y Growth (%) Projections by Cutlery Type, 2024 to 2034
Figure 23: Western Europe Industry Analysis and Outlook Value (US$ Million) Analysis by Sales Channel, 2019 to 2034
Figure 24: Western Europe Industry Analysis and Outlook Volume (Units) Analysis by Sales Channel, 2019 to 2034
Figure 25: Western Europe Industry Analysis and Outlook Value Share (%) and BPS Analysis by Sales Channel, 2024 to 2034
Figure 26: Western Europe Industry Analysis and Outlook Y-o-Y Growth (%) Projections by Sales Channel, 2024 to 2034
Figure 27: Western Europe Industry Analysis and Outlook Value (US$ Million) Analysis by End Use, 2019 to 2034
Figure 28: Western Europe Industry Analysis and Outlook Volume (Units) Analysis by End Use, 2019 to 2034
Figure 29: Western Europe Industry Analysis and Outlook Value Share (%) and BPS Analysis by End Use, 2024 to 2034
Figure 30: Western Europe Industry Analysis and Outlook Y-o-Y Growth (%) Projections by End Use, 2024 to 2034
Figure 31: Western Europe Industry Analysis and Outlook Attractiveness by Product Type, 2024 to 2034
Figure 32: Western Europe Industry Analysis and Outlook Attractiveness by Fabrication Process, 2024 to 2034
Figure 33: Western Europe Industry Analysis and Outlook Attractiveness by Cutlery Type, 2024 to 2034
Figure 34: Western Europe Industry Analysis and Outlook Attractiveness by Sales Channel, 2024 to 2034
Figure 35: Western Europe Industry Analysis and Outlook Attractiveness by End Use, 2024 to 2034
Figure 36: Western Europe Industry Analysis and Outlook Attractiveness by Region, 2024 to 2034
Figure 37: UK Industry Analysis and Outlook Value (US$ Million) by Product Type, 2024 to 2034
Figure 38: UK Industry Analysis and Outlook Value (US$ Million) by Fabrication Process, 2024 to 2034
Figure 39: UK Industry Analysis and Outlook Value (US$ Million) by Cutlery Type, 2024 to 2034
Figure 40: UK Industry Analysis and Outlook Value (US$ Million) by Sales Channel, 2024 to 2034
Figure 41: UK Industry Analysis and Outlook Value (US$ Million) by End Use, 2024 to 2034
Figure 42: UK Industry Analysis and Outlook Value (US$ Million) By Region, 2024 to 2034
Figure 43: UK Industry Analysis and Outlook Value (US$ Million) Analysis By Region, 2019 to 2034
Figure 44: UK Industry Analysis and Outlook Volume (Units) Analysis By Region, 2019 to 2034
Figure 45: UK Industry Analysis and Outlook Value Share (%) and BPS Analysis By Region, 2024 to 2034
Figure 46: UK Industry Analysis and Outlook Y-o-Y Growth (%) Projections By Region, 2024 to 2034
Figure 47: UK Industry Analysis and Outlook Value (US$ Million) Analysis by Product Type, 2019 to 2034
Figure 48: UK Industry Analysis and Outlook Volume (Units) Analysis by Product Type, 2019 to 2034
Figure 49: UK Industry Analysis and Outlook Value Share (%) and BPS Analysis by Product Type, 2024 to 2034
Figure 50: UK Industry Analysis and Outlook Y-o-Y Growth (%) Projections by Product Type, 2024 to 2034
Figure 51: UK Industry Analysis and Outlook Value (US$ Million) Analysis by Fabrication Process, 2019 to 2034
Figure 52: UK Industry Analysis and Outlook Volume (Units) Analysis by Fabrication Process, 2019 to 2034
Figure 53: UK Industry Analysis and Outlook Value Share (%) and BPS Analysis by Fabrication Process, 2024 to 2034
Figure 54: UK Industry Analysis and Outlook Y-o-Y Growth (%) Projections by Fabrication Process, 2024 to 2034
Figure 55: UK Industry Analysis and Outlook Value (US$ Million) Analysis by Cutlery Type, 2019 to 2034
Figure 56: UK Industry Analysis and Outlook Volume (Units) Analysis by Cutlery Type, 2019 to 2034
Figure 57: UK Industry Analysis and Outlook Value Share (%) and BPS Analysis by Cutlery Type, 2024 to 2034
Figure 58: UK Industry Analysis and Outlook Y-o-Y Growth (%) Projections by Cutlery Type, 2024 to 2034
Figure 59: UK Industry Analysis and Outlook Value (US$ Million) Analysis by Sales Channel, 2019 to 2034
Figure 60: UK Industry Analysis and Outlook Volume (Units) Analysis by Sales Channel, 2019 to 2034
Figure 61: UK Industry Analysis and Outlook Value Share (%) and BPS Analysis by Sales Channel, 2024 to 2034
Figure 62: UK Industry Analysis and Outlook Y-o-Y Growth (%) Projections by Sales Channel, 2024 to 2034
Figure 63: UK Industry Analysis and Outlook Value (US$ Million) Analysis by End Use, 2019 to 2034
Figure 64: UK Industry Analysis and Outlook Volume (Units) Analysis by End Use, 2019 to 2034
Figure 65: UK Industry Analysis and Outlook Value Share (%) and BPS Analysis by End Use, 2024 to 2034
Figure 66: UK Industry Analysis and Outlook Y-o-Y Growth (%) Projections by End Use, 2024 to 2034
Figure 67: UK Industry Analysis and Outlook Attractiveness by Product Type, 2024 to 2034
Figure 68: UK Industry Analysis and Outlook Attractiveness by Fabrication Process, 2024 to 2034
Figure 69: UK Industry Analysis and Outlook Attractiveness by Cutlery Type, 2024 to 2034
Figure 70: UK Industry Analysis and Outlook Attractiveness by Sales Channel, 2024 to 2034
Figure 71: UK Industry Analysis and Outlook Attractiveness by End Use, 2024 to 2034
Figure 72: UK Industry Analysis and Outlook Attractiveness By Region, 2024 to 2034
Figure 73: Germany Industry Analysis and Outlook Value (US$ Million) by Product Type, 2024 to 2034
Figure 74: Germany Industry Analysis and Outlook Value (US$ Million) by Fabrication Process, 2024 to 2034
Figure 75: Germany Industry Analysis and Outlook Value (US$ Million) by Cutlery Type, 2024 to 2034
Figure 76: Germany Industry Analysis and Outlook Value (US$ Million) by Sales Channel, 2024 to 2034
Figure 77: Germany Industry Analysis and Outlook Value (US$ Million) by End Use, 2024 to 2034
Figure 78: Germany Industry Analysis and Outlook Value (US$ Million) By Region, 2024 to 2034
Figure 79: Germany Industry Analysis and Outlook Value (US$ Million) Analysis By Region, 2019 to 2034
Figure 80: Germany Industry Analysis and Outlook Volume (Units) Analysis By Region, 2019 to 2034
Figure 81: Germany Industry Analysis and Outlook Value Share (%) and BPS Analysis By Region, 2024 to 2034
Figure 82: Germany Industry Analysis and Outlook Y-o-Y Growth (%) Projections By Region, 2024 to 2034
Figure 83: Germany Industry Analysis and Outlook Value (US$ Million) Analysis by Product Type, 2019 to 2034
Figure 84: Germany Industry Analysis and Outlook Volume (Units) Analysis by Product Type, 2019 to 2034
Figure 85: Germany Industry Analysis and Outlook Value Share (%) and BPS Analysis by Product Type, 2024 to 2034
Figure 86: Germany Industry Analysis and Outlook Y-o-Y Growth (%) Projections by Product Type, 2024 to 2034
Figure 87: Germany Industry Analysis and Outlook Value (US$ Million) Analysis by Fabrication Process, 2019 to 2034
Figure 88: Germany Industry Analysis and Outlook Volume (Units) Analysis by Fabrication Process, 2019 to 2034
Figure 89: Germany Industry Analysis and Outlook Value Share (%) and BPS Analysis by Fabrication Process, 2024 to 2034
Figure 90: Germany Industry Analysis and Outlook Y-o-Y Growth (%) Projections by Fabrication Process, 2024 to 2034
Figure 91: Germany Industry Analysis and Outlook Value (US$ Million) Analysis by Cutlery Type, 2019 to 2034
Figure 92: Germany Industry Analysis and Outlook Volume (Units) Analysis by Cutlery Type, 2019 to 2034
Figure 93: Germany Industry Analysis and Outlook Value Share (%) and BPS Analysis by Cutlery Type, 2024 to 2034
Figure 94: Germany Industry Analysis and Outlook Y-o-Y Growth (%) Projections by Cutlery Type, 2024 to 2034
Figure 95: Germany Industry Analysis and Outlook Value (US$ Million) Analysis by Sales Channel, 2019 to 2034
Figure 96: Germany Industry Analysis and Outlook Volume (Units) Analysis by Sales Channel, 2019 to 2034
Figure 97: Germany Industry Analysis and Outlook Value Share (%) and BPS Analysis by Sales Channel, 2024 to 2034
Figure 98: Germany Industry Analysis and Outlook Y-o-Y Growth (%) Projections by Sales Channel, 2024 to 2034
Figure 99: Germany Industry Analysis and Outlook Value (US$ Million) Analysis by End Use, 2019 to 2034
Figure 100: Germany Industry Analysis and Outlook Volume (Units) Analysis by End Use, 2019 to 2034
Figure 101: Germany Industry Analysis and Outlook Value Share (%) and BPS Analysis by End Use, 2024 to 2034
Figure 102: Germany Industry Analysis and Outlook Y-o-Y Growth (%) Projections by End Use, 2024 to 2034
Figure 103: Germany Industry Analysis and Outlook Attractiveness by Product Type, 2024 to 2034
Figure 104: Germany Industry Analysis and Outlook Attractiveness by Fabrication Process, 2024 to 2034
Figure 105: Germany Industry Analysis and Outlook Attractiveness by Cutlery Type, 2024 to 2034
Figure 106: Germany Industry Analysis and Outlook Attractiveness by Sales Channel, 2024 to 2034
Figure 107: Germany Industry Analysis and Outlook Attractiveness by End Use, 2024 to 2034
Figure 108: Germany Industry Analysis and Outlook Attractiveness By Region, 2024 to 2034
Figure 109: Italy Industry Analysis and Outlook Value (US$ Million) by Product Type, 2024 to 2034
Figure 110: Italy Industry Analysis and Outlook Value (US$ Million) by Fabrication Process, 2024 to 2034
Figure 111: Italy Industry Analysis and Outlook Value (US$ Million) by Cutlery Type, 2024 to 2034
Figure 112: Italy Industry Analysis and Outlook Value (US$ Million) by Sales Channel, 2024 to 2034
Figure 113: Italy Industry Analysis and Outlook Value (US$ Million) by End Use, 2024 to 2034
Figure 114: Italy Industry Analysis and Outlook Value (US$ Million) By Region, 2024 to 2034
Figure 115: Italy Industry Analysis and Outlook Value (US$ Million) Analysis By Region, 2019 to 2034
Figure 116: Italy Industry Analysis and Outlook Volume (Units) Analysis By Region, 2019 to 2034
Figure 117: Italy Industry Analysis and Outlook Value Share (%) and BPS Analysis By Region, 2024 to 2034
Figure 118: Italy Industry Analysis and Outlook Y-o-Y Growth (%) Projections By Region, 2024 to 2034
Figure 119: Italy Industry Analysis and Outlook Value (US$ Million) Analysis by Product Type, 2019 to 2034
Figure 120: Italy Industry Analysis and Outlook Volume (Units) Analysis by Product Type, 2019 to 2034
Figure 121: Italy Industry Analysis and Outlook Value Share (%) and BPS Analysis by Product Type, 2024 to 2034
Figure 122: Italy Industry Analysis and Outlook Y-o-Y Growth (%) Projections by Product Type, 2024 to 2034
Figure 123: Italy Industry Analysis and Outlook Value (US$ Million) Analysis by Fabrication Process, 2019 to 2034
Figure 124: Italy Industry Analysis and Outlook Volume (Units) Analysis by Fabrication Process, 2019 to 2034
Figure 125: Italy Industry Analysis and Outlook Value Share (%) and BPS Analysis by Fabrication Process, 2024 to 2034
Figure 126: Italy Industry Analysis and Outlook Y-o-Y Growth (%) Projections by Fabrication Process, 2024 to 2034
Figure 127: Italy Industry Analysis and Outlook Value (US$ Million) Analysis by Cutlery Type, 2019 to 2034
Figure 128: Italy Industry Analysis and Outlook Volume (Units) Analysis by Cutlery Type, 2019 to 2034
Figure 129: Italy Industry Analysis and Outlook Value Share (%) and BPS Analysis by Cutlery Type, 2024 to 2034
Figure 130: Italy Industry Analysis and Outlook Y-o-Y Growth (%) Projections by Cutlery Type, 2024 to 2034
Figure 131: Italy Industry Analysis and Outlook Value (US$ Million) Analysis by Sales Channel, 2019 to 2034
Figure 132: Italy Industry Analysis and Outlook Volume (Units) Analysis by Sales Channel, 2019 to 2034
Figure 133: Italy Industry Analysis and Outlook Value Share (%) and BPS Analysis by Sales Channel, 2024 to 2034
Figure 134: Italy Industry Analysis and Outlook Y-o-Y Growth (%) Projections by Sales Channel, 2024 to 2034
Figure 135: Italy Industry Analysis and Outlook Value (US$ Million) Analysis by End Use, 2019 to 2034
Figure 136: Italy Industry Analysis and Outlook Volume (Units) Analysis by End Use, 2019 to 2034
Figure 137: Italy Industry Analysis and Outlook Value Share (%) and BPS Analysis by End Use, 2024 to 2034
Figure 138: Italy Industry Analysis and Outlook Y-o-Y Growth (%) Projections by End Use, 2024 to 2034
Figure 139: Italy Industry Analysis and Outlook Attractiveness by Product Type, 2024 to 2034
Figure 140: Italy Industry Analysis and Outlook Attractiveness by Fabrication Process, 2024 to 2034
Figure 141: Italy Industry Analysis and Outlook Attractiveness by Cutlery Type, 2024 to 2034
Figure 142: Italy Industry Analysis and Outlook Attractiveness by Sales Channel, 2024 to 2034
Figure 143: Italy Industry Analysis and Outlook Attractiveness by End Use, 2024 to 2034
Figure 144: Italy Industry Analysis and Outlook Attractiveness By Region, 2024 to 2034
Figure 145: France Industry Analysis and Outlook Value (US$ Million) by Product Type, 2024 to 2034
Figure 146: France Industry Analysis and Outlook Value (US$ Million) by Fabrication Process, 2024 to 2034
Figure 147: France Industry Analysis and Outlook Value (US$ Million) by Cutlery Type, 2024 to 2034
Figure 148: France Industry Analysis and Outlook Value (US$ Million) by Sales Channel, 2024 to 2034
Figure 149: France Industry Analysis and Outlook Value (US$ Million) by End Use, 2024 to 2034
Figure 150: France Industry Analysis and Outlook Value (US$ Million) By Region, 2024 to 2034
Figure 151: France Industry Analysis and Outlook Value (US$ Million) Analysis By Region, 2019 to 2034
Figure 152: France Industry Analysis and Outlook Volume (Units) Analysis By Region, 2019 to 2034
Figure 153: France Industry Analysis and Outlook Value Share (%) and BPS Analysis By Region, 2024 to 2034
Figure 154: France Industry Analysis and Outlook Y-o-Y Growth (%) Projections By Region, 2024 to 2034
Figure 155: France Industry Analysis and Outlook Value (US$ Million) Analysis by Product Type, 2019 to 2034
Figure 156: France Industry Analysis and Outlook Volume (Units) Analysis by Product Type, 2019 to 2034
Figure 157: France Industry Analysis and Outlook Value Share (%) and BPS Analysis by Product Type, 2024 to 2034
Figure 158: France Industry Analysis and Outlook Y-o-Y Growth (%) Projections by Product Type, 2024 to 2034
Figure 159: France Industry Analysis and Outlook Value (US$ Million) Analysis by Fabrication Process, 2019 to 2034
Figure 160: France Industry Analysis and Outlook Volume (Units) Analysis by Fabrication Process, 2019 to 2034
Figure 161: France Industry Analysis and Outlook Value Share (%) and BPS Analysis by Fabrication Process, 2024 to 2034
Figure 162: France Industry Analysis and Outlook Y-o-Y Growth (%) Projections by Fabrication Process, 2024 to 2034
Figure 163: France Industry Analysis and Outlook Value (US$ Million) Analysis by Cutlery Type, 2019 to 2034
Figure 164: France Industry Analysis and Outlook Volume (Units) Analysis by Cutlery Type, 2019 to 2034
Figure 165: France Industry Analysis and Outlook Value Share (%) and BPS Analysis by Cutlery Type, 2024 to 2034
Figure 166: France Industry Analysis and Outlook Y-o-Y Growth (%) Projections by Cutlery Type, 2024 to 2034
Figure 167: France Industry Analysis and Outlook Value (US$ Million) Analysis by Sales Channel, 2019 to 2034
Figure 168: France Industry Analysis and Outlook Volume (Units) Analysis by Sales Channel, 2019 to 2034
Figure 169: France Industry Analysis and Outlook Value Share (%) and BPS Analysis by Sales Channel, 2024 to 2034
Figure 170: France Industry Analysis and Outlook Y-o-Y Growth (%) Projections by Sales Channel, 2024 to 2034
Figure 171: France Industry Analysis and Outlook Value (US$ Million) Analysis by End Use, 2019 to 2034
Figure 172: France Industry Analysis and Outlook Volume (Units) Analysis by End Use, 2019 to 2034
Figure 173: France Industry Analysis and Outlook Value Share (%) and BPS Analysis by End Use, 2024 to 2034
Figure 174: France Industry Analysis and Outlook Y-o-Y Growth (%) Projections by End Use, 2024 to 2034
Figure 175: France Industry Analysis and Outlook Attractiveness by Product Type, 2024 to 2034
Figure 176: France Industry Analysis and Outlook Attractiveness by Fabrication Process, 2024 to 2034
Figure 177: France Industry Analysis and Outlook Attractiveness by Cutlery Type, 2024 to 2034
Figure 178: France Industry Analysis and Outlook Attractiveness by Sales Channel, 2024 to 2034
Figure 179: France Industry Analysis and Outlook Attractiveness by End Use, 2024 to 2034
Figure 180: France Industry Analysis and Outlook Attractiveness By Region, 2024 to 2034
Figure 181: Spain Industry Analysis and Outlook Value (US$ Million) by Product Type, 2024 to 2034
Figure 182: Spain Industry Analysis and Outlook Value (US$ Million) by Fabrication Process, 2024 to 2034
Figure 183: Spain Industry Analysis and Outlook Value (US$ Million) by Cutlery Type, 2024 to 2034
Figure 184: Spain Industry Analysis and Outlook Value (US$ Million) by Sales Channel, 2024 to 2034
Figure 185: Spain Industry Analysis and Outlook Value (US$ Million) by End Use, 2024 to 2034
Figure 186: Spain Industry Analysis and Outlook Value (US$ Million) By Region, 2024 to 2034
Figure 187: Spain Industry Analysis and Outlook Value (US$ Million) Analysis By Region, 2019 to 2034
Figure 188: Spain Industry Analysis and Outlook Volume (Units) Analysis By Region, 2019 to 2034
Figure 189: Spain Industry Analysis and Outlook Value Share (%) and BPS Analysis By Region, 2024 to 2034
Figure 190: Spain Industry Analysis and Outlook Y-o-Y Growth (%) Projections By Region, 2024 to 2034
Figure 191: Spain Industry Analysis and Outlook Value (US$ Million) Analysis by Product Type, 2019 to 2034
Figure 192: Spain Industry Analysis and Outlook Volume (Units) Analysis by Product Type, 2019 to 2034
Figure 193: Spain Industry Analysis and Outlook Value Share (%) and BPS Analysis by Product Type, 2024 to 2034
Figure 194: Spain Industry Analysis and Outlook Y-o-Y Growth (%) Projections by Product Type, 2024 to 2034
Figure 195: Spain Industry Analysis and Outlook Value (US$ Million) Analysis by Fabrication Process, 2019 to 2034
Figure 196: Spain Industry Analysis and Outlook Volume (Units) Analysis by Fabrication Process, 2019 to 2034
Figure 197: Spain Industry Analysis and Outlook Value Share (%) and BPS Analysis by Fabrication Process, 2024 to 2034
Figure 198: Spain Industry Analysis and Outlook Y-o-Y Growth (%) Projections by Fabrication Process, 2024 to 2034
Figure 199: Spain Industry Analysis and Outlook Value (US$ Million) Analysis by Cutlery Type, 2019 to 2034
Figure 200: Spain Industry Analysis and Outlook Volume (Units) Analysis by Cutlery Type, 2019 to 2034
Figure 201: Spain Industry Analysis and Outlook Value Share (%) and BPS Analysis by Cutlery Type, 2024 to 2034
Figure 202: Spain Industry Analysis and Outlook Y-o-Y Growth (%) Projections by Cutlery Type, 2024 to 2034
Figure 203: Spain Industry Analysis and Outlook Value (US$ Million) Analysis by Sales Channel, 2019 to 2034
Figure 204: Spain Industry Analysis and Outlook Volume (Units) Analysis by Sales Channel, 2019 to 2034
Figure 205: Spain Industry Analysis and Outlook Value Share (%) and BPS Analysis by Sales Channel, 2024 to 2034
Figure 206: Spain Industry Analysis and Outlook Y-o-Y Growth (%) Projections by Sales Channel, 2024 to 2034
Figure 207: Spain Industry Analysis and Outlook Value (US$ Million) Analysis by End Use, 2019 to 2034
Figure 208: Spain Industry Analysis and Outlook Volume (Units) Analysis by End Use, 2019 to 2034
Figure 209: Spain Industry Analysis and Outlook Value Share (%) and BPS Analysis by End Use, 2024 to 2034
Figure 210: Spain Industry Analysis and Outlook Y-o-Y Growth (%) Projections by End Use, 2024 to 2034
Figure 211: Spain Industry Analysis and Outlook Attractiveness by Product Type, 2024 to 2034
Figure 212: Spain Industry Analysis and Outlook Attractiveness by Fabrication Process, 2024 to 2034
Figure 213: Spain Industry Analysis and Outlook Attractiveness by Cutlery Type, 2024 to 2034
Figure 214: Spain Industry Analysis and Outlook Attractiveness by Sales Channel, 2024 to 2034
Figure 215: Spain Industry Analysis and Outlook Attractiveness by End Use, 2024 to 2034
Figure 216: Spain Industry Analysis and Outlook Attractiveness By Region, 2024 to 2034
Figure 217: Rest of Western Europe Industry Analysis and Outlook Value (US$ Million) by Product Type, 2024 to 2034
Figure 218: Rest of Western Europe Industry Analysis and Outlook Value (US$ Million) by Fabrication Process, 2024 to 2034
Figure 219: Rest of Western Europe Industry Analysis and Outlook Value (US$ Million) by Cutlery Type, 2024 to 2034
Figure 220: Rest of Western Europe Industry Analysis and Outlook Value (US$ Million) by Sales Channel, 2024 to 2034
Figure 221: Rest of Western Europe Industry Analysis and Outlook Value (US$ Million) by End Use, 2024 to 2034
Figure 222: Rest of Western Europe Industry Analysis and Outlook Value (US$ Million) Analysis by Product Type, 2019 to 2034
Figure 223: Rest of Western Europe Industry Analysis and Outlook Volume (Units) Analysis by Product Type, 2019 to 2034
Figure 224: Rest of Western Europe Industry Analysis and Outlook Value Share (%) and BPS Analysis by Product Type, 2024 to 2034
Figure 225: Rest of Western Europe Industry Analysis and Outlook Y-o-Y Growth (%) Projections by Product Type, 2024 to 2034
Figure 226: Rest of Western Europe Industry Analysis and Outlook Value (US$ Million) Analysis by Fabrication Process, 2019 to 2034
Figure 227: Rest of Western Europe Industry Analysis and Outlook Volume (Units) Analysis by Fabrication Process, 2019 to 2034
Figure 228: Rest of Western Europe Industry Analysis and Outlook Value Share (%) and BPS Analysis by Fabrication Process, 2024 to 2034
Figure 229: Rest of Western Europe Industry Analysis and Outlook Y-o-Y Growth (%) Projections by Fabrication Process, 2024 to 2034
Figure 230: Rest of Western Europe Industry Analysis and Outlook Value (US$ Million) Analysis by Cutlery Type, 2019 to 2034
Figure 231: Rest of Western Europe Industry Analysis and Outlook Volume (Units) Analysis by Cutlery Type, 2019 to 2034
Figure 232: Rest of Western Europe Industry Analysis and Outlook Value Share (%) and BPS Analysis by Cutlery Type, 2024 to 2034
Figure 233: Rest of Western Europe Industry Analysis and Outlook Y-o-Y Growth (%) Projections by Cutlery Type, 2024 to 2034
Figure 234: Rest of Western Europe Industry Analysis and Outlook Value (US$ Million) Analysis by Sales Channel, 2019 to 2034
Figure 235: Rest of Western Europe Industry Analysis and Outlook Volume (Units) Analysis by Sales Channel, 2019 to 2034
Figure 236: Rest of Western Europe Industry Analysis and Outlook Value Share (%) and BPS Analysis by Sales Channel, 2024 to 2034
Figure 237: Rest of Western Europe Industry Analysis and Outlook Y-o-Y Growth (%) Projections by Sales Channel, 2024 to 2034
Figure 238: Rest of Western Europe Industry Analysis and Outlook Value (US$ Million) Analysis by End Use, 2019 to 2034
Figure 239: Rest of Western Europe Industry Analysis and Outlook Volume (Units) Analysis by End Use, 2019 to 2034
Figure 240: Rest of Western Europe Industry Analysis and Outlook Value Share (%) and BPS Analysis by End Use, 2024 to 2034
Figure 241: Rest of Western Europe Industry Analysis and Outlook Y-o-Y Growth (%) Projections by End Use, 2024 to 2034
Figure 242: Rest of Western Europe Industry Analysis and Outlook Attractiveness by Product Type, 2024 to 2034
Figure 243: Rest of Western Europe Industry Analysis and Outlook Attractiveness by Fabrication Process, 2024 to 2034
Figure 244: Rest of Western Europe Industry Analysis and Outlook Attractiveness by Cutlery Type, 2024 to 2034
Figure 245: Rest of Western Europe Industry Analysis and Outlook Attractiveness by Sales Channel, 2024 to 2034
Figure 246: Rest of Western Europe Industry Analysis and Outlook Attractiveness by End Use, 2024 to 2034
The sales of disposable cutlery are poised to reach USD 471.4 million by 2024 in Western Europe.
In 2034, the total value of the disposable cutlery industry in Western Europe is predicted to reach USD 612.9 million.
From 2024 to 2034, the Western Europe disposable cutlery industry is likely to garner a 2.70% CAGR.
The spoon segment is likely to account for a 58.20% revenue share in 2024.
Explore Function-driven Packaging Insights
Thank you!
You will receive an email from our Business Development Manager. Please be sure to check your SPAM/JUNK folder too.