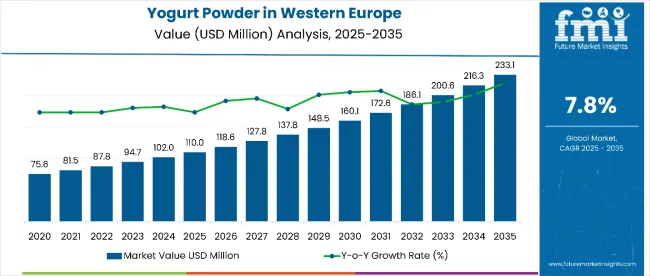
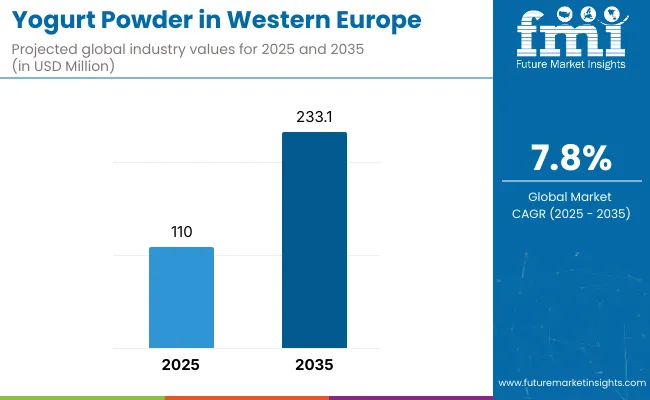
Sales of yogurt powder in Western Europe are estimated at USD 110 million in 2025, with projections indicating a rise to USD 233.1 million by 2035, reflecting a CAGR of approximately 7.8% over the forecast period. This growth reflects both expanding applications across food industries and increased consumer preference for convenient dairy alternatives.
| Metric | Value |
|---|---|
| Estimated Size (2025E) | USD 110 million |
| Projected Value (2035F) | USD 233.1 million |
| CAGR (2025 to 2035) | 7.8% |
The rise in demand is linked to growing health consciousness, expanding food processing capabilities, and evolving culinary trends across European nations. By 2025, per capita consumption in leading Western European countries such as Italy, Netherlands, and France averages between 0.8 to 1.2 kilograms, with projections reaching 1.6 kilograms by 2035.
Italy leads among European countries, expected to generate USD 58 million in yogurt powder sales by 2035, followed by Netherlands (USD 46.9 million), France (USD 42 million), United Kingdom (USD 38 million), and Germany (USD 47.2 million).
The largest contribution to demand continues to come from skimmed yogurt powder formulations, which are expected to account for 59% of total sales in 2025, owing to health-conscious consumer preferences, reduced calorie content, and versatile application properties. By flavor profile, regular flavor represents the dominant segment, responsible for 78.6% of all sales, while flavored variants including fruit and specialty options are expanding steadily.
Consumer adoption is particularly concentrated among food manufacturers, bakeries, and beverage producers seeking shelf-stable dairy alternatives, with convenience and functionality emerging as significant drivers of demand. While premium positioning supports value growth, the expanding application scope across food processing and household consumption continues to drive volume expansion.
Regional disparities persist, but per capita demand in emerging yogurt powder consumption countries is narrowing the gap with established dairy processing hubs in Northern and Central Europe.
The yogurt powder segment in Western Europe is classified into several segments. By product type, the key categories include skimmed, semi-skimmed, and whole yogurt powder formulations. By nature, the segment spans organic and conventional processing approaches. By flavor profile, formulations include regular, berries, vanilla, chocolate, peach, mango, banana, apple, and specialty blends.
By application, the segment covers food processing, beverages, and cosmetics and personal care uses. By end use, categories include household consumption, HoReCa (hotels, restaurants, cafes), and industrial processing. By distribution channel, the segment spans B2B sales, retail channels, online platforms, and specialty food stores. By region, countries such as United Kingdom, Germany, France, BENELUX, Sweden, Norway, Denmark, Italy and rest of the Europe.
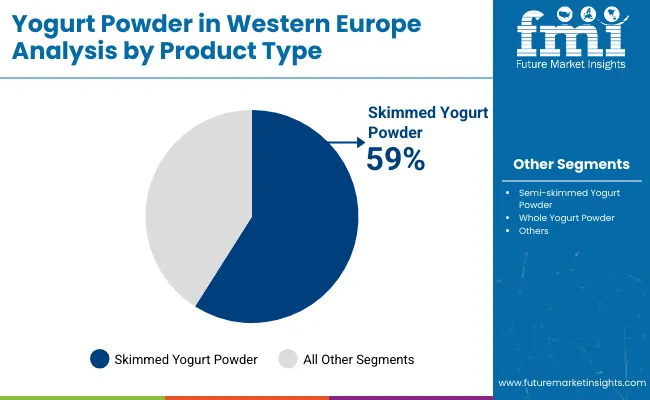
Skimmed yogurt powder formulations are projected to dominate sales in 2025, supported by health-conscious consumer trends, reduced fat content appeal, and versatile processing applications. Other variants such as semi-skimmed and whole powder formats are growing steadily, each serving distinct nutritional and functional requirements.
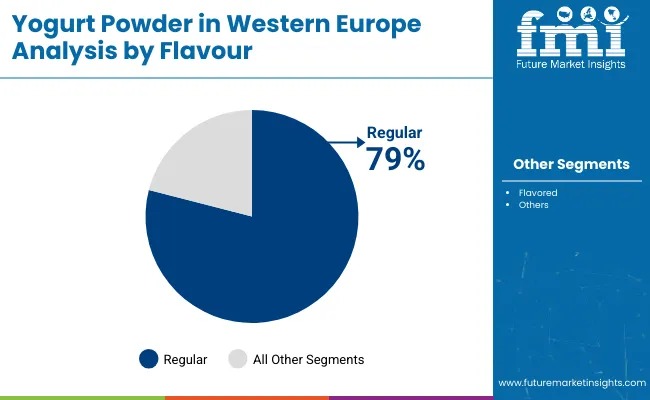
Yogurt powder applications in Western Europe encompass diverse flavor profiles catering to varying consumer preferences and industrial applications. Regular flavor formulations are expected to remain the primary segment in 2025, followed by fruit-flavored and specialty variants. Flavor preferences are evolving to match regional taste trends and application-specific requirements.
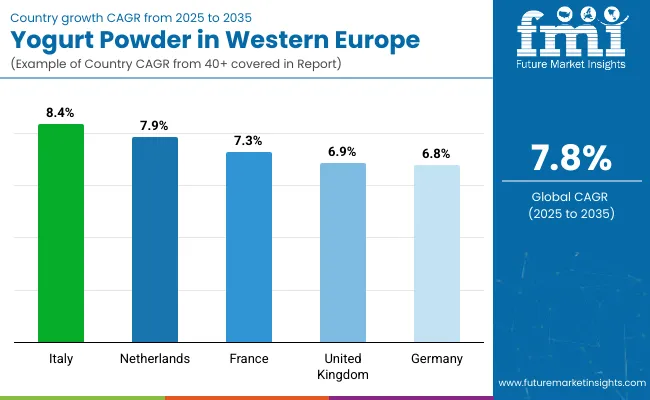
Yogurt powder sales will not grow uniformly across every European nation. Rising culinary innovation and food processing capabilities in Italy and Netherlands provide these countries with a measurable advantage, while other established European food production centers expand more steadily from varying baseline consumption levels. The table below shows the compound annual growth rate (CAGR) each of the five largest countries is expected to record between 2025 and 2035.
| Country | CAGR (2025 to 2035) |
|---|---|
| Italy | 8.4% |
| Netherlands | 7.9% |
| France | 7.3% |
| United Kingdom | 6.9% |
| Germany | 6.8% |
Between 2025 and 2035, demand for yogurt powder is projected to expand across all major Western European countries, but the pace of growth will vary based on food processing innovation, culinary culture, and industrial capabilities. Among the top five countries analyzed, Italy and Netherlands are expected to register the fastest compound annual growth rates of 8.4% and 7.9% respectively, outpacing other established European food production centers.
This acceleration is underpinned by several factors: strong culinary heritage embracing dairy innovation, expanding food processing infrastructure, and increasing adoption of convenience ingredients across hospitality sectors. In both countries, per capita consumption is projected to rise from 1.1 kg in 2025 to 1.8 kg by 2035, driven by enhanced food manufacturing capabilities and culinary experimentation.
France is forecast to grow at a CAGR of 7.3% over the same period, supported by sophisticated food processing capabilities and growing consumer preference for artisanal and specialty food applications. The country's emphasis on culinary excellence and ingredient innovation creates a favorable environment for yogurt powder adoption, particularly among premium food manufacturers and specialty bakeries. Per capita consumption is projected to increase from 1.0 kg in 2025 to 1.6 kg by 2035, reflecting mainstreaming of specialized dairy ingredients.
United Kingdom and Germany, while maintaining established food processing sectors, are expected to grow at CAGRs of 6.9% and 6.8% respectively. Both countries exhibit mature ingredient adoption with steady growth driven by convenience food manufacturing and plant-based alternative integration rather than rapid behavioral shifts. Per capita consumption in these regions is projected to rise from 0.9 kg in 2025 to 1.5 kg by 2035.
Collectively, these five countries represent the core of yogurt powder demand in Western Europe, but their individual growth paths highlight the importance of country-specific approaches in application development, culinary integration, and food processing partnerships.
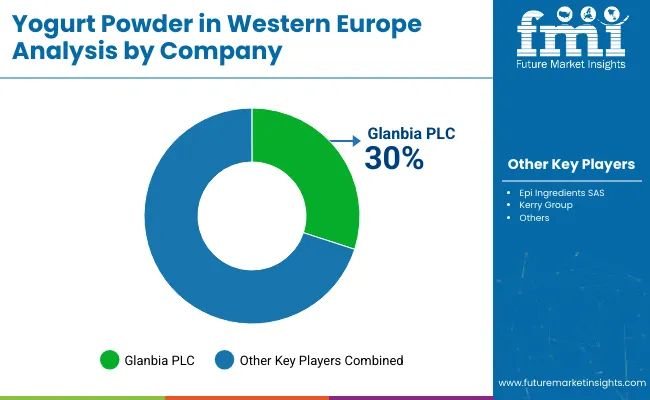
The competitive environment is characterized by a mix of established dairy processing companies and specialized ingredient manufacturers. Technical expertise and food processing relationships rather than product innovation alone remain decisive success factors: the leading suppliers collectively serve more than 15,000 food manufacturing facilities across Western Europe and maintain strong industrial channel presence.
Glanbia PLC maintains strong positioning as a comprehensive dairy ingredient provider. The company offers extensive yogurt powder formulations across multiple fat content levels and functional specifications, with particular strength in technical support and custom formulation services. Its core range of skimmed and whole powder variants provides deep penetration in food processing channels while maintaining broad coverage through ingredient distribution networks.
Epi Ingredients SAS, leveraging specialized dairy processing expertise and European supply chain capabilities, positions yogurt powder within its broader functional ingredient portfolio. The company's focus on clean-label formulations and organic variants reinforces its role as a premium supplier for health-conscious food manufacturers across European nations.
Bempresa Ltd. benefits from extensive dairy processing heritage and established relationships with food manufacturers throughout Western Europe. Recent product development focuses on flavor-enhanced formulations that address multiple application needs, targeting both efficiency and taste enhancement in processed food manufacturing.
Armor Protéines maintains significant presence in the protein ingredient category with specialized yogurt powder formulations designed for different industrial applications. The company's technical capabilities and application support programs support premium positioning in key European food processing hubs.
Kerry Group focuses on comprehensive ingredient solutions and maintains strong presence in flavor and functional ingredients sectors. The company's emphasis on innovation and application development appeals to European food manufacturers seeking integrated ingredient solutions with technical support.
Private-label programs at major ingredient distributors are expanding assortment at competitive price points, putting margin pressure on smaller suppliers while supporting broader access to yogurt powder ingredients. Consolidation is likely to continue as technical capabilities and food processing partnerships become critical for maintaining supply relationships and application development support in this specialized category.
| Item | Value |
|---|---|
| Quantitative Units (2025) | USD 110 Million |
| Product Type | Skimmed Yogurt Powder, Semi-skimmed Yogurt Powder, Whole Yogurt Powder |
| Nature | Organic, Conventional |
| Flavor | Regular, Flavored, Berries, Vanilla, Chocolate, Peach, Mango, Banana, Apple, Others (Passion Fruit, Blends) |
| End Use | Household, HoReCa, Industrial, Food and Beverage Processors, Cosmetic Manufacturers |
| Application | Food Industry, Dips and Dressings, Fillings, Bakery, Nutrition and Snack Bar, Desserts, Frozen Novelties, Dry Mixes, Others (Meat Products, Cereals), Beverages, Cosmetics and Personal Care |
| Distribution Channel | B2B, B2C, Store-Based Retail, Modern Grocery Retailers, Hypermarkets/Supermarkets, Convenience Stores, Food & Drink Specialty Stores, Independent Small Groceries, Online Retail |
| Country Covered | Italy, France, United Kingdom, Germany, BENELUX, Sweden, Norway, Denmark, Spain |
| Key Companies Profiled | Glanbia PLC, Epi Ingredients SAS, Bempresa Ltd., Armor Protéines, Döhler Dahlenburg, C.P. Ingredients Ltd, Bluegrass Dairy & Food, Inc., Dr. Suwelack, Kerry Group, Bayerische Milchindustrie eG |
| Additional Attributes | Dollar sales by product type and flavor, regional demand trends, premiumization in dairy powders, influence of clean-label trends, impact of sustainability on manufacturing & packaging, rise of plant-based yogurt powders, and competitive strategies focusing on taste, texture, and nutritional fortification |
The global demand and trend analysis of yogurt powder in Western Europe is estimated to be valued at USD 110.0 million in 2025.
The market size for the demand and trend analysis of yogurt powder in Western Europe is projected to reach USD 233.1 million by 2035.
The demand and trend analysis of yogurt powder in Western Europe is expected to grow at a 7.8% CAGR between 2025 and 2035.
The key product types in demand and trend analysis of yogurt powder in Western Europe are whole yogurt powder, skimmed yogurt powder and semi-skimmed yogurt powder.
In terms of nature, conventional segment to command 82.1% share in the demand and trend analysis of yogurt powder in Western Europe in 2025.


Our Research Products

The "Full Research Suite" delivers actionable market intel, deep dives on markets or technologies, so clients act faster, cut risk, and unlock growth.

The Leaderboard benchmarks and ranks top vendors, classifying them as Established Leaders, Leading Challengers, or Disruptors & Challengers.

Locates where complements amplify value and substitutes erode it, forecasting net impact by horizon

We deliver granular, decision-grade intel: market sizing, 5-year forecasts, pricing, adoption, usage, revenue, and operational KPIs—plus competitor tracking, regulation, and value chains—across 60 countries broadly.

Spot the shifts before they hit your P&L. We track inflection points, adoption curves, pricing moves, and ecosystem plays to show where demand is heading, why it is changing, and what to do next across high-growth markets and disruptive tech

Real-time reads of user behavior. We track shifting priorities, perceptions of today’s and next-gen services, and provider experience, then pace how fast tech moves from trial to adoption, blending buyer, consumer, and channel inputs with social signals (#WhySwitch, #UX).

Partner with our analyst team to build a custom report designed around your business priorities. From analysing market trends to assessing competitors or crafting bespoke datasets, we tailor insights to your needs.
Supplier Intelligence
Discovery & Profiling
Capacity & Footprint
Performance & Risk
Compliance & Governance
Commercial Readiness
Who Supplies Whom
Scorecards & Shortlists
Playbooks & Docs
Category Intelligence
Definition & Scope
Demand & Use Cases
Cost Drivers
Market Structure
Supply Chain Map
Trade & Policy
Operating Norms
Deliverables
Buyer Intelligence
Account Basics
Spend & Scope
Procurement Model
Vendor Requirements
Terms & Policies
Entry Strategy
Pain Points & Triggers
Outputs
Pricing Analysis
Benchmarks
Trends
Should-Cost
Indexation
Landed Cost
Commercial Terms
Deliverables
Brand Analysis
Positioning & Value Prop
Share & Presence
Customer Evidence
Go-to-Market
Digital & Reputation
Compliance & Trust
KPIs & Gaps
Outputs
Full Research Suite comprises of:
Market outlook & trends analysis
Interviews & case studies
Strategic recommendations
Vendor profiles & capabilities analysis
5-year forecasts
8 regions and 60+ country-level data splits
Market segment data splits
12 months of continuous data updates
DELIVERED AS:
PDF EXCEL ONLINE
Western Europe Powdered Cellulose Market Analysis by Source, End-use, Functionality, and Country Through 2035
Western Europe Baby Powder Market Analysis – Size, Share & Trends 2025 to 2035
Western Europe Probiotic Yogurt Market Analysis by Product Type, Flavor, Sales Channel, and Countries through 2025 to 2035
Demand and Trends Analysis of Fat Filled Milk Powder in Western Europe Size and Share Forecast Outlook 2025 to 2035
Yogurt Powder Market Analysis - Size, Share, and Forecast Outlook 2025 to 2035
Western Europe Automotive Performance Tuning & Engine Remapping Market Size and Share Forecast Outlook 2025 to 2035
Western Europe Valve Seat Insert Market Size and Share Forecast Outlook 2025 to 2035
Western Europe Automated People Mover Industry Size and Share Forecast Outlook 2025 to 2035
Western Europe Bicycle Component Aftermarket Analysis Size and Share Forecast Outlook 2025 to 2035
Western Europe Automotive Load Floor IndustryAnalysis in Western Europe Forecast & Analysis 2025 to 2035
Western Europe Probiotic Supplement Market Analysis in – Growth & Market Trends from 2025 to 2035
Western Europe Women’s Intimate Care Market Analysis – Size, Share & Trends 2025 to 2035
Western Europe Non-Dairy Creamer Market Analysis by Growth, Trends and Forecast from 2025 to 2035
Western Europe Last-mile Delivery Software Market – Growth & Outlook through 2035
Western Europe Inkjet Printer Market – Growth & Forecast 2025 to 2035
Western Europe HVDC Transmission System Market – Growth & Forecast 2025 to 2035
Conference Room Solution Market Growth – Trends & Forecast 2025 to 2035
Western Europe Intelligent Enterprise Data Capture Software Market - Growth & Forecast 2025-2035
Communications Platform as a Service (CPaaS) Market Growth - Trends & Forecast 2025 to 2035
Visitor Management System Industry Analysis in Western Europe - Market Outlook 2025 to 2035

Thank you!
You will receive an email from our Business Development Manager. Please be sure to check your SPAM/JUNK folder too.
Chat With
MaRIA