Paper Cup Market Size and Share Forecast in Japan 2025 to 2035

The Demand and Sales Analysis of Paper Cup in Japan is estimated to be valued at USD 0.8 billion in 2025 and is projected to reach USD 1.4 billion by 2035, registering a compound annual growth rate (CAGR) of 6.4% over the forecast period.
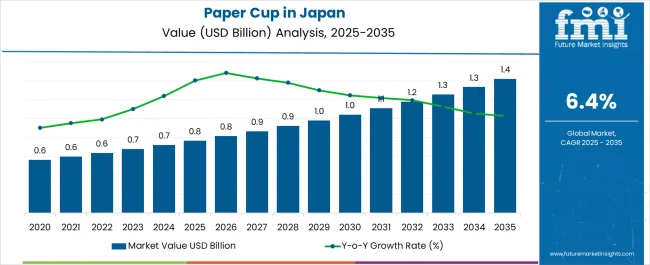
Quick Stats for Demand and Sales Analysis of Paper Cup in Japan

  • Demand and Sales Analysis of Paper Cup in Japan Industry Value (2025): USD 0.8 billion
  • Demand and Sales Analysis of Paper Cup in Japan Forecast Value (2035): USD 1.4 billion
  • Demand and Sales Analysis of Paper Cup in Japan Forecast CAGR: 6.4%
  • Leading Segment in Demand and Sales Analysis of Paper Cup in Japan in 2025: 8 Oz (28.6%)
  • Key Growth Region in Demand and Sales Analysis of Paper Cup in Japan: North America, Asia-Pacific, Europe
  • Top Key Players in Demand and Sales Analysis of Paper Cup in Japan: Daiwa Paper Mfg. Co., Ltd., KOKUYO Co., Ltd., Toppan Printing Co., Ltd., Nichimo Co., Ltd., Eco One Co., Ltd., Sakano Co., Ltd., Nihon Dixie Co., Ltd., HARIO Co., Ltd., Tomizawa Printing Co., Ltd., Dixie Japan Co., Ltd.
Paper Cup In Japan Market Value Analysis
Metric Value
Demand and Sales Analysis of Paper Cup in Japan Estimated Value in (2025 E) USD 0.8 billion
Demand and Sales Analysis of Paper Cup in Japan Forecast Value in (2035 F) USD 1.4 billion
Forecast CAGR (2025 to 2035) 6.4%

Rationale for Segmental Growth in the Demand and Sales Analysis of Paper Cup in Japan

The paper cup market in Japan is experiencing consistent growth. Increasing consumption of on-the-go beverages, rising awareness of environmental sustainability, and government regulations promoting recyclable and biodegradable packaging are driving market expansion.

Current market dynamics are influenced by evolving consumer preferences for convenient and hygienic packaging solutions, advancements in manufacturing technologies, and the adoption of lightweight and durable materials. Supply chain optimization and strategic collaborations among manufacturers have enhanced product availability and reduced production costs.

The future outlook is shaped by rising demand from cafes, fast-food outlets, and retail chains, along with innovations in coating technologies and material enhancements that improve product performance and environmental compliance Growth rationale is underpinned by the combination of robust consumer demand, technological improvements in paper cup production, and ongoing initiatives to reduce plastic usage, which collectively are expected to sustain market expansion and increase adoption of paper cups across Japan.

Segmental Analysis

Insights into the Capacity / Wall Type Segment

The 8 Oz segment, holding 28.60% of the capacity / wall type category, has been leading due to its versatility in serving standard beverage portions and compatibility with various hot and cold drinks. Its market share has been supported by widespread adoption in cafes, fast-food outlets, and convenience stores.

Manufacturing efficiencies and standardized sizing have facilitated large-scale production and distribution, while consistency in cup strength and insulation has reinforced consumer trust. Demand has been stabilized by ongoing consumption trends and the convenience offered to end-users.

Product innovation, such as improved wall thickness and structural design, is expected to sustain segment leadership and maintain competitive advantage within the paper cup market.
Insights into the Material Segment

Paper Cup In Japan Analysis By Material

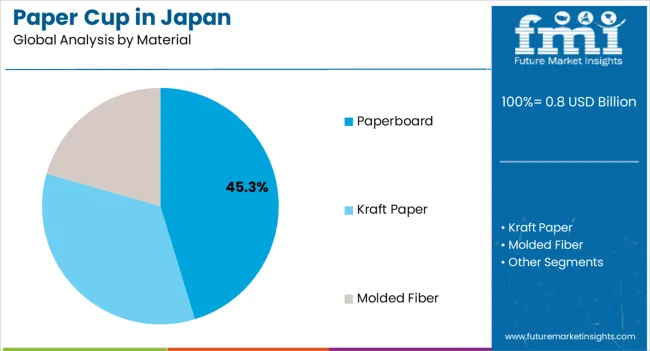
The paperboard segment, accounting for 45.30% of the material category, has maintained a dominant position due to its strength, durability, and recyclability. Its adoption has been driven by compliance with environmental regulations and increasing consumer preference for sustainable packaging.

Manufacturing processes have been optimized to ensure uniform quality and cost-effectiveness, while structural integrity and resistance to leakage have enhanced end-user satisfaction. Growth is being supported by innovation in lightweight and reinforced paperboard varieties, which allow for broader application across hot and cold beverages.

Continued focus on environmentally friendly sourcing and improved performance is expected to sustain the segment’s market share.
Insights into the Coatings Segment

Paper Cup In Japan Analysis By Coatings

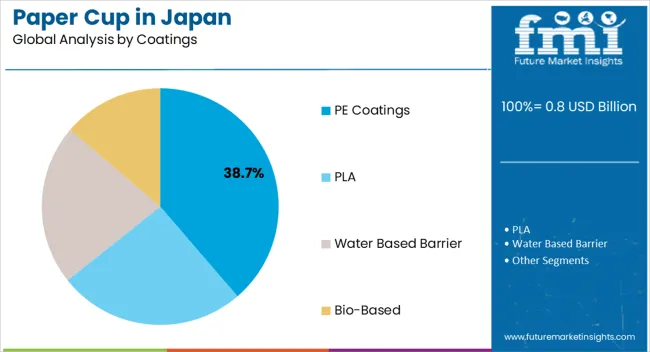
The PE coatings segment, representing 38.70% of the coatings category, has emerged as the leading coating due to its effectiveness in providing moisture resistance and maintaining structural integrity. Adoption has been reinforced by compatibility with paperboard materials and the ability to extend product shelf life.

Manufacturing standardization and regulatory compliance have contributed to consistent quality and reliability. Demand stability has been supported by widespread use in foodservice and beverage sectors, while ongoing innovations in coating formulations are improving environmental compliance and recyclability.

These factors are expected to maintain the segment’s leadership and support continued market growth in Japan.

Key Trends Driving Paper Cup Demand in Japan

  • Sub-regions like Kanto and Chubu are witnessing a significant trend toward reducing plastic waste and embracing sustainable alternatives. For example, some prominent towns in Kinki have implemented bans on single-use plastics, including plastic cup, to combat plastic pollution, which has led to a growing demand for environmentally friendly packaging options, particularly paper cup, in cafes, restaurants, etc.
  • The government of Japan is taking concrete steps to tackle the problem of plastic waste and promote sustainability. One such measure is the ban on single-use plastics, including plastic cup. The regulatory move aims to reduce plastic waste and encourage the adoption of eco-friendly alternatives. Businesses and consumers actively seek compliant and environmentally friendly paper cup, leading to a notable increase in demand.
  • The ban on single-use plastics has had a positive impact on the paper cup industry in Japan. As businesses scramble to replace plastic cup with paper ones, there has been substantial growth in the production and usage of paper cup. The trend thus aligns with sustainability goals and helps contribute to the overall reduction of plastic waste in the country

Analysis of Top Regions Using Paper Cups in Japan

Sustainable Shift Spurs Paper Cup Demand in Kanto

The Kanto region, which includes Tokyo and its surrounding prefectures, has a significant awareness of environmental issues and a growing trend towards sustainability. The government has taken steps to reduce plastic waste, increasing demand for eco-friendly alternatives like paper cup. Many cafes, restaurants, and businesses in Kanto have embraced the shift from single-use plastics to paper cup. The proactive approach has resulted in a substantial uptick in paper cup consumption, making it a prominent industry in the region.

Chubu Embraces Eco-friendly Packaging

The Chubu region, known for its industrial centers, has also witnessed a notable shift towards sustainability. Implementing regulations prohibiting single-use plastics, including plastic cup, has accelerated the adoption of paper cup. Businesses in sectors such as manufacturing and services have increasingly adopted eco-friendly packaging solutions, contributing to the growing demand for paper cup in Chubu. The trend is thus expected to continue as the region emphasizes reducing plastic waste.

Push for Green Alternatives in Kinki

Kinki, home to prominent cities like Osaka and Kyoto, has proactively curbed plastic pollution. Several towns in this region have enforced bans on single-use plastics, fostering a strong demand for sustainable alternatives such as paper cup. Cafes, eateries, and event organizers in Kinki seek eco-friendly packaging options, driving the industry for paper cup. The trend of embracing environmentally conscious choices is firmly established in this region.

Paper Cup Industry Analysis by Top Investment Segments in Japan

The table highlights that the paperboard material segment leads the industry, holding a share of 54.4% in 2025. The table further details applications and shows how beverage segment is taking the industry by storm acquiring a value share of 70.3% in 2025.

Category Value Share in 2025
Paperboard 54.4%
Beverage 70.3%

Surging Demand for Specialized Drinks like Kombucha Boosts Paperboard Cup Sales

Disposable cup for hot beverages is increasingly favored by various establishments, including restaurants, cafés, and hotels, owing to their double-walled construction that effectively preserves temperature and thermal characteristics. Tea and coffee consumption is supplementary but increasingly prevalent compared to cold beverages.

The emergence of trendy drinks in Japan, such as kombucha, Chhai, Ramune Soda, and Aojiru, further contributes to the demand for paperboard cups. Many of these beverages are served in paperboard cups, especially in takeaway formats, aligning with the fast-paced lifestyle of many consumers in Japan.

Efficient features and superior heat insulation are requisite for cup-serving hot drinks to ensure convenient consumption. As the production of cup designed for hotter beverages surges, it is anticipated to substantially influence the production rate more than cup for cold beverages. The burgeoning preference for hot drinks presents a promising growth opportunity for the global paper cup industry.

Growing Demand for Kraft Paper Cup Driven by Beverage Sector

The popularity of beverages like green tea, royal milk tea, bubble tea, flavored soy milk, and yakult, highlights the strong culture of enjoying drinks on the go. These beverages are often served in disposable paper cups, which are convenient for both the consumers and the businesses. Therefore, as these drinks continue to be favored by consumers, the demand for paper cups remains robust.

The growing appetite for specialty foods and beverages like gourmet coffee, artisanal tea, and exotic-flavored salts suggests that there could be a surge in the number of cafes and specialty stores. These establishments typically use paper cups for serving their beverages, underlining the importance of paper cup demand in the food and beverage sector.
Competitive Landscape and Strategic Positioning

Paper Cup In Japan Analysis By Company

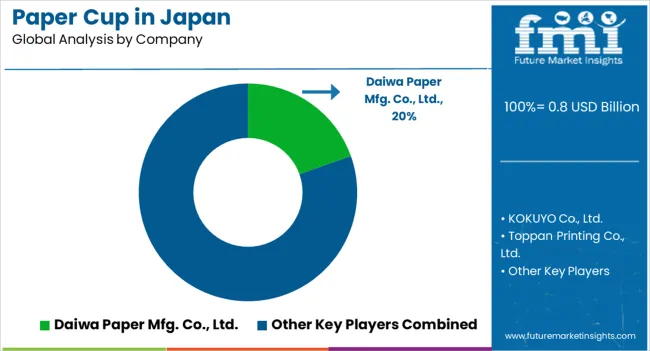
In Japan's competitive paper cup industry, key strategies revolve around sustainability, quality, and innovation. Companies focus on eco-friendly materials and responsible production practices to meet evolving environmental standards. They are focusing on diversification and customization of product offerings cater to diverse consumer needs, while stringent quality control ensures compliance with industry regulations.

They are also embracing technological advancements improves efficiency and product performance. Additionally, they are streamlining the supply chain and targeted industry segmentation to enhance operational agility.

Recent Developments Observed in Paper Cup Services in Japan

  • KOKUYO Co., Ltd. introduced the process of a wide range of work style experiments at our company, as well as the created spaces, products, and services on a unique website and in real venues.
  • Toppan Printing, a global leader in communication, security, packaging, décor materials, and electronics solutions, developed NFC1 labels, combining high-quality metallic design with maintaining the communication performance required of NFC tags.

Leading Companies in the Japan Paper Cup Industry

  • Daiwa Paper Mfg. Co., Ltd.
  • KOKUYO Co., Ltd.
  • Toppan Printing Co., Ltd.
  • Nichimo Co., Ltd.
  • Eco One Co., Ltd.
  • Sakano Co., Ltd.
  • Nihon Dixie Co., Ltd.
  • HARIO Co., Ltd.
  • Tomizawa Printing Co., Ltd.
  • Dixie Japan Co., Ltd.

Scope and Coverage of the Japan Paper Cup Market Report

Attribute Details
Estimated Industry Size in 2025 USD 0.8 billion
Projected Industry Size in 2035 USD 1.4 billion
Anticipated CAGR between 2025 to 2035 6.4% CAGR
Demand Forecast for Paper Cup Industry in Japan 2025 to 2035
Report Coverage Industry Size, Industry Trends, Analysis of key factors influencing Paper Cup in Japan, Insights on Global Players and their Industry Strategy in Japan, Ecosystem Analysis of Local and Regional Japan Providers
Key Countries Analyzed Kanto, Chubu, Kinki (Kansai), Kyushu and Okinawa, Tohoku
Key Companies Profiled Daiwa Paper Mfg. Co., Ltd.; KOKUYO Co., Ltd.; Toppan Printing Co., Ltd.; Nichimo Co., Ltd.; Eco One Co., Ltd.; Sakano Co., Ltd.; Nihon Dixie Co., Ltd.; HARIO Co., Ltd.; Tomizawa Printing Co., Ltd.; Dixie Japan Co., Ltd.

Top Segments Studied in the Japan Paper Cup Market

By Capacity:

  • 4 Oz
    • Single wall
    • Double Wall
    • Ripple Wall
  • 8 Oz
    • Single wall
    • Double Wall
    • Ripple Wall
  • 12 Oz
    • Single wall
    • Double Wall
    • Ripple Wall
  • 16 Oz
    • Single wall
    • Double Wall
    • Ripple Wall
  • 20 Oz
    • Single wall
    • Double Wall
    • Ripple Wall
  • Other Capacities
    • Single wall
    • Double Wall
    • Ripple Wall

By Material:

  • Paperboard
  • Kraft Paper
  • Molded Fiber

By Coatings:

  • PE Coatings
  • PLA
  • Water Based Barrier
  • Bio-based

Distribution Channel:

  • Direct Sales
  • Retail
  • Hypermarket
  • Supermarket
  • Convenience Stores
  • Speciality Stores
  • Distributors
  • Online

By Applications:

  • Beverages
  • Cold
  • Hot
  • Food
  • Spreads
  • Sausages Dressings
  • Confectionary
  • Dairy
  • Ice Cream
  • Yogurt
  • Drinks

By End-use:

  • Commercial Use
    • Hotels
    • Cafes
    • Full Service Restaurants
    • Quick Service Restaurants
    • Venue Caterings
    • Mobile Food Vendors
    • Bakery and Patisserie
  • Institutional Use
    • School Colleges
    • Offices
    • Hospitals
    • Airports and Railway
  • Household Use

By Cities:

  • Kanto
  • Chubu
  • Kinki (Kansai)
  • Kyushu and Okinawa
  • Tohoku

Frequently Asked Questions

How big is the demand and sales analysis of paper cup in Japan in 2025?

The global demand and sales analysis of paper cup in Japan is estimated to be valued at USD 0.8 billion in 2025.

What will be the size of demand and sales analysis of paper cup in Japan in 2035?

The market size for the demand and sales analysis of paper cup in Japan is projected to reach USD 1.4 billion by 2035.

How much will be the demand and sales analysis of paper cup in Japan growth between 2025 and 2035?

The demand and sales analysis of paper cup in Japan is expected to grow at a 6.4% CAGR between 2025 and 2035.

What are the key product types in the demand and sales analysis of paper cup in japan?

The key product types in demand and sales analysis of paper cup in Japan are 8 oz, _single wall, _double wall, _ripple wall, 4 oz, _single wall, _double wall, _ripple wall, 12 oz, _single wall, _double wall, _ripple wall, 16 oz, _single wall, _double wall, _ripple wall, 20 oz, _single wall, _double wall, _ripple wall, other capacities, _single wall, _double wall and _ripple wall.

Which material segment to contribute significant share in the demand and sales analysis of paper cup in Japan in 2025?

In terms of material, paperboard segment to command 45.3% share in the demand and sales analysis of paper cup in Japan in 2025.

Table of Content

  1. Executive Summary
    • Global Market Outlook
    • Demand-side Trends
    • Supply-side Trends
    • Technology Roadmap Analysis
    • Analysis and Recommendations
  2. Market Overview
    • Market Coverage / Taxonomy
    • Market Definition / Scope / Limitations
  3. Market Background
    • Market Dynamics
      • Drivers
      • Restraints
      • Opportunity
      • Trends
    • Scenario Forecast
      • Demand in Optimistic Scenario
      • Demand in Likely Scenario
      • Demand in Conservative Scenario
    • Opportunity Map Analysis
    • Product Life Cycle Analysis
    • Supply Chain Analysis
    • Investment Feasibility Matrix
    • Value Chain Analysis
    • PESTLE and Porter’s Analysis
    • Regulatory Landscape
    • Regional Parent Market Outlook
    • Production and Consumption Statistics
    • Import and Export Statistics
  4. Global Demand and Sales Analysis of Paper Cup in Japan Analysis 2020-2024 and Forecast, 2025-2035
    • Historical Market Size Value (USD Mn) Analysis, 2020-2024
    • Current and Future Market Size Value (USD Mn) Projections, 2025-2035
      • Y-o-Y Growth Trend Analysis
      • Absolute $ Opportunity Analysis
  5. Global Demand and Sales Analysis of Paper Cup in Japan Pricing Analysis 2020-2024 and Forecast 2025-2035
  6. Global Demand and Sales Analysis of Paper Cup in Japan Analysis 2020-2024 and Forecast 2025-2035, By Capacity / Wall Type
    • Introduction / Key Findings
    • Historical Market Size Value (USD Mn) Analysis By Capacity / Wall Type , 2020-2024
    • Current and Future Market Size Value (USD Mn) Analysis and Forecast By Capacity / Wall Type , 2025-2035
      • 8 Oz
        • Single wall
        • Double Wall
        • Ripple Wall
      • 4 Oz
        • Single wall
        • Double Wall
        • Ripple Wall
      • 12 Oz
        • Single wall
        • Double Wall
        • Ripple Wall
      • 16 Oz
        • Single wall
        • Double Wall
        • Ripple Wall
      • 20 Oz
        • Single wall
        • Double Wall
        • Ripple Wall
      • Other Capacities
        • Single wall
        • Double Wall
        • Ripple Wall
    • Y-o-Y Growth Trend Analysis By Capacity / Wall Type , 2020-2024
    • Absolute $ Opportunity Analysis By Capacity / Wall Type , 2025-2035
  7. Global Demand and Sales Analysis of Paper Cup in Japan Analysis 2020-2024 and Forecast 2025-2035, By Material
    • Introduction / Key Findings
    • Historical Market Size Value (USD Mn) Analysis By Material, 2020-2024
    • Current and Future Market Size Value (USD Mn) Analysis and Forecast By Material, 2025-2035
      • Paperboard
      • Kraft Paper
      • Molded Fiber
    • Y-o-Y Growth Trend Analysis By Material, 2020-2024
    • Absolute $ Opportunity Analysis By Material, 2025-2035
  8. Global Demand and Sales Analysis of Paper Cup in Japan Analysis 2020-2024 and Forecast 2025-2035, By Coatings
    • Introduction / Key Findings
    • Historical Market Size Value (USD Mn) Analysis By Coatings, 2020-2024
    • Current and Future Market Size Value (USD Mn) Analysis and Forecast By Coatings, 2025-2035
      • PE Coatings
      • PLA
      • Water Based Barrier
      • Bio-Based
    • Y-o-Y Growth Trend Analysis By Coatings, 2020-2024
    • Absolute $ Opportunity Analysis By Coatings, 2025-2035
  9. Global Demand and Sales Analysis of Paper Cup in Japan Analysis 2020-2024 and Forecast 2025-2035, By Distribution Channel
    • Introduction / Key Findings
    • Historical Market Size Value (USD Mn) Analysis By Distribution Channel, 2020-2024
    • Current and Future Market Size Value (USD Mn) Analysis and Forecast By Distribution Channel, 2025-2035
      • Retail
      • Direct Sales
      • Hypermarket
      • Supermarket
      • Convenience Stores
      • Speciality Stores
      • Distributors
      • Online
    • Y-o-Y Growth Trend Analysis By Distribution Channel, 2020-2024
    • Absolute $ Opportunity Analysis By Distribution Channel, 2025-2035
  10. Global Demand and Sales Analysis of Paper Cup in Japan Analysis 2020-2024 and Forecast 2025-2035, By Applications
    • Introduction / Key Findings
    • Historical Market Size Value (USD Mn) Analysis By Applications, 2020-2024
    • Current and Future Market Size Value (USD Mn) Analysis and Forecast By Applications, 2025-2035
      • Beverages
      • Cold
      • Hot
      • Food
      • Spreads
      • Sausages Dressings
      • Confectionary
      • Dairy
      • Ice Cream
      • Yogurt
      • Drinks
    • Y-o-Y Growth Trend Analysis By Applications, 2020-2024
    • Absolute $ Opportunity Analysis By Applications, 2025-2035
  11. Global Demand and Sales Analysis of Paper Cup in Japan Analysis 2020-2024 and Forecast 2025-2035, By End-Use
    • Introduction / Key Findings
    • Historical Market Size Value (USD Mn) Analysis By End-Use, 2020-2024
    • Current and Future Market Size Value (USD Mn) Analysis and Forecast By End-Use, 2025-2035
      • Commercial Use
        • Hotels
        • Cafes
        • Full Service Restaurants
        • Quick Service Restaurants
        • Venue Caterings
        • Mobile Food Vendors
        • Bakery and Patisserie
      • Institutional Use
        • School Colleges
        • Offices
        • Hospitals
        • Airports And Railway
      • Household Use
    • Y-o-Y Growth Trend Analysis By End-Use, 2020-2024
    • Absolute $ Opportunity Analysis By End-Use, 2025-2035
  12. Global Demand and Sales Analysis of Paper Cup in Japan Analysis 2020-2024 and Forecast 2025-2035, By Region
    • Introduction
    • Historical Market Size Value (USD Mn) Analysis By Region, 2020-2024
    • Current Market Size Value (USD Mn) Analysis and Forecast By Region, 2025-2035
      • North America
      • Latin America
      • Western Europe
      • Eastern Europe
      • East Asia
      • South Asia and Pacific
      • Middle East & Africa
    • Market Attractiveness Analysis By Region
  13. North America Demand and Sales Analysis of Paper Cup in Japan Analysis 2020-2024 and Forecast 2025-2035, By Country
    • Historical Market Size Value (USD Mn) Trend Analysis By Market Taxonomy, 2020-2024
    • Market Size Value (USD Mn) Forecast By Market Taxonomy, 2025-2035
      • By Country
        • USA
        • Canada
        • Mexico
      • By Capacity / Wall Type
      • By Material
      • By Coatings
      • By Distribution Channel
      • By Applications
      • By End-Use
    • Market Attractiveness Analysis
      • By Country
      • By Capacity / Wall Type
      • By Material
      • By Coatings
      • By Distribution Channel
      • By Applications
      • By End-Use
    • Key Takeaways
  14. Latin America Demand and Sales Analysis of Paper Cup in Japan Analysis 2020-2024 and Forecast 2025-2035, By Country
    • Historical Market Size Value (USD Mn) Trend Analysis By Market Taxonomy, 2020-2024
    • Market Size Value (USD Mn) Forecast By Market Taxonomy, 2025-2035
      • By Country
        • Brazil
        • Chile
        • Rest of Latin America
      • By Capacity / Wall Type
      • By Material
      • By Coatings
      • By Distribution Channel
      • By Applications
      • By End-Use
    • Market Attractiveness Analysis
      • By Country
      • By Capacity / Wall Type
      • By Material
      • By Coatings
      • By Distribution Channel
      • By Applications
      • By End-Use
    • Key Takeaways
  15. Western Europe Demand and Sales Analysis of Paper Cup in Japan Analysis 2020-2024 and Forecast 2025-2035, By Country
    • Historical Market Size Value (USD Mn) Trend Analysis By Market Taxonomy, 2020-2024
    • Market Size Value (USD Mn) Forecast By Market Taxonomy, 2025-2035
      • By Country
        • Germany
        • UK
        • Italy
        • Spain
        • France
        • Nordic
        • BENELUX
        • Rest of Western Europe
      • By Capacity / Wall Type
      • By Material
      • By Coatings
      • By Distribution Channel
      • By Applications
      • By End-Use
    • Market Attractiveness Analysis
      • By Country
      • By Capacity / Wall Type
      • By Material
      • By Coatings
      • By Distribution Channel
      • By Applications
      • By End-Use
    • Key Takeaways
  16. Eastern Europe Demand and Sales Analysis of Paper Cup in Japan Analysis 2020-2024 and Forecast 2025-2035, By Country
    • Historical Market Size Value (USD Mn) Trend Analysis By Market Taxonomy, 2020-2024
    • Market Size Value (USD Mn) Forecast By Market Taxonomy, 2025-2035
      • By Country
        • Russia
        • Poland
        • Hungary
        • Balkan & Baltic
        • Rest of Eastern Europe
      • By Capacity / Wall Type
      • By Material
      • By Coatings
      • By Distribution Channel
      • By Applications
      • By End-Use
    • Market Attractiveness Analysis
      • By Country
      • By Capacity / Wall Type
      • By Material
      • By Coatings
      • By Distribution Channel
      • By Applications
      • By End-Use
    • Key Takeaways
  17. East Asia Demand and Sales Analysis of Paper Cup in Japan Analysis 2020-2024 and Forecast 2025-2035, By Country
    • Historical Market Size Value (USD Mn) Trend Analysis By Market Taxonomy, 2020-2024
    • Market Size Value (USD Mn) Forecast By Market Taxonomy, 2025-2035
      • By Country
        • China
        • Japan
        • South Korea
      • By Capacity / Wall Type
      • By Material
      • By Coatings
      • By Distribution Channel
      • By Applications
      • By End-Use
    • Market Attractiveness Analysis
      • By Country
      • By Capacity / Wall Type
      • By Material
      • By Coatings
      • By Distribution Channel
      • By Applications
      • By End-Use
    • Key Takeaways
  18. South Asia and Pacific Demand and Sales Analysis of Paper Cup in Japan Analysis 2020-2024 and Forecast 2025-2035, By Country
    • Historical Market Size Value (USD Mn) Trend Analysis By Market Taxonomy, 2020-2024
    • Market Size Value (USD Mn) Forecast By Market Taxonomy, 2025-2035
      • By Country
        • India
        • ASEAN
        • Australia & New Zealand
        • Rest of South Asia and Pacific
      • By Capacity / Wall Type
      • By Material
      • By Coatings
      • By Distribution Channel
      • By Applications
      • By End-Use
    • Market Attractiveness Analysis
      • By Country
      • By Capacity / Wall Type
      • By Material
      • By Coatings
      • By Distribution Channel
      • By Applications
      • By End-Use
    • Key Takeaways
  19. Middle East & Africa Demand and Sales Analysis of Paper Cup in Japan Analysis 2020-2024 and Forecast 2025-2035, By Country
    • Historical Market Size Value (USD Mn) Trend Analysis By Market Taxonomy, 2020-2024
    • Market Size Value (USD Mn) Forecast By Market Taxonomy, 2025-2035
      • By Country
        • Kingdom of Saudi Arabia
        • Other GCC Countries
        • Turkiye
        • South Africa
        • Other African Union
        • Rest of Middle East & Africa
      • By Capacity / Wall Type
      • By Material
      • By Coatings
      • By Distribution Channel
      • By Applications
      • By End-Use
    • Market Attractiveness Analysis
      • By Country
      • By Capacity / Wall Type
      • By Material
      • By Coatings
      • By Distribution Channel
      • By Applications
      • By End-Use
    • Key Takeaways
  20. Key Countries Demand and Sales Analysis of Paper Cup in Japan Analysis
    • USA
      • Pricing Analysis
      • Market Share Analysis, 2024
        • By Capacity / Wall Type
        • By Material
        • By Coatings
        • By Distribution Channel
        • By Applications
        • By End-Use
    • Canada
      • Pricing Analysis
      • Market Share Analysis, 2024
        • By Capacity / Wall Type
        • By Material
        • By Coatings
        • By Distribution Channel
        • By Applications
        • By End-Use
    • Mexico
      • Pricing Analysis
      • Market Share Analysis, 2024
        • By Capacity / Wall Type
        • By Material
        • By Coatings
        • By Distribution Channel
        • By Applications
        • By End-Use
    • Brazil
      • Pricing Analysis
      • Market Share Analysis, 2024
        • By Capacity / Wall Type
        • By Material
        • By Coatings
        • By Distribution Channel
        • By Applications
        • By End-Use
    • Chile
      • Pricing Analysis
      • Market Share Analysis, 2024
        • By Capacity / Wall Type
        • By Material
        • By Coatings
        • By Distribution Channel
        • By Applications
        • By End-Use
    • Germany
      • Pricing Analysis
      • Market Share Analysis, 2024
        • By Capacity / Wall Type
        • By Material
        • By Coatings
        • By Distribution Channel
        • By Applications
        • By End-Use
    • UK
      • Pricing Analysis
      • Market Share Analysis, 2024
        • By Capacity / Wall Type
        • By Material
        • By Coatings
        • By Distribution Channel
        • By Applications
        • By End-Use
    • Italy
      • Pricing Analysis
      • Market Share Analysis, 2024
        • By Capacity / Wall Type
        • By Material
        • By Coatings
        • By Distribution Channel
        • By Applications
        • By End-Use
    • Spain
      • Pricing Analysis
      • Market Share Analysis, 2024
        • By Capacity / Wall Type
        • By Material
        • By Coatings
        • By Distribution Channel
        • By Applications
        • By End-Use
    • France
      • Pricing Analysis
      • Market Share Analysis, 2024
        • By Capacity / Wall Type
        • By Material
        • By Coatings
        • By Distribution Channel
        • By Applications
        • By End-Use
    • India
      • Pricing Analysis
      • Market Share Analysis, 2024
        • By Capacity / Wall Type
        • By Material
        • By Coatings
        • By Distribution Channel
        • By Applications
        • By End-Use
    • ASEAN
      • Pricing Analysis
      • Market Share Analysis, 2024
        • By Capacity / Wall Type
        • By Material
        • By Coatings
        • By Distribution Channel
        • By Applications
        • By End-Use
    • Australia & New Zealand
      • Pricing Analysis
      • Market Share Analysis, 2024
        • By Capacity / Wall Type
        • By Material
        • By Coatings
        • By Distribution Channel
        • By Applications
        • By End-Use
    • China
      • Pricing Analysis
      • Market Share Analysis, 2024
        • By Capacity / Wall Type
        • By Material
        • By Coatings
        • By Distribution Channel
        • By Applications
        • By End-Use
    • Japan
      • Pricing Analysis
      • Market Share Analysis, 2024
        • By Capacity / Wall Type
        • By Material
        • By Coatings
        • By Distribution Channel
        • By Applications
        • By End-Use
    • South Korea
      • Pricing Analysis
      • Market Share Analysis, 2024
        • By Capacity / Wall Type
        • By Material
        • By Coatings
        • By Distribution Channel
        • By Applications
        • By End-Use
    • Russia
      • Pricing Analysis
      • Market Share Analysis, 2024
        • By Capacity / Wall Type
        • By Material
        • By Coatings
        • By Distribution Channel
        • By Applications
        • By End-Use
    • Poland
      • Pricing Analysis
      • Market Share Analysis, 2024
        • By Capacity / Wall Type
        • By Material
        • By Coatings
        • By Distribution Channel
        • By Applications
        • By End-Use
    • Hungary
      • Pricing Analysis
      • Market Share Analysis, 2024
        • By Capacity / Wall Type
        • By Material
        • By Coatings
        • By Distribution Channel
        • By Applications
        • By End-Use
    • Kingdom of Saudi Arabia
      • Pricing Analysis
      • Market Share Analysis, 2024
        • By Capacity / Wall Type
        • By Material
        • By Coatings
        • By Distribution Channel
        • By Applications
        • By End-Use
    • Turkiye
      • Pricing Analysis
      • Market Share Analysis, 2024
        • By Capacity / Wall Type
        • By Material
        • By Coatings
        • By Distribution Channel
        • By Applications
        • By End-Use
    • South Africa
      • Pricing Analysis
      • Market Share Analysis, 2024
        • By Capacity / Wall Type
        • By Material
        • By Coatings
        • By Distribution Channel
        • By Applications
        • By End-Use
  21. Market Structure Analysis
    • Competition Dashboard
    • Competition Benchmarking
    • Market Share Analysis of Top Players
      • By Regional
      • By Capacity / Wall Type
      • By Material
      • By Coatings
      • By Distribution Channel
      • By Applications
      • By End-Use
  22. Competition Analysis
    • Competition Deep Dive
      • Daiwa Paper Mfg. Co., Ltd.
        • Overview
        • Product Portfolio
        • Profitability by Market Segments (Product/Age /Sales Channel/Region)
        • Sales Footprint
        • Strategy Overview
          • Marketing Strategy
          • Product Strategy
          • Channel Strategy
      • KOKUYO Co., Ltd.
      • Toppan Printing Co., Ltd.
      • Nichimo Co., Ltd.
      • Eco One Co., Ltd.
      • Sakano Co., Ltd.
      • Nihon Dixie Co., Ltd.
      • HARIO Co., Ltd.
      • Tomizawa Printing Co., Ltd.
      • Dixie Japan Co., Ltd.
  23. Assumptions & Acronyms Used
  24. Research Methodology

List of Tables

  • Table 1: Global Demand and Sales Analysis of Paper Cup in Japan Value (USD Mn) Forecast by Region, 2020-2035
  • Table 2: Global Demand and Sales Analysis of Paper Cup in Japan Value (USD Mn) Forecast by Capacity / Wall Type , 2020-2035
  • Table 3: Global Demand and Sales Analysis of Paper Cup in Japan Value (USD Mn) Forecast by Material, 2020-2035
  • Table 4: Global Demand and Sales Analysis of Paper Cup in Japan Value (USD Mn) Forecast by Coatings, 2020-2035
  • Table 5: Global Demand and Sales Analysis of Paper Cup in Japan Value (USD Mn) Forecast by Distribution Channel, 2020-2035
  • Table 6: Global Demand and Sales Analysis of Paper Cup in Japan Value (USD Mn) Forecast by Applications, 2020-2035
  • Table 7: Global Demand and Sales Analysis of Paper Cup in Japan Value (USD Mn) Forecast by End-Use, 2020-2035
  • Table 8: North America Demand and Sales Analysis of Paper Cup in Japan Value (USD Mn) Forecast by Country, 2020-2035
  • Table 9: North America Demand and Sales Analysis of Paper Cup in Japan Value (USD Mn) Forecast by Capacity / Wall Type , 2020-2035
  • Table 10: North America Demand and Sales Analysis of Paper Cup in Japan Value (USD Mn) Forecast by Material, 2020-2035
  • Table 11: North America Demand and Sales Analysis of Paper Cup in Japan Value (USD Mn) Forecast by Coatings, 2020-2035
  • Table 12: North America Demand and Sales Analysis of Paper Cup in Japan Value (USD Mn) Forecast by Distribution Channel, 2020-2035
  • Table 13: North America Demand and Sales Analysis of Paper Cup in Japan Value (USD Mn) Forecast by Applications, 2020-2035
  • Table 14: North America Demand and Sales Analysis of Paper Cup in Japan Value (USD Mn) Forecast by End-Use, 2020-2035
  • Table 15: Latin America Demand and Sales Analysis of Paper Cup in Japan Value (USD Mn) Forecast by Country, 2020-2035
  • Table 16: Latin America Demand and Sales Analysis of Paper Cup in Japan Value (USD Mn) Forecast by Capacity / Wall Type , 2020-2035
  • Table 17: Latin America Demand and Sales Analysis of Paper Cup in Japan Value (USD Mn) Forecast by Material, 2020-2035
  • Table 18: Latin America Demand and Sales Analysis of Paper Cup in Japan Value (USD Mn) Forecast by Coatings, 2020-2035
  • Table 19: Latin America Demand and Sales Analysis of Paper Cup in Japan Value (USD Mn) Forecast by Distribution Channel, 2020-2035
  • Table 20: Latin America Demand and Sales Analysis of Paper Cup in Japan Value (USD Mn) Forecast by Applications, 2020-2035
  • Table 21: Latin America Demand and Sales Analysis of Paper Cup in Japan Value (USD Mn) Forecast by End-Use, 2020-2035
  • Table 22: Western Europe Demand and Sales Analysis of Paper Cup in Japan Value (USD Mn) Forecast by Country, 2020-2035
  • Table 23: Western Europe Demand and Sales Analysis of Paper Cup in Japan Value (USD Mn) Forecast by Capacity / Wall Type , 2020-2035
  • Table 24: Western Europe Demand and Sales Analysis of Paper Cup in Japan Value (USD Mn) Forecast by Material, 2020-2035
  • Table 25: Western Europe Demand and Sales Analysis of Paper Cup in Japan Value (USD Mn) Forecast by Coatings, 2020-2035
  • Table 26: Western Europe Demand and Sales Analysis of Paper Cup in Japan Value (USD Mn) Forecast by Distribution Channel, 2020-2035
  • Table 27: Western Europe Demand and Sales Analysis of Paper Cup in Japan Value (USD Mn) Forecast by Applications, 2020-2035
  • Table 28: Western Europe Demand and Sales Analysis of Paper Cup in Japan Value (USD Mn) Forecast by End-Use, 2020-2035
  • Table 29: Eastern Europe Demand and Sales Analysis of Paper Cup in Japan Value (USD Mn) Forecast by Country, 2020-2035
  • Table 30: Eastern Europe Demand and Sales Analysis of Paper Cup in Japan Value (USD Mn) Forecast by Capacity / Wall Type , 2020-2035
  • Table 31: Eastern Europe Demand and Sales Analysis of Paper Cup in Japan Value (USD Mn) Forecast by Material, 2020-2035
  • Table 32: Eastern Europe Demand and Sales Analysis of Paper Cup in Japan Value (USD Mn) Forecast by Coatings, 2020-2035
  • Table 33: Eastern Europe Demand and Sales Analysis of Paper Cup in Japan Value (USD Mn) Forecast by Distribution Channel, 2020-2035
  • Table 34: Eastern Europe Demand and Sales Analysis of Paper Cup in Japan Value (USD Mn) Forecast by Applications, 2020-2035
  • Table 35: Eastern Europe Demand and Sales Analysis of Paper Cup in Japan Value (USD Mn) Forecast by End-Use, 2020-2035
  • Table 36: East Asia Demand and Sales Analysis of Paper Cup in Japan Value (USD Mn) Forecast by Country, 2020-2035
  • Table 37: East Asia Demand and Sales Analysis of Paper Cup in Japan Value (USD Mn) Forecast by Capacity / Wall Type , 2020-2035
  • Table 38: East Asia Demand and Sales Analysis of Paper Cup in Japan Value (USD Mn) Forecast by Material, 2020-2035
  • Table 39: East Asia Demand and Sales Analysis of Paper Cup in Japan Value (USD Mn) Forecast by Coatings, 2020-2035
  • Table 40: East Asia Demand and Sales Analysis of Paper Cup in Japan Value (USD Mn) Forecast by Distribution Channel, 2020-2035
  • Table 41: East Asia Demand and Sales Analysis of Paper Cup in Japan Value (USD Mn) Forecast by Applications, 2020-2035
  • Table 42: East Asia Demand and Sales Analysis of Paper Cup in Japan Value (USD Mn) Forecast by End-Use, 2020-2035
  • Table 43: South Asia and Pacific Demand and Sales Analysis of Paper Cup in Japan Value (USD Mn) Forecast by Country, 2020-2035
  • Table 44: South Asia and Pacific Demand and Sales Analysis of Paper Cup in Japan Value (USD Mn) Forecast by Capacity / Wall Type , 2020-2035
  • Table 45: South Asia and Pacific Demand and Sales Analysis of Paper Cup in Japan Value (USD Mn) Forecast by Material, 2020-2035
  • Table 46: South Asia and Pacific Demand and Sales Analysis of Paper Cup in Japan Value (USD Mn) Forecast by Coatings, 2020-2035
  • Table 47: South Asia and Pacific Demand and Sales Analysis of Paper Cup in Japan Value (USD Mn) Forecast by Distribution Channel, 2020-2035
  • Table 48: South Asia and Pacific Demand and Sales Analysis of Paper Cup in Japan Value (USD Mn) Forecast by Applications, 2020-2035
  • Table 49: South Asia and Pacific Demand and Sales Analysis of Paper Cup in Japan Value (USD Mn) Forecast by End-Use, 2020-2035
  • Table 50: Middle East & Africa Demand and Sales Analysis of Paper Cup in Japan Value (USD Mn) Forecast by Country, 2020-2035
  • Table 51: Middle East & Africa Demand and Sales Analysis of Paper Cup in Japan Value (USD Mn) Forecast by Capacity / Wall Type , 2020-2035
  • Table 52: Middle East & Africa Demand and Sales Analysis of Paper Cup in Japan Value (USD Mn) Forecast by Material, 2020-2035
  • Table 53: Middle East & Africa Demand and Sales Analysis of Paper Cup in Japan Value (USD Mn) Forecast by Coatings, 2020-2035
  • Table 54: Middle East & Africa Demand and Sales Analysis of Paper Cup in Japan Value (USD Mn) Forecast by Distribution Channel, 2020-2035
  • Table 55: Middle East & Africa Demand and Sales Analysis of Paper Cup in Japan Value (USD Mn) Forecast by Applications, 2020-2035
  • Table 56: Middle East & Africa Demand and Sales Analysis of Paper Cup in Japan Value (USD Mn) Forecast by End-Use, 2020-2035

List of Figures

  • Figure 1: Global Demand and Sales Analysis of Paper Cup in Japan Pricing Analysis
  • Figure 2: Global Demand and Sales Analysis of Paper Cup in Japan Value (USD Mn) Forecast 2020–2035
  • Figure 3: Global Demand and Sales Analysis of Paper Cup in Japan Value Share and BPS Analysis by Capacity / Wall Type , 2025 and 2035
  • Figure 4: Global Demand and Sales Analysis of Paper Cup in Japan Y-o-Y Growth Comparison by Capacity / Wall Type , 2025–2035
  • Figure 5: Global Demand and Sales Analysis of Paper Cup in Japan Attractiveness Analysis by Capacity / Wall Type
  • Figure 6: Global Demand and Sales Analysis of Paper Cup in Japan Value Share and BPS Analysis by Material, 2025 and 2035
  • Figure 7: Global Demand and Sales Analysis of Paper Cup in Japan Y-o-Y Growth Comparison by Material, 2025–2035
  • Figure 8: Global Demand and Sales Analysis of Paper Cup in Japan Attractiveness Analysis by Material
  • Figure 9: Global Demand and Sales Analysis of Paper Cup in Japan Value Share and BPS Analysis by Coatings, 2025 and 2035
  • Figure 10: Global Demand and Sales Analysis of Paper Cup in Japan Y-o-Y Growth Comparison by Coatings, 2025–2035
  • Figure 11: Global Demand and Sales Analysis of Paper Cup in Japan Attractiveness Analysis by Coatings
  • Figure 12: Global Demand and Sales Analysis of Paper Cup in Japan Value Share and BPS Analysis by Distribution Channel, 2025 and 2035
  • Figure 13: Global Demand and Sales Analysis of Paper Cup in Japan Y-o-Y Growth Comparison by Distribution Channel, 2025–2035
  • Figure 14: Global Demand and Sales Analysis of Paper Cup in Japan Attractiveness Analysis by Distribution Channel
  • Figure 15: Global Demand and Sales Analysis of Paper Cup in Japan Value Share and BPS Analysis by Applications, 2025 and 2035
  • Figure 16: Global Demand and Sales Analysis of Paper Cup in Japan Y-o-Y Growth Comparison by Applications, 2025–2035
  • Figure 17: Global Demand and Sales Analysis of Paper Cup in Japan Attractiveness Analysis by Applications
  • Figure 18: Global Demand and Sales Analysis of Paper Cup in Japan Value Share and BPS Analysis by End-Use, 2025 and 2035
  • Figure 19: Global Demand and Sales Analysis of Paper Cup in Japan Y-o-Y Growth Comparison by End-Use, 2025–2035
  • Figure 20: Global Demand and Sales Analysis of Paper Cup in Japan Attractiveness Analysis by End-Use
  • Figure 21: Global Demand and Sales Analysis of Paper Cup in Japan Value (USD Mn) Share and BPS Analysis by Region, 2025 and 2035
  • Figure 22: Global Demand and Sales Analysis of Paper Cup in Japan Y-o-Y Growth Comparison by Region, 2025–2035
  • Figure 23: Global Demand and Sales Analysis of Paper Cup in Japan Attractiveness Analysis by Region
  • Figure 24: North America Demand and Sales Analysis of Paper Cup in Japan Incremental Dollar Opportunity, 2025–2035
  • Figure 25: Latin America Demand and Sales Analysis of Paper Cup in Japan Incremental Dollar Opportunity, 2025–2035
  • Figure 26: Western Europe Demand and Sales Analysis of Paper Cup in Japan Incremental Dollar Opportunity, 2025–2035
  • Figure 27: Eastern Europe Demand and Sales Analysis of Paper Cup in Japan Incremental Dollar Opportunity, 2025–2035
  • Figure 28: East Asia Demand and Sales Analysis of Paper Cup in Japan Incremental Dollar Opportunity, 2025–2035
  • Figure 29: South Asia and Pacific Demand and Sales Analysis of Paper Cup in Japan Incremental Dollar Opportunity, 2025–2035
  • Figure 30: Middle East & Africa Demand and Sales Analysis of Paper Cup in Japan Incremental Dollar Opportunity, 2025–2035
  • Figure 31: North America Demand and Sales Analysis of Paper Cup in Japan Value Share and BPS Analysis by Country, 2025 and 2035
  • Figure 32: North America Demand and Sales Analysis of Paper Cup in Japan Value Share and BPS Analysis by Capacity / Wall Type , 2025 and 2035
  • Figure 33: North America Demand and Sales Analysis of Paper Cup in Japan Y-o-Y Growth Comparison by Capacity / Wall Type , 2025–2035
  • Figure 34: North America Demand and Sales Analysis of Paper Cup in Japan Attractiveness Analysis by Capacity / Wall Type
  • Figure 35: North America Demand and Sales Analysis of Paper Cup in Japan Value Share and BPS Analysis by Material, 2025 and 2035
  • Figure 36: North America Demand and Sales Analysis of Paper Cup in Japan Y-o-Y Growth Comparison by Material, 2025–2035
  • Figure 37: North America Demand and Sales Analysis of Paper Cup in Japan Attractiveness Analysis by Material
  • Figure 38: North America Demand and Sales Analysis of Paper Cup in Japan Value Share and BPS Analysis by Coatings, 2025 and 2035
  • Figure 39: North America Demand and Sales Analysis of Paper Cup in Japan Y-o-Y Growth Comparison by Coatings, 2025–2035
  • Figure 40: North America Demand and Sales Analysis of Paper Cup in Japan Attractiveness Analysis by Coatings
  • Figure 41: North America Demand and Sales Analysis of Paper Cup in Japan Value Share and BPS Analysis by Distribution Channel, 2025 and 2035
  • Figure 42: North America Demand and Sales Analysis of Paper Cup in Japan Y-o-Y Growth Comparison by Distribution Channel, 2025–2035
  • Figure 43: North America Demand and Sales Analysis of Paper Cup in Japan Attractiveness Analysis by Distribution Channel
  • Figure 44: North America Demand and Sales Analysis of Paper Cup in Japan Value Share and BPS Analysis by Applications, 2025 and 2035
  • Figure 45: North America Demand and Sales Analysis of Paper Cup in Japan Y-o-Y Growth Comparison by Applications, 2025–2035
  • Figure 46: North America Demand and Sales Analysis of Paper Cup in Japan Attractiveness Analysis by Applications
  • Figure 47: North America Demand and Sales Analysis of Paper Cup in Japan Value Share and BPS Analysis by End-Use, 2025 and 2035
  • Figure 48: North America Demand and Sales Analysis of Paper Cup in Japan Y-o-Y Growth Comparison by End-Use, 2025–2035
  • Figure 49: North America Demand and Sales Analysis of Paper Cup in Japan Attractiveness Analysis by End-Use
  • Figure 50: Latin America Demand and Sales Analysis of Paper Cup in Japan Value Share and BPS Analysis by Country, 2025 and 2035
  • Figure 51: Latin America Demand and Sales Analysis of Paper Cup in Japan Value Share and BPS Analysis by Capacity / Wall Type , 2025 and 2035
  • Figure 52: Latin America Demand and Sales Analysis of Paper Cup in Japan Y-o-Y Growth Comparison by Capacity / Wall Type , 2025–2035
  • Figure 53: Latin America Demand and Sales Analysis of Paper Cup in Japan Attractiveness Analysis by Capacity / Wall Type
  • Figure 54: Latin America Demand and Sales Analysis of Paper Cup in Japan Value Share and BPS Analysis by Material, 2025 and 2035
  • Figure 55: Latin America Demand and Sales Analysis of Paper Cup in Japan Y-o-Y Growth Comparison by Material, 2025–2035
  • Figure 56: Latin America Demand and Sales Analysis of Paper Cup in Japan Attractiveness Analysis by Material
  • Figure 57: Latin America Demand and Sales Analysis of Paper Cup in Japan Value Share and BPS Analysis by Coatings, 2025 and 2035
  • Figure 58: Latin America Demand and Sales Analysis of Paper Cup in Japan Y-o-Y Growth Comparison by Coatings, 2025–2035
  • Figure 59: Latin America Demand and Sales Analysis of Paper Cup in Japan Attractiveness Analysis by Coatings
  • Figure 60: Latin America Demand and Sales Analysis of Paper Cup in Japan Value Share and BPS Analysis by Distribution Channel, 2025 and 2035
  • Figure 61: Latin America Demand and Sales Analysis of Paper Cup in Japan Y-o-Y Growth Comparison by Distribution Channel, 2025–2035
  • Figure 62: Latin America Demand and Sales Analysis of Paper Cup in Japan Attractiveness Analysis by Distribution Channel
  • Figure 63: Latin America Demand and Sales Analysis of Paper Cup in Japan Value Share and BPS Analysis by Applications, 2025 and 2035
  • Figure 64: Latin America Demand and Sales Analysis of Paper Cup in Japan Y-o-Y Growth Comparison by Applications, 2025–2035
  • Figure 65: Latin America Demand and Sales Analysis of Paper Cup in Japan Attractiveness Analysis by Applications
  • Figure 66: Latin America Demand and Sales Analysis of Paper Cup in Japan Value Share and BPS Analysis by End-Use, 2025 and 2035
  • Figure 67: Latin America Demand and Sales Analysis of Paper Cup in Japan Y-o-Y Growth Comparison by End-Use, 2025–2035
  • Figure 68: Latin America Demand and Sales Analysis of Paper Cup in Japan Attractiveness Analysis by End-Use
  • Figure 69: Western Europe Demand and Sales Analysis of Paper Cup in Japan Value Share and BPS Analysis by Country, 2025 and 2035
  • Figure 70: Western Europe Demand and Sales Analysis of Paper Cup in Japan Value Share and BPS Analysis by Capacity / Wall Type , 2025 and 2035
  • Figure 71: Western Europe Demand and Sales Analysis of Paper Cup in Japan Y-o-Y Growth Comparison by Capacity / Wall Type , 2025–2035
  • Figure 72: Western Europe Demand and Sales Analysis of Paper Cup in Japan Attractiveness Analysis by Capacity / Wall Type
  • Figure 73: Western Europe Demand and Sales Analysis of Paper Cup in Japan Value Share and BPS Analysis by Material, 2025 and 2035
  • Figure 74: Western Europe Demand and Sales Analysis of Paper Cup in Japan Y-o-Y Growth Comparison by Material, 2025–2035
  • Figure 75: Western Europe Demand and Sales Analysis of Paper Cup in Japan Attractiveness Analysis by Material
  • Figure 76: Western Europe Demand and Sales Analysis of Paper Cup in Japan Value Share and BPS Analysis by Coatings, 2025 and 2035
  • Figure 77: Western Europe Demand and Sales Analysis of Paper Cup in Japan Y-o-Y Growth Comparison by Coatings, 2025–2035
  • Figure 78: Western Europe Demand and Sales Analysis of Paper Cup in Japan Attractiveness Analysis by Coatings
  • Figure 79: Western Europe Demand and Sales Analysis of Paper Cup in Japan Value Share and BPS Analysis by Distribution Channel, 2025 and 2035
  • Figure 80: Western Europe Demand and Sales Analysis of Paper Cup in Japan Y-o-Y Growth Comparison by Distribution Channel, 2025–2035
  • Figure 81: Western Europe Demand and Sales Analysis of Paper Cup in Japan Attractiveness Analysis by Distribution Channel
  • Figure 82: Western Europe Demand and Sales Analysis of Paper Cup in Japan Value Share and BPS Analysis by Applications, 2025 and 2035
  • Figure 83: Western Europe Demand and Sales Analysis of Paper Cup in Japan Y-o-Y Growth Comparison by Applications, 2025–2035
  • Figure 84: Western Europe Demand and Sales Analysis of Paper Cup in Japan Attractiveness Analysis by Applications
  • Figure 85: Western Europe Demand and Sales Analysis of Paper Cup in Japan Value Share and BPS Analysis by End-Use, 2025 and 2035
  • Figure 86: Western Europe Demand and Sales Analysis of Paper Cup in Japan Y-o-Y Growth Comparison by End-Use, 2025–2035
  • Figure 87: Western Europe Demand and Sales Analysis of Paper Cup in Japan Attractiveness Analysis by End-Use
  • Figure 88: Eastern Europe Demand and Sales Analysis of Paper Cup in Japan Value Share and BPS Analysis by Country, 2025 and 2035
  • Figure 89: Eastern Europe Demand and Sales Analysis of Paper Cup in Japan Value Share and BPS Analysis by Capacity / Wall Type , 2025 and 2035
  • Figure 90: Eastern Europe Demand and Sales Analysis of Paper Cup in Japan Y-o-Y Growth Comparison by Capacity / Wall Type , 2025–2035
  • Figure 91: Eastern Europe Demand and Sales Analysis of Paper Cup in Japan Attractiveness Analysis by Capacity / Wall Type
  • Figure 92: Eastern Europe Demand and Sales Analysis of Paper Cup in Japan Value Share and BPS Analysis by Material, 2025 and 2035
  • Figure 93: Eastern Europe Demand and Sales Analysis of Paper Cup in Japan Y-o-Y Growth Comparison by Material, 2025–2035
  • Figure 94: Eastern Europe Demand and Sales Analysis of Paper Cup in Japan Attractiveness Analysis by Material
  • Figure 95: Eastern Europe Demand and Sales Analysis of Paper Cup in Japan Value Share and BPS Analysis by Coatings, 2025 and 2035
  • Figure 96: Eastern Europe Demand and Sales Analysis of Paper Cup in Japan Y-o-Y Growth Comparison by Coatings, 2025–2035
  • Figure 97: Eastern Europe Demand and Sales Analysis of Paper Cup in Japan Attractiveness Analysis by Coatings
  • Figure 98: Eastern Europe Demand and Sales Analysis of Paper Cup in Japan Value Share and BPS Analysis by Distribution Channel, 2025 and 2035
  • Figure 99: Eastern Europe Demand and Sales Analysis of Paper Cup in Japan Y-o-Y Growth Comparison by Distribution Channel, 2025–2035
  • Figure 100: Eastern Europe Demand and Sales Analysis of Paper Cup in Japan Attractiveness Analysis by Distribution Channel
  • Figure 101: Eastern Europe Demand and Sales Analysis of Paper Cup in Japan Value Share and BPS Analysis by Applications, 2025 and 2035
  • Figure 102: Eastern Europe Demand and Sales Analysis of Paper Cup in Japan Y-o-Y Growth Comparison by Applications, 2025–2035
  • Figure 103: Eastern Europe Demand and Sales Analysis of Paper Cup in Japan Attractiveness Analysis by Applications
  • Figure 104: Eastern Europe Demand and Sales Analysis of Paper Cup in Japan Value Share and BPS Analysis by End-Use, 2025 and 2035
  • Figure 105: Eastern Europe Demand and Sales Analysis of Paper Cup in Japan Y-o-Y Growth Comparison by End-Use, 2025–2035
  • Figure 106: Eastern Europe Demand and Sales Analysis of Paper Cup in Japan Attractiveness Analysis by End-Use
  • Figure 107: East Asia Demand and Sales Analysis of Paper Cup in Japan Value Share and BPS Analysis by Country, 2025 and 2035
  • Figure 108: East Asia Demand and Sales Analysis of Paper Cup in Japan Value Share and BPS Analysis by Capacity / Wall Type , 2025 and 2035
  • Figure 109: East Asia Demand and Sales Analysis of Paper Cup in Japan Y-o-Y Growth Comparison by Capacity / Wall Type , 2025–2035
  • Figure 110: East Asia Demand and Sales Analysis of Paper Cup in Japan Attractiveness Analysis by Capacity / Wall Type
  • Figure 111: East Asia Demand and Sales Analysis of Paper Cup in Japan Value Share and BPS Analysis by Material, 2025 and 2035
  • Figure 112: East Asia Demand and Sales Analysis of Paper Cup in Japan Y-o-Y Growth Comparison by Material, 2025–2035
  • Figure 113: East Asia Demand and Sales Analysis of Paper Cup in Japan Attractiveness Analysis by Material
  • Figure 114: East Asia Demand and Sales Analysis of Paper Cup in Japan Value Share and BPS Analysis by Coatings, 2025 and 2035
  • Figure 115: East Asia Demand and Sales Analysis of Paper Cup in Japan Y-o-Y Growth Comparison by Coatings, 2025–2035
  • Figure 116: East Asia Demand and Sales Analysis of Paper Cup in Japan Attractiveness Analysis by Coatings
  • Figure 117: East Asia Demand and Sales Analysis of Paper Cup in Japan Value Share and BPS Analysis by Distribution Channel, 2025 and 2035
  • Figure 118: East Asia Demand and Sales Analysis of Paper Cup in Japan Y-o-Y Growth Comparison by Distribution Channel, 2025–2035
  • Figure 119: East Asia Demand and Sales Analysis of Paper Cup in Japan Attractiveness Analysis by Distribution Channel
  • Figure 120: East Asia Demand and Sales Analysis of Paper Cup in Japan Value Share and BPS Analysis by Applications, 2025 and 2035
  • Figure 121: East Asia Demand and Sales Analysis of Paper Cup in Japan Y-o-Y Growth Comparison by Applications, 2025–2035
  • Figure 122: East Asia Demand and Sales Analysis of Paper Cup in Japan Attractiveness Analysis by Applications
  • Figure 123: East Asia Demand and Sales Analysis of Paper Cup in Japan Value Share and BPS Analysis by End-Use, 2025 and 2035
  • Figure 124: East Asia Demand and Sales Analysis of Paper Cup in Japan Y-o-Y Growth Comparison by End-Use, 2025–2035
  • Figure 125: East Asia Demand and Sales Analysis of Paper Cup in Japan Attractiveness Analysis by End-Use
  • Figure 126: South Asia and Pacific Demand and Sales Analysis of Paper Cup in Japan Value Share and BPS Analysis by Country, 2025 and 2035
  • Figure 127: South Asia and Pacific Demand and Sales Analysis of Paper Cup in Japan Value Share and BPS Analysis by Capacity / Wall Type , 2025 and 2035
  • Figure 128: South Asia and Pacific Demand and Sales Analysis of Paper Cup in Japan Y-o-Y Growth Comparison by Capacity / Wall Type , 2025–2035
  • Figure 129: South Asia and Pacific Demand and Sales Analysis of Paper Cup in Japan Attractiveness Analysis by Capacity / Wall Type
  • Figure 130: South Asia and Pacific Demand and Sales Analysis of Paper Cup in Japan Value Share and BPS Analysis by Material, 2025 and 2035
  • Figure 131: South Asia and Pacific Demand and Sales Analysis of Paper Cup in Japan Y-o-Y Growth Comparison by Material, 2025–2035
  • Figure 132: South Asia and Pacific Demand and Sales Analysis of Paper Cup in Japan Attractiveness Analysis by Material
  • Figure 133: South Asia and Pacific Demand and Sales Analysis of Paper Cup in Japan Value Share and BPS Analysis by Coatings, 2025 and 2035
  • Figure 134: South Asia and Pacific Demand and Sales Analysis of Paper Cup in Japan Y-o-Y Growth Comparison by Coatings, 2025–2035
  • Figure 135: South Asia and Pacific Demand and Sales Analysis of Paper Cup in Japan Attractiveness Analysis by Coatings
  • Figure 136: South Asia and Pacific Demand and Sales Analysis of Paper Cup in Japan Value Share and BPS Analysis by Distribution Channel, 2025 and 2035
  • Figure 137: South Asia and Pacific Demand and Sales Analysis of Paper Cup in Japan Y-o-Y Growth Comparison by Distribution Channel, 2025–2035
  • Figure 138: South Asia and Pacific Demand and Sales Analysis of Paper Cup in Japan Attractiveness Analysis by Distribution Channel
  • Figure 139: South Asia and Pacific Demand and Sales Analysis of Paper Cup in Japan Value Share and BPS Analysis by Applications, 2025 and 2035
  • Figure 140: South Asia and Pacific Demand and Sales Analysis of Paper Cup in Japan Y-o-Y Growth Comparison by Applications, 2025–2035
  • Figure 141: South Asia and Pacific Demand and Sales Analysis of Paper Cup in Japan Attractiveness Analysis by Applications
  • Figure 142: South Asia and Pacific Demand and Sales Analysis of Paper Cup in Japan Value Share and BPS Analysis by End-Use, 2025 and 2035
  • Figure 143: South Asia and Pacific Demand and Sales Analysis of Paper Cup in Japan Y-o-Y Growth Comparison by End-Use, 2025–2035
  • Figure 144: South Asia and Pacific Demand and Sales Analysis of Paper Cup in Japan Attractiveness Analysis by End-Use
  • Figure 145: Middle East & Africa Demand and Sales Analysis of Paper Cup in Japan Value Share and BPS Analysis by Country, 2025 and 2035
  • Figure 146: Middle East & Africa Demand and Sales Analysis of Paper Cup in Japan Value Share and BPS Analysis by Capacity / Wall Type , 2025 and 2035
  • Figure 147: Middle East & Africa Demand and Sales Analysis of Paper Cup in Japan Y-o-Y Growth Comparison by Capacity / Wall Type , 2025–2035
  • Figure 148: Middle East & Africa Demand and Sales Analysis of Paper Cup in Japan Attractiveness Analysis by Capacity / Wall Type
  • Figure 149: Middle East & Africa Demand and Sales Analysis of Paper Cup in Japan Value Share and BPS Analysis by Material, 2025 and 2035
  • Figure 150: Middle East & Africa Demand and Sales Analysis of Paper Cup in Japan Y-o-Y Growth Comparison by Material, 2025–2035
  • Figure 151: Middle East & Africa Demand and Sales Analysis of Paper Cup in Japan Attractiveness Analysis by Material
  • Figure 152: Middle East & Africa Demand and Sales Analysis of Paper Cup in Japan Value Share and BPS Analysis by Coatings, 2025 and 2035
  • Figure 153: Middle East & Africa Demand and Sales Analysis of Paper Cup in Japan Y-o-Y Growth Comparison by Coatings, 2025–2035
  • Figure 154: Middle East & Africa Demand and Sales Analysis of Paper Cup in Japan Attractiveness Analysis by Coatings
  • Figure 155: Middle East & Africa Demand and Sales Analysis of Paper Cup in Japan Value Share and BPS Analysis by Distribution Channel, 2025 and 2035
  • Figure 156: Middle East & Africa Demand and Sales Analysis of Paper Cup in Japan Y-o-Y Growth Comparison by Distribution Channel, 2025–2035
  • Figure 157: Middle East & Africa Demand and Sales Analysis of Paper Cup in Japan Attractiveness Analysis by Distribution Channel
  • Figure 158: Middle East & Africa Demand and Sales Analysis of Paper Cup in Japan Value Share and BPS Analysis by Applications, 2025 and 2035
  • Figure 159: Middle East & Africa Demand and Sales Analysis of Paper Cup in Japan Y-o-Y Growth Comparison by Applications, 2025–2035
  • Figure 160: Middle East & Africa Demand and Sales Analysis of Paper Cup in Japan Attractiveness Analysis by Applications
  • Figure 161: Middle East & Africa Demand and Sales Analysis of Paper Cup in Japan Value Share and BPS Analysis by End-Use, 2025 and 2035
  • Figure 162: Middle East & Africa Demand and Sales Analysis of Paper Cup in Japan Y-o-Y Growth Comparison by End-Use, 2025–2035
  • Figure 163: Middle East & Africa Demand and Sales Analysis of Paper Cup in Japan Attractiveness Analysis by End-Use
  • Figure 164: Global Demand and Sales Analysis of Paper Cup in Japan – Tier Structure Analysis
  • Figure 165: Global Demand and Sales Analysis of Paper Cup in Japan – Company Share Analysis
Dashboard
Dashboard
Dashboard
Dashboard
Dashboard
Dashboard

Full Research Suite comprises of:

Market outlook & trends analysis

Market outlook & trends analysis

Interviews & case studies

Interviews & case studies

Strategic recommendations

Strategic recommendations

Vendor profiles & capabilities analysis

Vendor profiles & capabilities analysis

5-year forecasts

5-year forecasts

8 regions and 60+ country-level data splits

8 regions and 60+ country-level data splits

Market segment data splits

Market segment data splits

12 months of continuous data updates

12 months of continuous data updates

DELIVERED AS:

PDF EXCEL ONLINE

Full Research Suite


$5000

$7500

$10000

Buy Report Now
Similar Industry Reports

Similar Industry Reports

Demand Signal Repository Solutions Market

Demand Signal Repository Solutions Market Size and Share Forecast Outlook 2025 to 2035

Demand Side Management Market

Demand Side Management Market Size and Share Forecast Outlook 2025 to 2035

Demand Response Market

Demand Response Market Analysis - Size, Share, and Forecast Outlook 2025 to 2035

Demand for Industrial Chocolate in EU

Demand for Industrial Chocolate in EU Size and Share Forecast Outlook 2025 to 2035

Demand for Industrial & Institutional Cleaning Products in EU

Demand for Industrial & Institutional Cleaning Products in EU Size and Share Forecast Outlook 2025 to 2035

Demand for Joint Compound in EU

Demand for Joint Compound in EU Size and Share Forecast Outlook 2025 to 2035

Demand for Taurine in EU

Demand for Taurine in EU Size and Share Forecast Outlook 2025 to 2035

Demand for Kaolin in India

Demand for Kaolin in India Size and Share Forecast Outlook 2025 to 2035

Demand for DMPA in EU

Demand for DMPA in EU Size and Share Forecast Outlook 2025 to 2035

Demand for 3D Printing Materials in Middle East

Demand for 3D Printing Materials in Middle East Size and Share Forecast Outlook 2025 to 2035

Demand for Protein-rich Shelf-stable UHT Oat Drinks in Latin America

Demand for Protein-rich Shelf-stable UHT Oat Drinks in Latin America Size and Share Forecast Outlook 2025 to 2035

Demand for Yeast in EU

Demand for Yeast in EU Size and Share Forecast Outlook 2025 to 2035

Demand for Oat Drink in EU

Demand for Oat Drink in EU Size and Share Forecast Outlook 2025 to 2035

Demand for Vanillin in EU

Demand for Vanillin in EU Size and Share Forecast Outlook 2025 to 2035

Demand for Spirulina Extract in EU

Demand for Spirulina Extract in EU Size and Share Forecast Outlook 2025 to 2035

Demand for Pulse Ingredients in EU

Demand for Pulse Ingredients in EU Size and Share Forecast Outlook 2025 to 2035

Demand for Gypsum in EU

Demand for Gypsum in EU Size and Share Forecast Outlook 2025 to 2035

Demand for Barite in EU

Demand for Barite in EU Size and Share Forecast Outlook 2025 to 2035

Demand for Shrimp in the EU

Demand for Shrimp in the EU Size and Share Forecast Outlook 2025 to 2035

Demand for Mezcal in EU

Demand for Mezcal in EU Size and Share Forecast Outlook 2025 to 2035

Future Market Insights

Demand and Sales Analysis of Paper Cup in Japan

Chat With MaRIA

Chat With

MaRIA

Hi There, I am MaRIA, Your Market Research Intelligence Assistant. How may I help you?