This site uses cookies, including third-party cookies, that help us to provide and improve our services.

Privacy Policy
- Global Locations -
Headquarters
Future Market Insights, Inc.
Christiana Corporate, 200 Continental Drive, Suite 401, Newark, Delaware - 19713, United States
T: +1-845-579-5705
MEA
Market Access DMCC

1602-6 Jumeirah Bay X2 Tower, Plot No: JLT-PH2-X2A,

Jumeirah Lakes Towers, Dubai,

United Arab Emirates

Americas
Future Market Insights
616 Corporate Way, Suite 2-9018,
Valley Cottage, NY 10989,
United States
T: +1-347-918-3531
Europe
Future Market Insights
3rd Floor, 207 Regent Street,
London W1B 3HH
United Kingdom
T: + 44 (0) 20 8123 9659
D: +44 (0) 20 3287 4268
APAC
Future Market Insights
Office No. 401-A, 4th Floor,
VANTAGE 9, S.No. 36/1/1,
Baner, Pune 411045 India

Bubble Tea Market

What’s Driving Netizens to Drool Over the Sundry Flavours of Bubble Tea? Explore Top Insights with FMI

Bubble Tea Market by Base Ingredient, Sugar Content, Toppings, Distribution Channel & Region - Forecast 2022 - 2032

Bubble Tea Market Outlook (2022-2032)

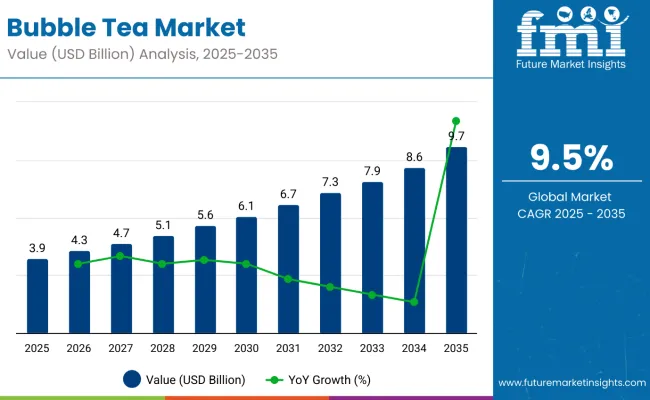
[324 Pages Report] The global bubble tea market is projected to have a rapid-paced CAGR of 8.8% during the forecast period. The current valuation of the market is US$ 2.50 billion in 2022. The market value of the bubble tea market is anticipated to reach a high of US$ 5.82 billion by the year 2032. A historical CAGR of 7.1% has been recorded by the experts of Future Market Insights for the concerned market.

Report Attribute

Details

Bubble Tea Market Value (2022)

US$ 2.50 Billion

Bubble Tea Market Anticipated Value (2032)

US$ 5.82 Billion

Bubble Tea Projected Growth Rate (2022-2032)

8.8%

The bubble tea market has a rapid expansion as this drink is diverse in nature, with most bubble tea recipes containing the base mixed with fruit and milk, with chewy tapioca balls that are gaining momentum amongst the populace due to their slushy consistency. It offers a wide variety of bubble tea flavors and is made with sundry ingredients. It is being identified as a modified beverage and is gaining immense popularity across mature regions.

Key factors propelling the bubble tea market growth can be identified as the rising consumption of tea and nootropic drinks amongst the working-class populace and the students, coupled with zero fat and low-calorie contents made available at bubble tea stores, which is a prime factor fueling the demand for bubble tea further in the global market. Therefore, it is anticipated that the bubble tea market is likely to have significant growth at an impressive pace during the forecast period.

Customize this Report

Let us know your requirement to get
100% FREE customization

Historical Comparison of the Bubble Tea Market

As per the statistics recorded by the experts of Future Market Insights, the bubble tea market has had a steady progression over the recent years and has substantially attained growth from a CAGR of 7.1% in 2017-2021 to a CAGR of 8.8% in the period 2022-2032.

This growth can be attributed to the global adoption and improving availability of bubble tea, enabling sales of this unique beverage in diverse markets.

The contribution of social media is a significant factor that played a critical role in making bubble tea popular across the globe. In addition to that, health experts have recommended that moderate consumption of bubble tea boosts concentration and improves brain function, which has also augmented the market expansion over the years, thereby increasing the popularity of this beverage.

Aspects Leading to the Adoption of Bubble Tea – Key Trends

Numerous assortments of beverages are being consumed with a wide scope of fixings. It has been witnessed while analyzing the market that air pocket milk green tea with custard and bubble milk tea with custard are the two most devoured varieties among people.

As mentioned earlier, social media plays a crucial role in determining the market growth of bubble tea, and the key players are developing a sensation by crafting beautiful drinks and encouraging the customers to click and share artistic pictures of the unique beverage online.

It is anticipated that bubble tea franchises are owned and operated by young, well, educated, social media savvy entrepreneurs looking out for new business prospects, increasing the consumer base across demographics, and determining the ways of appropriate expansion.

Nandini Roy Choudhury
Principal Consultant
LinkedIn
Talk to Analyst

Find your sweet spots for generating winning opportunities in this market.

Talk to Analyst

Comparative Analysis of Adjacent Tea Markets

Bubble Tea Market:

Differentiating Aspects

Bubble Tea Market

CAGR in 2022-2032

9.8%

Current Valuation in 2022

2.50 Billion

Projected Valuation in 2032

5.82 Billion

Demand Drivers

  • Consumption of flavored bubble tea in the young generation boosts the market growth.
  • Aggressive advertisements and celebrity endorsements paving way for market growth.

Green Tea Market:

Differentiating Aspects

Green Tea Market

CAGR in 2022-2032

7.48%

Current Valuation in 2022

15.42 Billion

Projected Valuation in 2032

31.72 Billion

Demand Drivers

  • The presence of medicinal and antioxidant properties determines changes in consumer preferences.
  • Rise of on-the-go nutrition and healthy hydration.

Fruit Tea Market:

Differentiating Aspects

Fruit Tea Market

CAGR in 2022-2032

8.10%

Current Valuation in 2022

1.24 Billion

Projected Valuation in 2032

2.71 Billion

Demand Drivers

  • The growing popularity of organic fruit tea and demand for innovative flavors and healthy lifestyles.
  • Health consciousness and shift of consumer preference towards customized tea gift sets.

Factors Channeling the Propulsion of the Bubble Tea Market

The experts at FMI have revealed that a number of aspects are fueling the market growth for bubble tea and these factors are likely to strengthen the forum in the coming years.

  • Inclination of Consumers Towards Versatile Teas: Bubble tea is creating a buzz in the food and beverage industry. The growing interest of consumers for innovative beverages with bold flavors is positively impacting the market towards expansion.
  • Rising Health Consciousness: This beverage has a lot of added health benefits. It acts as an antioxidant agent that helps in slowing cell damage, and the anti-inflammatory properties of bubble tea lower cholesterol levels and triglycerides levels in the body. It is also anticipated to serve effectively against depression and other health issues.
  • Wide Range of Products Attracting Millennials: The wide variety of flavors like fruit, green jasmine, and black tea are consumed largely. The lactose-intolerant population is being provided with innumerable options is aiding the growth of the bubble tea market.
MarketNage
Become a MarketNgage Insider

A unified Market Research Subscription Platform, built for today's disparate research needs.

Elements Impeding the Growth of the Bubble Tea Market

Besides the driving factors, a range of aspects is identified that are likely to hinder the growth of the market in the coming years. They are:

  • Availability of Other Caffeinated Drinks: Despite the burgeoning demand for bubble tea as an innovative beverage, the wide availability of other caffeinated drinks like ready-to-drink beverages like cold-brew, sparkling canned coffee, snap chilled brew, nitro-chilled brew, and others are more likely to suit the on-the-go lifestyle of people and influence the consumption trends largely. This is going to restrain the market growth for bubble tea during the forecast period.
  • High Sugar Content: It is identified that bubble tea has an excess amount of sugar content and can lead to several health issues like diabetes and others, thereby affecting the market to propel at a sluggish growth rate during the forecast period.
  • Presence of Artificial Preservatives: The populace is identified to have a rising preference for organic beverages and it is anticipated that bubble tea contains a lot of artificial preservatives, which is a factor likely to restraint the growth of the bubble tea market in the period 2022-2032.

Category-Wise Segments Dominating the Bubble Tea Market

Let’s take a stroll across the key segments gaining traction in the bubble tea market:

Green Tea – By Base Ingredient

Consumers are shifting towards natural and organic ingredients, and the experts of FMI have revealed during the analysis that the green tea segment is projected to dominate at a significant CAGR of 11.4% during the forecast period.

This segment is expected to hold a market share of 38% of the overall bubble tea sales worldwide. This segment is gaining momentum owing to the rising health consciousness of the population, which is preventing them from gaining weight and inducing weight loss with regular consumption. Green tea has also shown long-term energy-inducing properties that is imparting a positive impact on the regulation of body metabolism, simultaneously propelling the market growth.

Fruit Flavor – By Flavor

The fruit flavor segment is the most popular amongst consumers. It includes flavor variants such as lychee, passion fruit, mango, plum, avocado, strawberry, banana, grape, lemon, and others.

This segment is expected to grow significantly throughout the forecast period due to its high nutritional value, organic nature, and sugar-free properties, s compared to the other artificial flavors. This sugar-free fruit segment is likely to hold 26% of the total market share and advance at a CAGR of 11.8% during the estimated period.

Online Retailing – By Distribution Channel

Online retailing is projected to dominate the distribution channel segment and it is the fastest growing segment owing to increasing consumers preferring the convenience it offers.

It is estimated to register a healthy growth of 11.9% CAGR during the forecast period. Several bubble tea brands offer online and offline delivery of their products that are pre-booked and arranged to be delivered at a specific time.

Regional Outlook

North America Growth Outlook in Bubble Tea Market

North America is expected to have significant growth in the bubble tea market in the coming years.

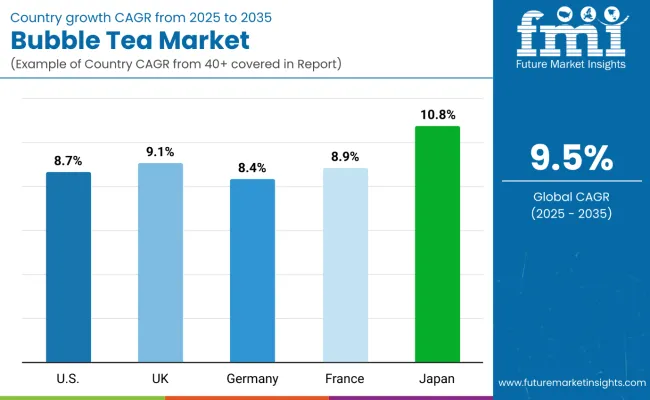
The U.S. is projected to dominate the market in this region with a growth rate of 12.4%. The base year in his region witnessed a greater global awareness about the relationship between diseases and meat consumption, which contributed to a 40% increase in vegans in this country.

In affluent countries like the U.S. and Canada, the population is increasingly consuming vegan food and plant-based diets. Therefore, numerous bubble tea manufacturers in these countries are offering plant-based dairy alternatives. Fruity beverages are also highly preferred by the populace which is influencing the bubble tea market growth in this region.

Asia Pacific to Dominate the Bubble Tea Market

The Asia Pacific region is projected to hold the highest share of the global boba tea market. Currently, the region is advancing at a rapid pace of 10.7% CAGR and is likely to gain further momentum in the coming years, Vietnam and Taiwan are expected to have the largest sales of bubble tea.

According to FMI’s analysis, China market is forecast to grow at a CAGR of 7.5% and is currently identified as the major bubble tea manufacturer in the global market. Consumers are having high expenditure on healthy beverages and the ongoing projects are expected to further boost the growth in this region.

Facets Driving Bubble Tea Demand in Singapore

Singapore bubble tea market is gaining quote traction and adopting the ongoing trends prevailing in the market. It is projected that the Singapore market is going to propel at a rapid pace of 10.7% CAGR during the estimated period 2022-2032.

The presence of the key market players in this region like Gong Cha, Koi, and others are factors attributing to the growth of the market in this country. Additionally, many manufacturers are launching new cafes and restaurants in Singapore to attract consumers and fortify their market presence, positively contributing to the market growth for bubble tea.

Start-Up Ecosystem

Efforts of New Entrants Brewing the Bubble Tea Market

The start-ups in the bubble tea marketplace are making continuous efforts to innovate the beverage to further appeal to the changing preferences and demands of the consumers. They are indulging in collaborations and making investments in research and development activities to boost the demand for bubble tea.

Two Top Start-Ups identified

Dr. Bubbles, a start-up launched in the year 2015, is offering a new variety of tea to the Indians. This start-up company has a diversified bouquet of snacks and drinks and is on track for competing with major players. They have replaced the bubble topping of tapioca pearls with juice bubbles and juice jellies, and this product is widely liked by the people in India.

Bobluv, is touted as a first-of-its-kind boba tea that is ready-to-drink-no mixing or at-home preparation required-and has less than 50 calories and one gram of sugar per 9.5-ounce bottle. It’s also keto-friendly, gluten-free, and packed with antioxidants like vitamin C. So far, Bubluv offers three flavors: black milk tea, matcha soy latte, and passionfruit oolong guava-each with Bubluv’s tapioca pearls.

Some other start-up companies gaining traction are tiger Sugar, the Alley, and others.

Competitive Landscape

Biggies Revolutionizing the Bubble Tea Market

The manufacturers are capitalizing on improving the functionality of bubble tea ingredients to cater to the rising demand of consumers. They are majorly focusing on product development and are also emphasizing offering certified products through quality system control in order to increase their brand value.

Top Three Manufacturers Venturing Innovation

  • Chill Bubble Tea provides bubble tea that is kosher, halal, gluten-free, and gelatin-free. It also provides tea for vegan and lactose-free customers.
  • Frothtea Bubble Tea acquired Singapore Food Agency Certification adhering to strict food hygiene practices and guidelines. It is also affiliated with Halal Certification for its raw materials.
  • TACHUNGHO has international certifications such as ISO 9001, ISO 22000, HACCP, and HALAL, as well as significant quality system certifications and major agency safety certificates.

Recent Developments

Some of the recent developments identified are:

Company Name

Secret Recipe

Year Of Development

2019

Descriptio

This firm joined the bubble tea bandwagon in 2019. A series of bubble tea flavors such as boba brown sugar with milk, boba caramel milk tea, boba milk tea, boba brown sugar milk tea, boba kopi-C, boba midnight blue, boba signature fruit tea, and boba cham were released.

Company Name

Chatime Malaysia Sdn Bhd

Year Of Development

2019

Descriptio

This firm in its five-year expansion plan revealed that the company intended to aggressively expand its footprints into the overseas bubble tea market in Singapore, U.S., India, and Saudi Arabia.

Company Name

Bubble Tea Supply Inc.

Year Of Development

2020

Descriptio

This company announced its debut of bubble tea in April, with a range of tastes in Bubble Tea Club, including traditional milk, mango, green apples, lychees, Thai and fruity flavors of honeydew, and a range of 14 toppings.

Company Name

Gong Cha

Year Of Development

2021

Descriptio

In addition to growing its market presence, Gong cha is expanding its bubble tea offerings in 2021, continuing the company’s well-known product innovation. This includes the February launch of the company’s Chocolate Lava Series and the return of the popular Little Star Jelly Series, and in April, a Heart Shaped Jelly Series of bubble tea, including Strawberry Honey Tea, Strawberry Milk Tea, and Strawberry Smoothie flavors.

Key companies proliferating in the bubble tea market

  • Bobabox Ltd.
  • Bubble Tea House Company
  • Fokus, Inc.
  • Gong Cha
  • ChaTime
  • Lollicup USA, Inc.
  • Bubble Tea Supply, Inc.
  • T Bun International
  • Ten Ren's Tea Time
  • Troika JC

Key Segments in the Bubble Tea Market

By Base Ingredient:

  • Black Tea
  • Green Tea
  • Oolong Tea
  • White Tea
  • Others

By Sugar Content:

  • Regular
  • Reduced Sugar/Sugar-Free

By Toppings:

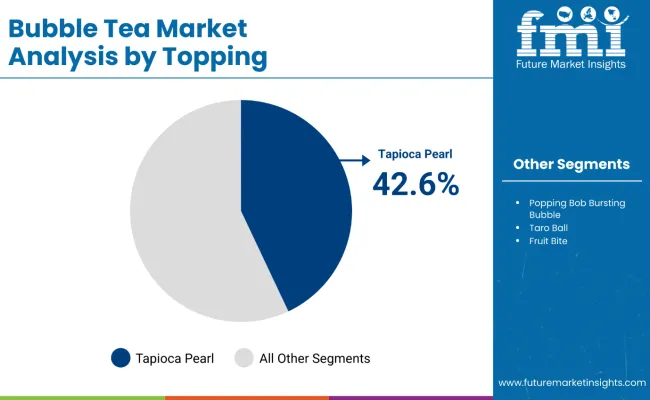
  • Pearl
  • Grass Jelly
  • Coconut Jelly
  • Red Bean
  • Multiple/Others

By Distribution Channel:

  • Direct (B2B)
  • Indirect (B2C)
  • Online Reatailing

By Region:

  • North America
  • Latin America
  • Asia Pacific
  • MEA
  • Europe

Frequently Asked Questions

The growth outlook for the bubble tea market is predicted to advance at a CAGR of 8.8% from 2022-to 2032.

The Asia Pacific region is anticipated to lead the bubble tea market during the forecast period.

The market valuation of the bubble tea market stands at US$ 2.50 Billion in 2022.

The bubble tea market is likely to hold a valuation of US$ 5.82 Billion by 2032.

The food & beverages sector is the key driver in the bubble tea market.

Table of Content

1. Market Introduction

    1.1. Market Definition

    1.2. Market Taxonomy

2. Key Market Trends 

    2.1. Key Trends Impacting the Market

    2.2. Product Innovation/Development Trends

    2.3. Product Oriented Market Buzz

3. Key Trends Impacting the Market

    3.1. Marketers Reach Out to Millennial

    3.2. Desirable Health Claims by Manufacturers and Brand Owners

    3.3. Growing Demands for Marine By Products

    3.4. Product Innovation / Development Trends

        3.4.1. Cultural Customization to Target Specific Population and

        3.4.2. Ethnic Group

        3.4.3. Creating New Delivery Mechanisms

        3.4.4. Indication Specific Products

        3.4.5. Shift Toward Natural Ingredients

        3.4.6. Preferential Inclination towards Non-Modified Convenience

        3.4.7. Ingredients

        3.4.8. Toppings to Suit Customer Orientation

        3.4.9. Brand Differentiation through Toppings

    3.5. Product Oriented Market Buzz

        3.5.1. Common product categories yet influential

        3.5.2. Rare in the portfolio, albeit promises value return

        3.5.3. Attractive segments for all Market Actors

        3.5.4. Transformed product attributes

4. Market Background & Associated Industry Statistics

    4.1. Global Market Overview

    4.2. Demand Assessment – Market

        4.2.1. % of demand – by Price Range

            4.2.1.1. Economic

            4.2.1.2. Mid-Range

            4.2.1.3. Premium

    4.3. V/s Economic Cat Food: Which is likely to Grow?

    4.4. Market Dynamics

        4.4.1. Macro-economic Factors

        4.4.2. Drivers

            4.4.2.1. Economic Drivers

            4.4.2.2. Supply Side Drivers

            4.4.2.3. Demand Side Drivers

        4.4.3. Market Restraints

        4.4.4. Forecast factors – Relevance and Impact

        4.4.5. Key Regulations and Claims

    4.5. Demand Assessment – Market

        4.5.1. % of Demand - by Special Diet Needs (2020 and 2030)

            4.5.1.1. Gluten-free

            4.5.1.2. Vegan

            4.5.1.3. Organic

            4.5.1.4. High Protein

            4.5.1.5. Dairy-Free

            4.5.1.6. Soy-Free

            4.5.1.7. Fat-Free

            4.5.1.8. Fortified Food

5. Consumer Sentiment Analysis

    5.1. Consumer Sentimental Analysis

        5.1.1. Factors influencing consumer behaviour

        5.1.2. Which specific brand is preferred by the consumers and why?

        5.1.3. How consumers perceive the existing brands in terms of value for money and how important is brand for a customer?

        5.1.4. Which factor would consumers like to change among the currently available products

        5.1.5. Are consumers ready to pay premium price for Bubble Tea?

        5.1.6. Does social media influence customer’s decision making?

        5.1.7. Which mode of advertisement do vendors prefer?

        5.1.8. Which of the social media platforms does companies prefers for branding?

        5.1.9. What are the key challenges associated with the suppliers?

        5.1.10. Others

    5.2. Social Media Sentimental Analysis

        5.2.1. Consumer perception for products on social media platforms-Positive and Negative Mentions

        5.2.2. Trending Brands

        5.2.3. Social Media Platform Mentions (% of total mentions)

        5.2.4. Region-wise Social Media Mentions (% total mentions)

        5.2.5. Overall Sentiment on Social Media Platforms- By Toppings

        5.2.6. Others

6. Scenario Assessment of the Impact of COVID-19 on Industry 

    6.1. Current Scenario/ Immediate Actions

    6.2. Global Industry Forecast Scenario Comparison of Annual Growth Rates for short Term (2020-2023) and Long Term (2024-2030) Tortillas

        6.2.1. Optimistic Scenario

            6.2.1.1. China

            6.2.1.2. US

            6.2.1.3. Euro Zone

            6.2.1.4. Asia

            6.2.1.5. Rest of the World

        6.2.2. Likely Scenario

            6.2.2.1. China

            6.2.2.2. US

            6.2.2.3. Euro Zone

            6.2.2.4. Asia

            6.2.2.5. Rest of the World

        6.2.3. Pessimistic Scenario

            6.2.3.1. China

            6.2.3.2. US

            6.2.3.3. Euro Zone

            6.2.3.4. Asia

            6.2.3.5. Rest of the World

        6.2.4. Key Factors Impacting the Market

7. Market Dynamics

    7.1. Drivers

    7.2. Restraints

    7.3. Opportunity

8. Policy and Regulatory Landscape

    8.1. Dietary Supplement Health and Education Act (DSHEA)

    8.2. Europe Food & Safety Authority

    8.3. State Food and Drug Administration (SFDA)

    8.4. FSSAI

    8.5. Food Toppings Claims

    8.6. Labelling and Claims

    8.7. Import/Export Regulations

9. Supply Chain Analysis

    9.1. Profitability and Gross Margin Analysis By Competition

    9.2. List of Active Participants- By Region

        9.2.1. Raw Material Suppliers

        9.2.2. Key Manufacturers/ Brands

10. Global Market Demand Analysis 2016-2020 and Forecast, 2022-2032

    10.1. Historical Market Volume (MT) Analysis, 2016-2020

    10.2. Current and Future Market Volume (MT) Projections, 2022-2032

    10.3. Y-o-Y Growth Trend Analysis

11. Global Market Pricing Analysis (2022-2032)

    11.1. Price Point Assessment by Base Ingredient

    11.2. Price Point Assessment by Region

        11.2.1. Manufacturer Level Pricing

        11.2.2. Distributor Level Pricing

        11.2.3. Retailer Level Pricing

    11.3. Price Forecast till 2030

    11.4. Factors Affecting Pricing

12. Global Market Demand (US$ Mn) Analysis 2016-2020 and Forecast, 2022-2032

    12.1. Historical Market Value (US$ Mn) Analysis, 2016-2020

    12.2. Current and Future Market Value (US$ Mn) Projections, 2022-2032

        12.2.1. Y-o-Y Growth Trend Analysis

        12.2.2. Absolute $ Opportunity Analysis

13. Global Market Analysis By Base Ingredient

    13.1. Introduction

        13.1.1. Y-o-Y Growth Comparison By Base Ingredient

        13.1.2. Basis Point Share (BPS) Analysis By Base Ingredient

    13.2. Market Size (US$ Mn) and Volume (MT) Analysis (2016 - 2020) & Forecast (2022-2032) By Base Ingredient

        13.2.1. Black Tea

        13.2.2. Green Tea

        13.2.3. Oolong Tea

        13.2.4. White Tea

        13.2.5. Others

    13.3. Market Attractiveness Analysis By Base Ingredient

14. Global Market Analysis By Flavour

    14.1. Introduction

        14.1.1. Y-o-Y Growth Comparison By Flavour

        14.1.2. Basis Point Share (BPS) Analysis By Flavour

    14.2. Market Size (US$ Mn) and Volume (MT) Analysis (2016-2020) & Forecast (2022-2032) By Flavour

        14.2.1. Original

        14.2.2. Flavored

            14.2.2.1. Nut-Flavoured

            14.2.2.2. Chocolate

            14.2.2.3. Fruit

            14.2.2.4. Honey

            14.2.2.5. Mocha

            14.2.2.6. Coconut

            14.2.2.7. Caramel

            14.2.2.8. Vanilla

    14.3. Market Attractiveness Analysis By Flavour

15. Global Market Analysis By Sugar Content

    15.1. Introduction

        15.1.1. Y-o-Y Growth Comparison By Sugar Content

        15.1.2. Basis Point Share (BPS) Analysis By Sugar Content

    15.2. Market Size (US$ Mn) and Volume (MT) Analysis (2016-2020) & Forecast (2022-2032) By Sugar Content

        15.2.1. Regular

        15.2.2. Reduced Sugar/Sugar Free

    15.3. Market Attractiveness Analysis By Sugar Content

16. Global Market Analysis By Format

    16.1. Introduction

        16.1.1. Y-o-Y Growth Comparison By Format

        16.1.2. Basis Point Share (BPS) Analysis By Format

    16.2. Market Size (US$ Mn) and Volume (MT) Analysis (2016-2020) & Forecast (2022-2032) By Format

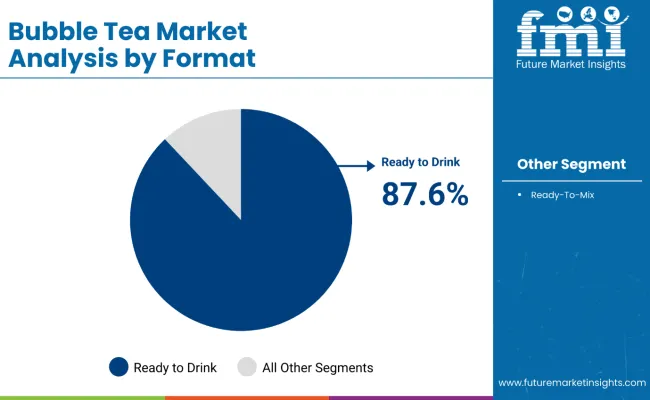
        16.2.1. Ready-to-Drink (RTD)

        16.2.2. Instant Mixes

    16.3. Market Attractiveness Analysis By Format

17. Global Market Analysis By Toppings

    17.1. Introduction

        17.1.1. Y-o-Y Growth Comparison By Toppings

        17.1.2. Basis Point Share (BPS) Analysis By Toppings

    17.2. Market Size (US$ Mn) and Volume (MT) Analysis (2016-2020) & Forecast (2022-2032) By Toppings

        17.2.1. Pearl

        17.2.2. Grass Jelly

        17.2.3. Coconut Jelly

        17.2.4. Red Bean

        17.2.5. Multiple/Others

    17.3. Market Attractiveness Analysis By Toppings

18. Global Market Analysis By Distribution Channel

    18.1. Introduction

        18.1.1. Y-o-Y Growth Comparison By Distribution Channel

        18.1.2. Basis Point Share (BPS) Analysis By Distribution Channel

    18.2. Market Size (US$ Mn) and Volume (MT) Analysis (2016-2020) & Forecast (2022-2032) By Distribution Channel

        18.2.1. Direct (B2B)

        18.2.2. Indirect (B2C)

            18.2.2.1. Hypermarket/Supermarket

            18.2.2.2. Convenience Stores

            18.2.2.3. Grocery Retailers

            18.2.2.4. Grocery Retailers

            18.2.2.5. Wholesale

            18.2.2.6. Other Store based Retailing

        18.2.3. Online Reatailing 

    18.3. Market Attractiveness Analysis By Distribution Channel

19. Global Market Analysis and Forecast, By Region

    19.1. Introduction

        19.1.1. Basis Point Share (BPS) Analysis By Region

        19.1.2. Y-o-Y Growth Projections By Region

    19.2. Market Size (US$ Mn) and Volume (MT) Analysis (2016-2020) & Forecast (2022-2032) Analysis By Region

        19.2.1. North America

        19.2.2. Latin America

        19.2.3. Europe

        19.2.4. East Asia

        19.2.5. South Asia

        19.2.6. Oceania

        19.2.7. Middle East and Africa

    19.3. Market Attractiveness Analysis By Region

20. North America Market Analysis and Forecast

    20.1. Introduction

        20.1.1. Basis Point Share (BPS) Analysis By Country

        20.1.2. Y-o-Y Growth Projections By Country

    20.2. Market Size (Value (US$) and Volume (MT) Analysis (2016-2020) and Forecast (2022-2032)

        20.2.1. Market Attractiveness By Country

            20.2.1.1. U.S.

            20.2.1.2. Canada

        20.2.2. By Base Ingredient

        20.2.3. By Flavour

        20.2.4. By Sugar Content

        20.2.5. By Format

        20.2.6. By Toppings

        20.2.7. By Distribution Channel

    20.3. Market Attractiveness Analysis

        20.3.1. By Country

        20.3.2. By Base Ingredient

        20.3.3. By Flavour

        20.3.4. By Sugar Content

        20.3.5. By Format

        20.3.6. By Toppings

        20.3.7. By Distribution Channel

    20.4. Drivers and Restraints: Impact Analysis

21. Latin America Market Analysis and Forecast

    21.1. Introduction

        21.1.1. Basis Point Share (BPS) Analysis By Country

        21.1.2. Y-o-Y Growth Projections By Country

        21.1.3. Key Regulations

    21.2. Market Size (Value (US$) and Volume (MT) Analysis (2016-2020) and Forecast (2022-2032)

        21.2.1. By Country

            21.2.1.1. Brazil

            21.2.1.2. Mexico

            21.2.1.3. Chile

            21.2.1.4. Peru

            21.2.1.5. Rest of LATAM

        21.2.2. By Base Ingredient

        21.2.3. By Flavour

        21.2.4. By Sugar Content

        21.2.5. By Format

        21.2.6. By Toppings

        21.2.7. By Distribution Channel

    21.3. Market Attractiveness Analysis

        21.3.1. By Country

        21.3.2. By Base Ingredient

        21.3.3. By Flavour

        21.3.4. By Sugar Content

        21.3.5. By Format

        21.3.6. By Toppings

        21.3.7. By Distribution Channel

    21.4. Drivers and Restraints: Impact Analysis

22. Europe Market Analysis and Forecast

    22.1. Introduction

        22.1.1. Basis Point Share (BPS) Analysis By Country

        22.1.2. Y-o-Y Growth Projections By Country

        22.1.3. Key Regulations

    22.2. Market Size (Value (US$) and Volume (MT) Analysis (2016-2020) and Forecast (2022-2032)

        22.2.1. By Country

            22.2.1.1. Germany

            22.2.1.2. Italy

            22.2.1.3. France

            22.2.1.4. Spain

            22.2.1.5. U.K.

            22.2.1.6. Netherlands

            22.2.1.7. Belgium

            22.2.1.8. Nordic

            22.2.1.9. Russia

            22.2.1.10. Poland

            22.2.1.11. Rest of Europe

        22.2.2. By Base Ingredient

        22.2.3. By Flavour

        22.2.4. By Sugar Content

        22.2.5. By Format

        22.2.6. By Toppings

        22.2.7. By Distribution Channel

    22.3. Market Attractiveness Analysis

        22.3.1. By Country

        22.3.2. By Base Ingredient

        22.3.3. By Flavour

        22.3.4. By Sugar Content

        22.3.5. By Format

        22.3.6. By Toppings

        22.3.7. By Distribution Channel

    22.4. Drivers and Restraints: Impact Analysis

23. East Asia Market Analysis and Forecast

    23.1. Introduction

        23.1.1. Basis Point Share (BPS) Analysis By Country

        23.1.2. Y-o-Y Growth Projections By Country

        23.1.3. Key Regulations

    23.2. Market Size (Value (US$) and Volume (MT) Analysis (2016-2020) and Forecast (2022-2032)

        23.2.1. By Country

            23.2.1.1. China

            23.2.1.2. Japan

            23.2.1.3. South Korea

        23.2.2. By Base Ingredient

        23.2.3. By Flavour

        23.2.4. By Sugar Content

        23.2.5. By Format

        23.2.6. By Toppings

        23.2.7. By Distribution Channel

    23.3. Market Attractiveness Analysis

        23.3.1. By Country

        23.3.2. By Base Ingredient

        23.3.3. By Flavour

        23.3.4. By Sugar Content

        23.3.5. By Format

        23.3.6. By Toppings

        23.3.7. By Distribution Channel

    23.4. Drivers and Restraints: Impact Analysis

24. South Asia Market Analysis and Forecast

    24.1. Introduction

        24.1.1. Basis Point Share (BPS) Analysis By Country

        24.1.2. Y-o-Y Growth Projections By Country

        24.1.3. Key Regulations

    24.2. Market Size (Value (US$) and Volume (MT) Analysis (2016-2020) and Forecast (2022-2032)

        24.2.1. By Country

            24.2.1.1. India

            24.2.1.2. Thailand

            24.2.1.3. Malaysia

            24.2.1.4. Singapore

            24.2.1.5. Rest of South Asia

        24.2.2. By Base Ingredient

        24.2.3. By Flavour

        24.2.4. By Sugar Content

        24.2.5. By Format

        24.2.6. By Toppings

        24.2.7. By Distribution Channel

    24.3. Market Attractiveness Analysis

        24.3.1. By Country

        24.3.2. By Base Ingredient

        24.3.3. By Flavour

        24.3.4. By Sugar Content

        24.3.5. By Format

        24.3.6. By Toppings

        24.3.7. By Distribution Channel

    24.4. Drivers and Restraints: Impact Analysis

25. Oceania Market Analysis and Forecast

    25.1. Introduction

        25.1.1. Basis Point Share (BPS) Analysis By Country

        25.1.2. Y-o-Y Growth Projections By Country

        25.1.3. Key Regulations

    25.2. Market Size (Value (US$) and Volume (MT) Analysis (2016-2020) and Forecast (2022-2032)

        25.2.1. By Country

            25.2.1.1. Australia

            25.2.1.2. New Zealand

        25.2.2. By Base Ingredient

        25.2.3. By Flavour

        25.2.4. By Sugar Content

        25.2.5. By Format

        25.2.6. By Toppings

        25.2.7. By Distribution Channel

    25.3. Market Attractiveness Analysis

        25.3.1. By Country

        25.3.2. By Base Ingredient

        25.3.3. By Flavour

        25.3.4. By Sugar Content

        25.3.5. By Format

        25.3.6. By Toppings

        25.3.7. By Distribution Channel

    25.4. Drivers and Restraints: Impact Analysis

26. Middle East and Africa (MEA) Market Analysis and Forecast

    26.1. Introduction

        26.1.1. Basis Point Share (BPS) Analysis By Country

        26.1.2. Y-o-Y Growth Projections By Country

        26.1.3. Key Regulations

    26.2. Market Size (Value (US$) and Volume (MT) Analysis (2016-2020) and Forecast (2022-2032)

        26.2.1. By Country

            26.2.1.1. GCC Countries

            26.2.1.2. South Africa

            26.2.1.3. North Africa

            26.2.1.4. Central Africa

            26.2.1.5. Turkey

            26.2.1.6. Rest of MEA

        26.2.2. By Base Ingredient

        26.2.3. By Flavour

        26.2.4. By Sugar Content

        26.2.5. By Format

        26.2.6. By Toppings

        26.2.7. By Distribution Channel

    26.3. Market Attractiveness Analysis

        26.3.1. By Country

        26.3.2. By Base Ingredient

        26.3.3. By Flavour

        26.3.4. By Sugar Content

        26.3.5. By Format

        26.3.6. By Toppings

        26.3.7. By Distribution Channel

    26.4. Drivers and Restraints: Impact Analysis

27. Competition Assessment

    27.1. Global Market Competition - a Dashboard View

    27.2. Global Market Structure Analysis

    27.3. Global Market Company Share Analysis

        27.3.1. For Tier 1 Market Players, 2020

        27.3.2. Company Market Share Analysis of Top 10 Players, By Region

    27.4. Key Participants Market Presence (Intensity Mapping) by Region

28. Competition Deep-dive (Manufacturers)

    28.1. Gong Cha

        28.1.1. Company Overview

        28.1.2. Product Portfolio

        28.1.3. Sales Footprint

        28.1.4. Strategy Overview

            28.1.4.1. Marketing Strategy

            28.1.4.2. Channel Strategy

            28.1.4.3. Regional Strategy

        28.1.5. SWOT Analysis

        28.1.6. Company Overview

        28.1.7. Product Portfolio

        28.1.8. Sales Footprint

        28.1.9. Strategy Overview

            28.1.9.1. Marketing Strategy

            28.1.9.2. Channel Strategy

            28.1.9.3. Regional Strategy

        28.1.10. Financial Analysis

        28.1.11. Company Overview

        28.1.12. Product Portfolio

        28.1.13. Sales Footprint

        28.1.14. Strategy Overview

            28.1.14.1. Marketing Strategy

            28.1.14.2. Channel Strategy

            28.1.14.3. Regional Strategy

        28.1.15. Revenue Share

        28.1.16. Company Overview

        28.1.17. Product Portfolio

        28.1.18. Sales Footprint

        28.1.19. Strategy Overview

            28.1.19.1. Marketing Strategy

            28.1.19.2. Channel Strategy

            28.1.19.3. Regional Strategy

        28.1.20. Analyst Comments

        28.1.21. Company Overview

        28.1.22. Product Portfolio

        28.1.23. Sales Footprint

        28.1.24. Strategy Overview

            28.1.24.1. Marketing Strategy

            28.1.24.2. Channel Strategy

            28.1.24.3. Regional Strategy

    28.2. Kung Fu Tea

        28.2.1. Company Overview

        28.2.2. Product Portfolio

        28.2.3. Sales Footprint

        28.2.4. Strategy Overview

            28.2.4.1. Marketing Strategy

            28.2.4.2. Channel Strategy

            28.2.4.3. Regional Strategy

    28.3. Lollicup USA

        28.3.1. Company Overview

        28.3.2. Product Portfolio

        28.3.3. Sales Footprint

        28.3.4. Strategy Overview

            28.3.4.1. Marketing Strategy

            28.3.4.2. Channel Strategy

            28.3.4.3. Regional Strategy

    28.4. Tiger Sugar

        28.4.1. Company Overview

        28.4.2. Product Portfolio

        28.4.3. Sales Footprint

        28.4.4. Strategy Overview

            28.4.4.1. Marketing Strategy

            28.4.4.2. Channel Strategy

            28.4.4.3. Regional Strategy

    28.5. Sharetea

        28.5.1. Company Overview

        28.5.2. Product Portfolio

        28.5.3. Sales Footprint

        28.5.4. Strategy Overview

            28.5.4.1. Marketing Strategy

            28.5.4.2. Channel Strategy

            28.5.4.3. Regional Strategy

    28.6. Boba Guys

        28.6.1. Company Overview

        28.6.2. Product Portfolio

        28.6.3. Sales Footprint

        28.6.4. Strategy Overview

            28.6.4.1. Marketing Strategy

            28.6.4.2. Channel Strategy

            28.6.4.3. Regional Strategy

    28.7. Tapioca Express

        28.7.1. Company Overview

        28.7.2. Product Portfolio

        28.7.3. Sales Footprint

        28.7.4. Strategy Overview

            28.7.4.1. Marketing Strategy

            28.7.4.2. Channel Strategy

            28.7.4.3. Regional Strategy

    28.8. Cha Time

        28.8.1. Company Overview

        28.8.2. Product Portfolio

        28.8.3. Sales Footprint

        28.8.4. Strategy Overview

            28.8.4.1. Marketing Strategy

            28.8.4.2. Channel Strategy

            28.8.4.3. Regional Strategy

    28.9. Ten Ren’s Tea Time

        28.9.1. Company Overview

        28.9.2. Product Portfolio

        28.9.3. Sales Footprint

        28.9.4. Strategy Overview

            28.9.4.1. Marketing Strategy

            28.9.4.2. Channel Strategy

            28.9.4.3. Regional Strategy

    28.10. YiFang Bubble Tea

        28.10.1. Company Overview

        28.10.2. Product Portfolio

        28.10.3. Sales Footprint

        28.10.4. Strategy Overview

            28.10.4.1. Marketing Strategy

            28.10.4.2. Channel Strategy

            28.10.4.3. Regional Strategy

    28.11. CoCo Fresh Tea & Juice

        28.11.1. Company Overview

        28.11.2. Product Portfolio

        28.11.3. Sales Footprint

        28.11.4. Strategy Overview

            28.11.4.1. Marketing Strategy

            28.11.4.2. Channel Strategy

            28.11.4.3. Regional Strategy

    28.12. DaBoba

        28.12.1. Company Overview

        28.12.2. Product Portfolio

        28.12.3. Sales Footprint

        28.12.4. Strategy Overview

            28.12.4.1. Marketing Strategy

            28.12.4.2. Channel Strategy

            28.12.4.3. Regional Strategy

    28.13. Happy Lemon

        28.13.1. Company Overview

        28.13.2. Product Portfolio

        28.13.3. Sales Footprint

        28.13.4. Strategy Overview

            28.13.4.1. Marketing Strategy

            28.13.4.2. Channel Strategy

            28.13.4.3. Regional Strategy

    28.14. Quickly

        28.14.1. Company Overview

        28.14.2. Product Portfolio

        28.14.3. Sales Footprint

        28.14.4. Strategy Overview

            28.14.4.1. Marketing Strategy

            28.14.4.2. Channel Strategy

            28.14.4.3. Regional Strategy

    28.15. Cojiitii

        28.15.1. Company Overview

        28.15.2. Product Portfolio

        28.15.3. Sales Footprint

        28.15.4. Strategy Overview

            28.15.4.1. Marketing Strategy

            28.15.4.2. Channel Strategy

            28.15.4.3. Regional Strategy

    28.16. Others

        28.16.1. Company Overview

        28.16.2. Product Portfolio

        28.16.3. Sales Footprint

        28.16.4. Strategy Overview

            28.16.4.1. Marketing Strategy

            28.16.4.2. Channel Strategy

            28.16.4.3. Regional Strategy

29. Recommendation - Critical Success Factors

30. Research Methodology

31. Assumptions & Acronyms Used
Customize this Report

Let us know your requirement to get
100% FREE customization

List of Tables

Table 1: Global Market Value (US$ Mn) and Forecast by Region, 2016–2020

Table 2: Global Market Value (US$ Mn) and Forecast by Region,2022–2032

Table 3: Global Market Volume (Metric Tons) and Forecast by Region, 2016–2020

Table 4: Global Market Volume (Metric Tons) and Forecast by Region,2022–2032

Table 5: Global Market Value (US$ Mn) and Forecast by Base Ingredient, 2016–2020

Table 6: Global Market Value (US$ Mn) and Forecast by Base Ingredient ,2022–2032

Table 7: Global Market Volume (Metric Tons) and Forecast by Base Ingredient, 2016–2020

Table 8: Global Market Volume (Metric Tons) and Forecast by Base Ingredient ,2022–2032

Table 9: Global Market Value (US$ Mn) and Forecast by Flavour, 2016–2020

Table 10: Global Market Value (US$ Mn) and Forecast by Flavour,2022–2032

Table 11: Global Market Volume (Metric Tons) and Forecast by Flavour, 2016–2020

Table 12: Global Market Volume (Metric Tons) and Forecast by Flavour,2022–2032

Table 13: Global Market Value (US$ Mn) and Forecast by Sugar Content, 2016–2020

Table 14: Global Market Value (US$ Mn) and Forecast by Sugar Content,2022–2032

Table 15: Global Market Volume (Metric Tons) and Forecast by Sugar Content, 2016–2020

Table 16: Global Market Volume (Metric Tons) and Forecast by Sugar Content,2022–2032

Table 17: Global Market Value (US$ Mn) and Forecast by Format, 2016–2020

Table 18: Global Market Value (US$ Mn) and Forecast by Format,2022–2032

Table 19: Global Market Volume (Metric Tons) and Forecast by Format, 2016–2020

Table 20: Global Market Volume (Metric Tons) and Forecast by Format,2022–2032

Table 21: Global Market Value (US$ Mn) and Forecast by Toppings, 2016–2020

Table 22: Global Market Value (US$ Mn) and Forecast by Toppings,2022–2032

Table 23: Global Market Volume (Metric Tons) and Forecast by Toppings, 2016–2020

Table 24: Global Market Volume (Metric Tons) and Forecast by Toppings,2022–2032

Table 25: Global Market Value (US$ Mn) and Forecast by Distribution Channel, 2016–2020

Table 26: Global Market Value (US$ Mn) and Forecast by Distribution Channel ,2022–2032

Table 27: Global Market Volume (Metric Tons) and Forecast by Distribution Channel, 2016–2020

Table 28: Global Market Volume (Metric Tons) and Forecast by Distribution Channel ,2022–2032

Table 29: North America Market Value (US$ Mn) and Forecast by Country, 2016–2020

Table 30: North America Market Value (US$ Mn) and Forecast by Country ,2022–2032

Table 31: North America Market Volume (Metric Tons) and Forecast by Country, 2016–2020

Table 32: North America Market Volume (Metric Tons) and Forecast by Country ,2022–2032

Table 33: North America Market Value (US$ Mn) and Forecast by Base Ingredient, 2016–2020

Table 34: North America Market Value (US$ Mn) and Forecast by Base Ingredient ,2022–2032

Table 35: North America Market Volume (Metric Tons) and Forecast by Base Ingredient, 2016–2020

Table 36: North America Market Volume (Metric Tons) and Forecast by Base Ingredient ,2022–2032

Table 37: North America Market Value (US$ Mn) and Forecast by Flavour, 2016–2020

Table 38: North America Market Value (US$ Mn) and Forecast by Flavour,2022–2032

Table 39: North America Market Volume (Metric Tons) and Forecast by Flavour, 2016–2020

Table 40: North America Market Volume (Metric Tons) and Forecast by Flavour,2022–2032

Table 41: North America Market Value (US$ Mn) and Forecast by Sugar Content, 2016–2020

Table 42: North America Market Value (US$ Mn) and Forecast by Sugar Content,2022–2032

Table 43: North America Market Volume (Metric Tons) and Forecast by Sugar Content, 2016–2020

Table 44: North America Market Volume (Metric Tons) and Forecast by Sugar Content,2022–2032

Table 45: North America Market Value (US$ Mn) and Forecast by Format, 2016–2020

Table 46: North America Market Value (US$ Mn) and Forecast by Format,2022–2032

Table 47: North America Market Volume (Metric Tons) and Forecast by Format, 2016–2020

Table 48: North America Market Volume (Metric Tons) and Forecast by Format,2022–2032

Table 49: North America Market Value (US$ Mn) and Forecast by Toppings, 2016–2020

Table 50: North America Market Value (US$ Mn) and Forecast by Toppings,2022–2032

Table 51: North America Market Volume (Metric Tons) and Forecast by Toppings, 2016–2020

Table 52: North America Market Volume (Metric Tons) and Forecast by Toppings,2022–2032

Table 53: North America Market Value (US$ Mn) and Forecast by Distribution Channel, 2016–2020

Table 54: North America Market Value (US$ Mn) and Forecast by Distribution Channel ,2022–2032

Table 55: North America Market Volume (Metric Tons) and Forecast by Distribution Channel, 2016–2020

Table 56: North America Market Volume (Metric Tons) and Forecast by Distribution Channel ,2022–2032

Table 57: Latin America Market Value (US$ Mn) and Forecast by Country, 2016–2020

Table 58: Latin America Market Value (US$ Mn) and Forecast by Country ,2022–2032

Table 59: Latin America Market Volume (Metric Tons) and Forecast by Country, 2016–2020

Table 60: Latin America Market Volume (Metric Tons) and Forecast by Country ,2022–2032

Table 61: Latin America Market Value (US$ Mn) and Forecast by Base Ingredient, 2016–2020

Table 62: Latin America Market Value (US$ Mn) and Forecast by Base Ingredient ,2022–2032

Table 63: Latin America Market Volume (Metric Tons) and Forecast by Base Ingredient, 2016–2020

Table 64: Latin America Market Volume (Metric Tons) and Forecast by Base Ingredient ,2022–2032

Table 65: Latin America Market Value (US$ Mn) and Forecast by Flavour, 2016–2020

Table 66: Latin America Market Value (US$ Mn) and Forecast by Flavour,2022–2032

Table 67: Latin America Market Volume (Metric Tons) and Forecast by Flavour, 2016–2020

Table 68: Latin America Market Volume (Metric Tons) and Forecast by Flavour,2022–2032

Table 69: Latin America Market Value (US$ Mn) and Forecast by Sugar Content, 2016–2020

Table 70: Latin America Market Value (US$ Mn) and Forecast by Sugar Content,2022–2032

Table 71: Latin America Market Volume (Metric Tons) and Forecast by Sugar Content, 2016–2020

Table 72: Latin America Market Volume (Metric Tons) and Forecast by Sugar Content,2022–2032

Table 73: Latin America Market Value (US$ Mn) and Forecast by Format, 2016–2020

Table 74: Latin America Market Value (US$ Mn) and Forecast by Format,2022–2032

Table 75: Latin America Market Volume (Metric Tons) and Forecast by Format, 2016–2020

Table 76: Latin America Market Volume (Metric Tons) and Forecast by Format,2022–2032

Table 77: Latin America Market Value (US$ Mn) and Forecast by Toppings, 2016–2020

Table 78: Latin America Market Value (US$ Mn) and Forecast by Toppings,2022–2032

Table 79: Latin America Market Volume (Metric Tons) and Forecast by Toppings, 2016–2020

Table 80: Latin America Market Volume (Metric Tons) and Forecast by Toppings,2022–2032

Table 81: Latin America Market Value (US$ Mn) and Forecast by Distribution Channel, 2016–2020

Table 82: Latin America Market Value (US$ Mn) and Forecast by Distribution Channel ,2022–2032

Table 83: Latin America Market Volume (Metric Tons) and Forecast by Distribution Channel, 2016–2020

Table 84: Latin America Market Volume (Metric Tons) and Forecast by Distribution Channel ,2022–2032

Table 85: Europe Market Value (US$ Mn) and Forecast by Country, 2016–2020

Table 86: Europe Market Value (US$ Mn) and Forecast by Country ,2022–2032

Table 87: Europe Market Volume (Metric Tons) and Forecast by Country, 2016–2020

Table 88: Europe Market Volume (Metric Tons) and Forecast by Country ,2022–2032

Table 89: Europe Market Value (US$ Mn) and Forecast by Base Ingredient, 2016–2020

Table 90: Europe Market Value (US$ Mn) and Forecast by Base Ingredient ,2022–2032

Table 91: Europe Market Volume (Metric Tons) and Forecast by Base Ingredient, 2016–2020

Table 92: Europe Market Volume (Metric Tons) and Forecast by Base Ingredient ,2022–2032

Table 93: Europe Market Value (US$ Mn) and Forecast by Flavour, 2016–2020

Table 94: Europe Market Value (US$ Mn) and Forecast by Flavour,2022–2032

Table 95: Europe Market Volume (Metric Tons) and Forecast by Flavour, 2016–2020

Table 96: Europe Market Volume (Metric Tons) and Forecast by Flavour,2022–2032

Table 97: Europe Market Value (US$ Mn) and Forecast by Sugar Content, 2016–2020

Table 98: Europe Market Value (US$ Mn) and Forecast by Sugar Content,2022–2032

Table 99: Europe Market Volume (Metric Tons) and Forecast by Sugar Content, 2016–2020

Table 100: Europe Market Volume (Metric Tons) and Forecast by Sugar Content,2022–2032

Table 101: Europe Market Value (US$ Mn) and Forecast by Format, 2016–2020

Table 102: Europe Market Value (US$ Mn) and Forecast by Format,2022–2032

Table 103: Europe Market Volume (Metric Tons) and Forecast by Format, 2016–2020

Table 104: Europe Market Volume (Metric Tons) and Forecast by Format,2022–2032

Table 105: Europe Market Value (US$ Mn) and Forecast by Toppings, 2016–2020

Table 106: Europe Market Value (US$ Mn) and Forecast by Toppings,2022–2032

Table 107: Europe Market Volume (Metric Tons) and Forecast by Toppings, 2016–2020

Table 108: Europe Market Volume (Metric Tons) and Forecast by Toppings,2022–2032

Table 109: Europe Market Value (US$ Mn) and Forecast by Distribution Channel, 2016–2020

Table 110: Europe Market Value (US$ Mn) and Forecast by Distribution Channel ,2022–2032

Table 111: Europe Market Volume (Metric Tons) and Forecast by Distribution Channel, 2016–2020

Table 112: Europe Market Volume (Metric Tons) and Forecast by Distribution Channel ,2022–2032

Table 113: East Asia Market Value (US$ Mn) and Forecast by Country, 2016–2020

Table 114: East Asia Market Value (US$ Mn) and Forecast by Country ,2022–2032

Table 115: East Asia Market Volume (Metric Tons) and Forecast by Country, 2016–2020

Table 116: East Asia Market Volume (Metric Tons) and Forecast by Country ,2022–2032

Table 117: East Asia Market Value (US$ Mn) and Forecast by Base Ingredient, 2016–2020

Table 118: East Asia Market Value (US$ Mn) and Forecast by Base Ingredient ,2022–2032

Table 119: East Asia Market Volume (Metric Tons) and Forecast by Base Ingredient, 2016–2020

Table 120: East Asia Market Volume (Metric Tons) and Forecast by Base Ingredient ,2022–2032

Table 121: East Asia Market Value (US$ Mn) and Forecast by Flavour, 2016–2020

Table 122: East Asia Market Value (US$ Mn) and Forecast by Flavour,2022–2032

Table 123: East Asia Market Volume (Metric Tons) and Forecast by Flavour, 2016–2020

Table 124: East Asia Market Volume (Metric Tons) and Forecast by Flavour,2022–2032

Table 125: East Asia Market Value (US$ Mn) and Forecast by Sugar Content, 2016–2020

Table 126: East Asia Market Value (US$ Mn) and Forecast by Sugar Content,2022–2032

Table 127: East Asia Market Volume (Metric Tons) and Forecast by Sugar Content, 2016–2020

Table 128: East Asia Market Volume (Metric Tons) and Forecast by Sugar Content,2022–2032

Table 129: East Asia Market Value (US$ Mn) and Forecast by Format, 2016–2020

Table 130: East Asia Market Value (US$ Mn) and Forecast by Format,2022–2032

Table 131: East Asia Market Volume (Metric Tons) and Forecast by Format, 2016–2020

Table 132: East Asia Market Volume (Metric Tons) and Forecast by Format,2022–2032

Table 133: East Asia Market Value (US$ Mn) and Forecast by Toppings, 2016–2020

Table 134: East Asia Market Value (US$ Mn) and Forecast by Toppings,2022–2032

Table 135: East Asia Market Volume (Metric Tons) and Forecast by Toppings, 2016–2020

Table 136: East Asia Market Volume (Metric Tons) and Forecast by Toppings,2022–2032

Table 137: East Asia Market Value (US$ Mn) and Forecast by Distribution Channel, 2016–2020

Table 138: East Asia Market Value (US$ Mn) and Forecast by Distribution Channel ,2022–2032

Table 139: East Asia Market Volume (Metric Tons) and Forecast by Distribution Channel, 2016–2020

Table 140: East Asia Market Volume (Metric Tons) and Forecast by Distribution Channel ,2022–2032

Table 141: South Asia Market Value (US$ Mn) and Forecast by Country, 2016–2020

Table 142: South Asia Market Value (US$ Mn) and Forecast by Country ,2022–2032

Table 143: South Asia Market Volume (Metric Tons) and Forecast by Country, 2016–2020

Table 144: South Asia Market Volume (Metric Tons) and Forecast by Country ,2022–2032

Table 145: South Asia Market Value (US$ Mn) and Forecast by Base Ingredient, 2016–2020

Table 146: South Asia Market Value (US$ Mn) and Forecast by Base Ingredient ,2022–2032

Table 147: South Asia Market Volume (Metric Tons) and Forecast by Base Ingredient, 2016–2020

Table 148: South Asia Market Volume (Metric Tons) and Forecast by Base Ingredient ,2022–2032

Table 149: South Asia Market Value (US$ Mn) and Forecast by Flavour, 2016–2020

Table 150: South Asia Market Value (US$ Mn) and Forecast by Flavour,2022–2032

Table 151: South Asia Market Volume (Metric Tons) and Forecast by Flavour, 2016–2020

Table 152: South Asia Market Volume (Metric Tons) and Forecast by Flavour,2022–2032

Table 153: South Asia Market Value (US$ Mn) and Forecast by Sugar Content, 2016–2020

Table 154: South Asia Market Value (US$ Mn) and Forecast by Sugar Content,2022–2032

Table 155: South Asia Market Volume (Metric Tons) and Forecast by Sugar Content, 2016–2020

Table 156: South Asia Market Volume (Metric Tons) and Forecast by Sugar Content,2022–2032

Table 157: South Asia Market Value (US$ Mn) and Forecast by Format, 2016–2020

Table 158: South Asia Market Value (US$ Mn) and Forecast by Format,2022–2032

Table 159: South Asia Market Volume (Metric Tons) and Forecast by Format, 2016–2020

Table 160: South Asia Market Volume (Metric Tons) and Forecast by Format,2022–2032

Table 161: South Asia Market Value (US$ Mn) and Forecast by Toppings, 2016–2020

Table 162: South Asia Market Value (US$ Mn) and Forecast by Toppings,2022–2032

Table 163: South Asia Market Volume (Metric Tons) and Forecast by Toppings, 2016–2020

Table 164: South Asia Market Volume (Metric Tons) and Forecast by Toppings,2022–2032

Table 165: South Asia Market Value (US$ Mn) and Forecast by Distribution Channel, 2016–2020

Table 166: South Asia Market Value (US$ Mn) and Forecast by Distribution Channel ,2022–2032

Table 167: South Asia Market Volume (Metric Tons) and Forecast by Distribution Channel, 2016–2020

Table 168: South Asia Market Volume (Metric Tons) and Forecast by Distribution Channel ,2022–2032

Table 169: Oceania Market Value (US$ Mn) and Forecast by Country, 2016–2020

Table 170: Oceania Market Value (US$ Mn) and Forecast by Country ,2022–2032

Table 171: Oceania Market Volume (Metric Tons) and Forecast by Country, 2016–2020

Table 172: Oceania Market Volume (Metric Tons) and Forecast by Country ,2022–2032

Table 173: Oceania Market Value (US$ Mn) and Forecast by Base Ingredient, 2016–2020

Table 174: Oceania Market Value (US$ Mn) and Forecast by Base Ingredient ,2022–2032

Table 175: Oceania Market Volume (Metric Tons) and Forecast by Base Ingredient, 2016–2020

Table 176: Oceania Market Volume (Metric Tons) and Forecast by Base Ingredient ,2022–2032

Table 177: Oceania Market Value (US$ Mn) and Forecast by Flavour, 2016–2020

Table 178: Oceania Market Value (US$ Mn) and Forecast by Flavour,2022–2032

Table 179: Oceania Market Volume (Metric Tons) and Forecast by Flavour, 2016–2020

Table 180: Oceania Market Volume (Metric Tons) and Forecast by Flavour,2022–2032

Table 181: Oceania Market Value (US$ Mn) and Forecast by Sugar Content, 2016–2020

Table 182: Oceania Market Value (US$ Mn) and Forecast by Sugar Content,2022–2032

Table 183: Oceania Market Volume (Metric Tons) and Forecast by Sugar Content, 2016–2020

Table 184: Oceania Market Volume (Metric Tons) and Forecast by Sugar Content,2022–2032

Table 185: Oceania Market Value (US$ Mn) and Forecast by Format, 2016–2020

Table 186: Oceania Market Value (US$ Mn) and Forecast by Format,2022–2032

Table 187: Oceania Market Volume (Metric Tons) and Forecast by Format, 2016–2020

Table 188: Oceania Market Volume (Metric Tons) and Forecast by Format,2022–2032

Table 189: Oceania Market Value (US$ Mn) and Forecast by Toppings, 2016–2020

Table 190: Oceania Market Value (US$ Mn) and Forecast by Toppings,2022–2032

Table 191: Oceania Market Volume (Metric Tons) and Forecast by Toppings, 2016–2020

Table 192: Oceania Market Volume (Metric Tons) and Forecast by Toppings,2022–2032

Table 193: Oceania Market Value (US$ Mn) and Forecast by Distribution Channel, 2016–2020

Table 194: Oceania Market Value (US$ Mn) and Forecast by Distribution Channel ,2022–2032

Table 195: Oceania Market Volume (Metric Tons) and Forecast by Distribution Channel, 2016–2020

Table 196: Oceania Market Volume (Metric Tons) and Forecast by Distribution Channel ,2022–2032

Table 197: MEA Market Value (US$ Mn) and Forecast by Country, 2016–2020

Table 198: MEA Market Value (US$ Mn) and Forecast by Country ,2022–2032

Table 199: MEA Market Volume (Metric Tons) and Forecast by Country, 2016–2020

Table 200: MEA Market Volume (Metric Tons) and Forecast by Country ,2022–2032

Table 201: MEA Market Value (US$ Mn) and Forecast by Base Ingredient, 2016–2020

Table 202: MEA Market Value (US$ Mn) and Forecast by Base Ingredient ,2022–2032

Table 203: MEA Market Volume (Metric Tons) and Forecast by Base Ingredient, 2016–2020

Table 204: MEA Market Volume (Metric Tons) and Forecast by Base Ingredient ,2022–2032

Table 205: MEA Market Value (US$ Mn) and Forecast by Flavour, 2016–2020

Table 206: MEA Market Value (US$ Mn) and Forecast by Flavour,2022–2032

Table 207: MEA Market Volume (Metric Tons) and Forecast by Flavour, 2016–2020

Table 208: MEA Market Volume (Metric Tons) and Forecast by Flavour,2022–2032

Table 209: MEA Market Value (US$ Mn) and Forecast by Sugar Content, 2016–2020

Table 210: MEA Market Value (US$ Mn) and Forecast by Sugar Content,2022–2032

Table 211: MEA Market Volume (Metric Tons) and Forecast by Sugar Content, 2016–2020

Table 212: MEA Market Volume (Metric Tons) and Forecast by Sugar Content,2022–2032

Table 213: MEA Market Value (US$ Mn) and Forecast by Format, 2016–2020

Table 214: MEA Market Value (US$ Mn) and Forecast by Format,2022–2032

Table 215: MEA Market Volume (Metric Tons) and Forecast by Format, 2016–2020

Table 216: MEA Market Volume (Metric Tons) and Forecast by Format,2022–2032

Table 217: MEA Market Value (US$ Mn) and Forecast by Toppings, 2016–2020

Table 218: MEA Market Value (US$ Mn) and Forecast by Toppings,2022–2032

Table 219: MEA Market Volume (Metric Tons) and Forecast by Toppings, 2016–2020

Table 220: MEA Market Volume (Metric Tons) and Forecast by Toppings,2022–2032

Table 221: MEA Market Value (US$ Mn) and Forecast by Distribution Channel, 2016–2020

Table 222: MEA Market Value (US$ Mn) and Forecast by Distribution Channel ,2022–2032

Table 223: MEA Market Volume (Metric Tons) and Forecast by Distribution Channel, 2016–2020

Table 224: MEA Market Volume (Metric Tons) and Forecast by Distribution Channel ,2022–2032
Nandini Roy Choudhury
Principal Consultant
LinkedIn
Talk to Analyst

Find your sweet spots for generating winning opportunities in this market.

Talk to Analyst

List of Charts

Figure 01: Global Market Size and Incremental $ Opportunity (US$ Mn), 2016-2032

Figure 02: Global Market Share and BPS Analysis by Base Ingredient , 2022 & 2032

Figure 03: Global Market Attractiveness Analysis by Base Ingredient , 2022-2032

Figure 04: Global Market Analysis by Black Tea Base Ingredient Value (US$ Mn), Volume (MT) and Forecast, 2016-2032

Figure 05: Global Market Black Tea Base Ingredient Incremental $ Opportunity, 2020-2032

Figure 06: Global Market Analysis by Green Tea Base Ingredient Value (US$ Mn), Volume (MT) and Forecast, 2016-2032

Figure 07: Global Market Green Tea Base Ingredient Incremental $ Opportunity, 2020-2032

Figure 08: Global Market Analysis by Oolong Tea Base Ingredient Value (US$ Mn), Volume (MT) and Forecast, 2016-2032

Figure 09: Global Market Oolong Tea Base Ingredient Incremental $ Opportunity, 2020-2032

Figure 10: Global Market Analysis by White Tea Base Ingredient Value (US$ Mn), Volume (MT) and Forecast, 2016-2032

Figure 11: Global Market White Tea Base Ingredient Incremental $ Opportunity, 2020-2032

Figure 12: Global Market Analysis by Other Base Ingredients Value (US$ Mn), Volume (MT) and Forecast, 2016-2032

Figure 13: Global Market Other Base Ingredients Incremental $ Opportunity, 2020-2032

Figure 14: Global Market Share and BPS Analysis by Form, 2022 & 2032

Figure 15: Global Market Attractiveness Analysis by Form, 2022-2032

Figure 16: Global Market Analysis by Original Flavour Value (US$ Mn), Volume (MT) and Forecast, 2016-2032

Figure 17: Global Market Original Flavour Incremental $ Opportunity, 2020-2032

Figure 18: Global Market Analysis by Flavoured Flavour Value (US$ Mn), Volume (MT) and Forecast, 2016-2032

Figure 19: Global Market Flavoured Flavour Incremental $ Opportunity, 2020-2032

Figure 20: Global Market Share and BPS Analysis by Sugar Content , 2022 & 2032

Figure 21: Global Market Attractiveness Analysis by Sugar Content, 2022-2032

Figure 22: Global Market Analysis by Regular Sugar Content Value (US$ Mn), Volume (MT) and Forecast, 2016-2032

Figure 23: Global Market Regular Sugar Content Incremental $ Opportunity, 2020-2032

Figure 24: Global Market Analysis by Reduced Sugar/Sugar Free Sugar Content Value (US$ Mn), Volume (MT) and Forecast, 2016-2032

Figure 25: Global Market Reduced Sugar/Sugar Free Sugar ContentIncremental $ Opportunity, 2020-2032

Figure 26: Global Market Share and BPS Analysis by Format, 2022 & 2032

Figure 27: Global Market Attractiveness Analysis by Format, 2022-2032

Figure 28: Global Market Analysis by Ready-to-Drink (RTD) Format Value (US$ Mn), Volume (MT) and Forecast, 2016-2032

Figure 29: Global Market Ready-to-Drink (RTD) Format Incremental $ Opportunity, 2020-2032

Figure 30: Global Market Analysis Instant Mixes Format Value (US$ Mn), Volume (MT) and Forecast, 2016-2032

Figure 31: Global Market Instant Mixes Format Incremental $ Opportunity, 2020-2032

Figure 32: Global Market Share and BPS Analysis by Toppings , 2022 & 2032

Figure 33: Global Market Attractiveness Analysis by Toppings , 2022-2032

Figure 34: Global Market Analysis by Pearl Toppings Value (US$ Mn), Volume (MT) and Forecast, 2016-2032

Figure 35: Global Market Pearl Toppings Incremental $ Opportunity, 2020-2032

Figure 36: Global Market Analysis by Grass Jelly Toppings Value (US$ Mn), Volume (MT) and Forecast, 2016-2032

Figure 37: Global Market Grass Jelly Toppings Incremental $ Opportunity, 2020-2032

Figure 38: Global Market Analysis by Coconut Jelly Toppings Value (US$ Mn), Volume (MT) and Forecast, 2016-2032

Figure 39: Global Market Coconut Jelly Toppings Incremental $ Opportunity, 2020-2032

Figure 40: Global Market Analysis by Red Bean Toppings Value (US$ Mn), Volume (MT) and Forecast, 2016-2032

Figure 41: Global Market Red Bean Toppings Incremental $ Opportunity, 2020-2032

Figure 42: Global Market Analysis by Multiple/Others Toppings Value (US$ Mn), Volume (MT) and Forecast, 2016-2032

Figure 43: Global Market Multiple/Others Toppings Incremental $ Opportunity, 2020-2032

Figure 44: Global Market Share and BPS Analysis by Distribution Channel, 2022 & 2032

Figure 45: Global Market Attractiveness Analysis by Distribution Channel, 2022-2032

Figure 46: Global Market Analysis by Direct (B2B) Distribution Channel Value (US$ Mn), Volume (MT) and Forecast, 2016-2032

Figure 47: Global Market Direct (B2B) Distribution Channel Incremental $ Opportunity, 2020-2032

Figure 48: Global Market Analysis by Indirect (B2C) Distribution Channel Value (US$ Mn), Volume (MT) and Forecast, 2016-2032

Figure 49: Global Market Indirect (B2C) Distribution Channel Incremental $ Opportunity, 2020-2032

Figure 50: Global Market Analysis by Online Retailing Distribution Channel Value (US$ Mn), Volume (MT) and Forecast, 2016-2032

Figure 51: Global Market Online Retailing Distribution Channel Incremental $ Opportunity, 2020-2032

Figure 52: Global Market Value Share (%) and BPS Analysis by Region, 2016, 2022 & 2032

Figure 53: Global Market Y-o-Y Growth (%) Projections by Segment, 2022-2032

Figure 54: North America Absolute $ Opportunity Analysis, 2022-2032

Figure 55: Latin America Absolute $ Opportunity Analysis, 2022-2032

Figure 56: Europe Absolute $ Opportunity Analysis, 2022-2033

Figure 57: East Asia Absolute $ Opportunity Analysis, 2022-2034

Figure 58: South Asia Absolute $ Opportunity Analysis, 2022-2035

Figure 59: Oceania Absolute $ Opportunity Analysis, 2022-2036

Figure 61: MEA Absolute $ Opportunity Analysis, 2022-2037

Figure 62: North America Market Value (US$ Mn), Volume (MT) Forecast and Analysis, 2022-2032

Figure 63: North America Market Share and BPS Analysis by Country – 2022 & 2032

Figure 64: North America Market Attractiveness Analysis by Country, 2022-2032

Figure 65: U.S. Market Incremental $ Opportunity, 2022-2032

Figure 66: Canada Market Incremental $ Opportunity, 2022-2032

Figure 67: North America Market Share and BPS Analysis Base Ingredient, 2022 & 2032

Figure 68: North America Market Attractiveness Analysis by Base Ingredient, 2022-2032

Figure 69: North America Market Share and BPS Analysis by Flavour, 2022 & 2032

Figure 70: North America Market Attractiveness Analysis by Flavour, 2022-2032

Figure 71: North America Market Share and BPS Analysis by Sugar Content, 2022 & 2032

Figure 72: North America Market Attractiveness Analysis by Sugar Content, 2022-2032

Figure 73: North America Market Share and BPS Analysis by Format, 2022 & 2032

Figure 74: North America Market Attractiveness Analysis by Format, 2022-2032

Figure 75: North America Market Share and BPS Analysis by Toppings, 2022 & 2032

Figure 76: North America Market Attractiveness Analysis by Toppings, 2022-2032

Figure 77: North America Market Share and BPS Analysis by Distribution Channel, 2022 & 2032

Figure 78: North America Market Attractiveness Analysis by Distribution Channel, 2022-2032

Figure 79: US Market Value Share Analysis by Base Ingredient, 2022

Figure 80: US Market Value Share Analysis by Flavour, 2022

Figure 81: US Market Value Share Analysis by Sugar Content, 2022

Figure 82: US Market Value Share Analysis by Format, 2022

Figure 83: US Market Value Share Analysis by Toppings, 2022

Figure 84: US Market Value Share Analysis by Distribution Channel, 2022

Figure 85: Canada Market Value Share Analysis by Base Ingredient, 2022

Figure 86: Canada Market Value Share Analysis by Flavour, 2022

Figure 87: Canada Market Value Share Analysis by Sugar Content 2022

Figure 88: Canada Market Value Share Analysis by Format, 2022

Figure 89: Canada Market Value Share Analysis by Toppings, 2022

Figure 90: Canada Market Value Share Analysis by Distribution Channel, 2022

Figure 91: Latin America Market Value (US$ Mn), Volume (MT) Forecast and Analysis, 2022-2032

Figure 92: Latin America Market Share and BPS Analysis by Country – 2022 & 2032

Figure 93: Latin America Market Attractiveness Analysis by Country, 2022-2032

Figure 94: Brazil Market Incremental $ Opportunity, 2022-2032

Figure 95: Mexico Market Incremental $ Opportunity, 2022-2032

Figure 96: Argentina Market Incremental $ Opportunity, 2022-2032

Figure 97: Venezuela Market Incremental $ Opportunity, 2022-2032

Figure 98: Chile Market Incremental $ Opportunity, 2022-2032

Figure 99: Peru Market Incremental $ Opportunity, 2022-2032

Figure 100: Rest of Latin America Market Incremental $ Opportunity, 2022-2032

Figure 101: Latin America Market Share and BPS Analysis Base Ingredient, 2022 & 2032

Figure 102: Latin America Market Attractiveness Analysis by Base Ingredient, 2022-2032

Figure 103: Latin America Market Share and BPS Analysis by Flavour, 2022 & 2032

Figure 104: Latin America Market Attractiveness Analysis by Flavour, 2022-2032

Figure 105: Latin America Market Share and BPS Analysis by Sugar Content, 2022 & 2032

Figure 106: Latin America Market Attractiveness Analysis by Sugar Content, 2022-2032

Figure 107: Latin America Market Share and BPS Analysis by Format, 2022 & 2032

Figure 108: Latin America Market Attractiveness Analysis by Format, 2022-2032

Figure 109: Latin America Market Share and BPS Analysis by Toppings, 2022 & 2032

Figure 110: Latin America Market Attractiveness Analysis by Toppings, 2022-2032

Figure 111: Latin America Market Share and BPS Analysis by Distribution Channel, 2022 & 2032

Figure 112: Latin America Market Attractiveness Analysis by Distribution Channel, 2022-2032

Figure 113: Brazil Market Value Share Analysis by Base Ingredient, 2022

Figure 114: Brazil Market Value Share Analysis by Flavour, 2022

Figure 115: Brazil Market Value Share Analysis by Sugar Content, 2022

Figure 116: Brazil Market Value Share Analysis by Format, 2022

Figure 117: Brazil Market Value Share Analysis by Toppings, 2022

Figure 118: Brazil Market Value Share Analysis by Distribution Channel, 2022

Figure 119: Mexico Market Value Share Analysis by Base Ingredient, 2022

Figure 120: Mexico Market Value Share Analysis by Flavour, 2022

Figure 121: Mexico Market Value Share Analysis by Sugar Content, 2022

Figure 122: Mexico Market Value Share Analysis by Format, 2022

Figure 123: Mexico Market Value Share Analysis by Toppings, 2022

Figure 124: Mexico Market Value Share Analysis by Distribution Channel, 2022

Figure 125: Argentina Market Value Share Analysis by Base Ingredient, 2022

Figure 126: Argentina Market Value Share Analysis by Flavour, 2022

Figure 127: Argentina Market Value Share Analysis by Sugar Content, 2022

Figure 128: Argentina Market Value Share Analysis by Format, 2022

Figure 129: Argentina Market Value Share Analysis by Toppings, 2022

Figure 130: Argentina Market Value Share Analysis by Distribution Channel, 2022

Figure 131: Venezuela Market Value Share Analysis by Base Ingredient, 2022

Figure 132: Venezuela Market Value Share Analysis by Flavour, 2022

Figure 133: Venezuela Market Value Share Analysis by Sugar Content, 2022

Figure 134: Venezuela Market Value Share Analysis by Format, 2022

Figure 135: Venezuela Market Value Share Analysis by Toppings, 2022

Figure 136: Venezuela Market Value Share Analysis by Distribution Channel, 2022

Figure 137: Chile Market Value Share Analysis by Base Ingredient, 2022

Figure 138: Chile Market Value Share Analysis by Flavour, 2022

Figure 139: Chile Market Value Share Analysis by Sugar Content, 2022

Figure 140: Chile Market Value Share Analysis by Format, 2022

Figure 141: Chile Market Value Share Analysis by Toppings, 2022

Figure 142: Chile Market Value Share Analysis by Distribution Channel, 2022

Figure 143: Peru Market Value Share Analysis by Base Ingredient, 2022

Figure 144: Peru Market Value Share Analysis by Flavour, 2022

Figure 145: Peru Market Value Share Analysis by Sugar Content, 2022

Figure 146: Peru Market Value Share Analysis by Format, 2022

Figure 147: Peru Market Value Share Analysis by Toppings, 2022

Figure 148: Peru Market Value Share Analysis by Distribution Channel, 2022

Figure 149: Europe Market Value (US$ Mn), Volume (MT) Forecast and Analysis, 2022-2032

Figure 150: Europe Market Share and BPS Analysis by Country – 2022 & 2032

Figure 151: Europe Market Attractiveness Analysis by Country, 2022-2032

Figure 152: Germany Market Incremental $ Opportunity, 2022-2032

Figure 153: France Market Incremental $ Opportunity, 2022-2032

Figure 154: Italy Market Incremental $ Opportunity, 2022-2032

Figure 155: Spain Market Incremental $ Opportunity, 2022-2032

Figure 156: U.K Market Incremental $ Opportunity, 2022-2032

Figure 157: BENELUX Market Incremental $ Opportunity, 2022-2032

Figure 158: Nordic Market Incremental $ Opportunity, 2022-2032

Figure 159: Russia Market Incremental $ Opportunity, 2022-2032

Figure 160: Poland Market Incremental $ Opportunity, 2022-2032

Figure 161: Rest of Europe Market Incremental $ Opportunity, 2022-2032

Figure 162: Europe Market Share and BPS Analysis Base Ingredient, 2022 & 2032

Figure 163: Europe Market Attractiveness Analysis by Base Ingredient, 2022-2032

Figure 164: Europe Market Share and BPS Analysis by Flavour, 2022 & 2032

Figure 165: Europe Market Attractiveness Analysis by Flavour, 2022-2032

Figure 166: Europe Market Share and BPS Analysis by Sugar Content, 2022 & 2032

Figure 167: Europe Market Attractiveness Analysis by Sugar Content, 2022-2032

Figure 168: Europe Market Share and BPS Analysis by Format, 2022 & 2032

Figure 169: Europe Market Attractiveness Analysis by Format, 2022-2032

Figure 170: Europe Market Share and BPS Analysis by Toppings, 2022 & 2032

Figure 171: Europe Market Attractiveness Analysis by Toppings, 2022-2032

Figure 172: Europe Market Share and BPS Analysis by Distribution Channel, 2022 & 2032

Figure 173: Europe Market Attractiveness Analysis by Distribution Channel, 2022-2032

Figure 174: Germany Market Value Share Analysis by Base Ingredient, 2022

Figure 175: Germany Market Value Share Analysis by Flavour, 2022

Figure 176: Germany Market Value Share Analysis by Sugar Content, 2022

Figure 177: Germany Market Value Share Analysis by Format, 2022

Figure 178: Germany Market Value Share Analysis by Toppings, 2022

Figure 179: Germany Market Value Share Analysis by Distribution Channel, 2022

Figure 180: France Market Value Share Analysis by Base Ingredient, 2022

Figure 181: France Market Value Share Analysis by Flavour, 2022

Figure 182: France Market Value Share Analysis by Sugar Content, 2022

Figure 183: France Market Value Share Analysis by Format, 2022

Figure 184: France Market Value Share Analysis by Toppings, 2022

Figure 185: France Market Value Share Analysis by Distribution Channel, 2022

Figure 186: Italy Market Value Share Analysis by Base Ingredient, 2022

Figure 187: Italy Market Value Share Analysis by Flavour, 2022

Figure 188: Italy Market Value Share Analysis by Sugar Content, 2022

Figure 189: Italy Market Value Share Analysis by Format, 2022

Figure 190: Italy Market Value Share Analysis by Toppings, 2022

Figure 191: Italy Market Value Share Analysis by Distribution Channel, 2022

Figure 192: Spain Market Value Share Analysis by Base Ingredient, 2022

Figure 193: Spain Market Value Share Analysis by Flavour, 2022

Figure 194: Spain Market Value Share Analysis by Sugar Content, 2022

Figure 195: Spain Market Value Share Analysis by Format, 2022

Figure 196: Spain Market Value Share Analysis by Toppings, 2022

Figure 197: Spain Market Value Share Analysis by Distribution Channel, 2022

Figure 198: U.K Market Value Share Analysis by Base Ingredient, 2022

Figure 199: U.K Market Value Share Analysis by Flavour, 2022

Figure 200: U.K Market Value Share Analysis by Sugar Content, 2022

Figure 201: U.K Market Value Share Analysis by Format, 2022

Figure 202: U.K Market Value Share Analysis by Toppings, 2022

Figure 203: U.K Market Value Share Analysis by Distribution Channel, 2022

Figure 204: BENELUX Market Value Share Analysis by Base Ingredient, 2022

Figure 205: BENELUX Market Value Share Analysis by Flavour, 2022

Figure 206: BENELUX Market Value Share Analysis by Sugar Content, 2022

Figure 207: BENELUX Market Value Share Analysis by Format, 2022

Figure 208: BENELUX Market Value Share Analysis by Toppings, 2022

Figure 209: BENELUX Market Value Share Analysis by Distribution Channel, 2022

Figure 210: Nordic Market Value Share Analysis by Base Ingredient, 2022

Figure 211: Nordic Market Value Share Analysis by Flavour, 2022

Figure 212: Nordic Market Value Share Analysis by Sugar Content, 2022

Figure 213: Nordic Market Value Share Analysis by Format, 2022

Figure 214: Nordic Market Value Share Analysis by Toppings, 2022

Figure 215: Nordic Market Value Share Analysis by Distribution Channel, 2022

Figure 216: Russia Market Value Share Analysis by Base Ingredient, 2022

Figure 217: Russia Market Value Share Analysis by Flavour, 2022

Figure 218: Russia Market Value Share Analysis by Sugar Content, 2022

Figure 219: Russia Market Value Share Analysis by Format, 2022

Figure 220: Russia Market Value Share Analysis by Toppings, 2022

Figure 221: Russia Market Value Share Analysis by Distribution Channel, 2022

Figure 222: Poland Market Value Share Analysis by Base Ingredient, 2022

Figure 223: Poland Market Value Share Analysis by Flavour, 2022

Figure 224: Poland Market Value Share Analysis by Sugar Content, 2022

Figure 225: Poland Market Value Share Analysis by Format, 2022

Figure 226: Poland Market Value Share Analysis by Toppings, 2022

Figure 227: Poland Market Value Share Analysis by Distribution Channel, 2022

Figure 228: East Asia Market Value (US$ Mn), Volume (MT) Forecast and Analysis, 2022-2032

Figure 229: East Asia Market Share and BPS Analysis by Country – 2022 & 2032

Figure 230: East Asia Market Attractiveness Analysis by Country, 2022-2032

Figure 231: China Market Incremental $ Opportunity, 2022-2032

Figure 232: Japan Market Incremental $ Opportunity, 2022-2032

Figure 233: South Korea Market Incremental $ Opportunity, 2022-2032

Figure 234: East Asia Market Share and BPS Analysis Base Ingredient, 2022 & 2032

Figure 235: East Asia Market Attractiveness Analysis by Base Ingredient, 2022-2032

Figure 236: East Asia Market Share and BPS Analysis by Flavour, 2022 & 2032

Figure 237: East Asia Market Attractiveness Analysis by Flavour, 2022-2032

Figure 238: East Asia Market Share and BPS Analysis by Sugar Content, 2022 & 2032

Figure 239: East Asia Market Attractiveness Analysis by Sugar Content, 2022-2032

Figure 240: East Asia Market Share and BPS Analysis by Format, 2022 & 2032

Figure 241: East Asia Market Attractiveness Analysis by Format, 2022-2032

Figure 242: East Asia Market Share and BPS Analysis by Toppings, 2022 & 2032

Figure 243: East Asia Market Attractiveness Analysis by Toppings, 2022-2032

Figure 244: East Asia Market Share and BPS Analysis by Distribution Channel, 2022 & 2032

Figure 245: East Asia Market Attractiveness Analysis by Distribution Channel, 2022-2032

Figure 246: China Market Value Share Analysis by Base Ingredient, 2022

Figure 247: China Market Value Share Analysis by Flavour, 2022

Figure 248: China Market Value Share Analysis by Sugar Content, 2022

Figure 249: China Market Value Share Analysis by Format, 2022

Figure 250: China Market Value Share Analysis by Toppings, 2022

Figure 251: China Market Value Share Analysis by Distribution Channel, 2022

Figure 252: Japan Market Value Share Analysis by Base Ingredient, 2022

Figure 253: Japan Market Value Share Analysis by Flavour, 2022

Figure 254: Japan Market Value Share Analysis by Sugar Content, 2022

Figure 255: Japan Market Value Share Analysis by Format, 2022

Figure 256: Japan Market Value Share Analysis by Toppings, 2022

Figure 257: Japan Market Value Share Analysis by Distribution Channel, 2022

Figure 258: South Korea Market Value Share Analysis by Base Ingredient, 2022

Figure 259: South Korea Market Value Share Analysis by Flavour, 2022

Figure 260: South Korea Market Value Share Analysis by Sugar Content, 2022

Figure 261: South Korea Market Value Share Analysis by Format, 2022

Figure 262: South Korea Market Value Share Analysis by Toppings, 2022

Figure 263: South Korea Market Value Share Analysis by Distribution Channel, 2022

Figure 264: South Asia Market Value (US$ Mn), Volume (MT) Forecast and Analysis, 2022-2032

Figure 265: South Asia Market Share and BPS Analysis by Country – 2022 & 2032

Figure 266: South Asia Market Attractiveness Analysis by Country, 2022-2032

Figure 267: India Market Incremental $ Opportunity, 2022-2032

Figure 268: Thailand Market Incremental $ Opportunity, 2022-2032

Figure 269: Indonesia Market Incremental $ Opportunity, 2022-2032

Figure 270: Malaysia Market Incremental $ Opportunity, 2022-2032

Figure 271: Singapore Market Incremental $ Opportunity, 2022-2032

Figure 272: Rest of South Asia Market Incremental $ Opportunity, 2022-2032

Figure 273: South Asia Market Share and BPS Analysis Base Ingredient, 2022 & 2032

Figure 274: South Asia Market Attractiveness Analysis by Base Ingredient, 2022-2032

Figure 275: South Asia Market Share and BPS Analysis by Flavour, 2022 & 2032

Figure 276: South Asia Market Attractiveness Analysis by Flavour, 2022-2032

Figure 277: South Asia Market Share and BPS Analysis by Sugar Content, 2022 & 2032

Figure 278: South Asia Market Attractiveness Analysis by Sugar Content, 2022-2032

Figure 279: South Asia Market Share and BPS Analysis by Format, 2022 & 2032

Figure 280: South Asia Market Attractiveness Analysis by Format, 2022-2032

Figure 281: South Asia Market Share and BPS Analysis by Toppings, 2022 & 2032

Figure 282: South Asia Market Attractiveness Analysis by Toppings, 2022-2032

Figure 283: South Asia Market Share and BPS Analysis by Distribution Channel, 2022 & 2032

Figure 284: South Asia Market Attractiveness Analysis by Distribution Channel, 2022-2032

Figure 285: India Market Value Share Analysis by Base Ingredient, 2022

Figure 286: India Market Value Share Analysis by Flavour, 2022

Figure 287: India Market Value Share Analysis by Sugar Content, 2022

Figure 288: India Market Value Share Analysis by Format, 2022

Figure 289: India Market Value Share Analysis by Toppings, 2022

Figure 290: India Market Value Share Analysis by Distribution Channel, 2022

Figure 291: Thailand Market Value Share Analysis by Base Ingredient, 2022

Figure 292: Thailand Market Value Share Analysis by Flavour, 2022

Figure 293: Thailand Market Value Share Analysis by Sugar Content, 2022

Figure 294: Thailand Market Value Share Analysis by Format, 2022

Figure 295: Thailand Market Value Share Analysis by Toppings, 2022

Figure 296: Thailand Market Value Share Analysis by Distribution Channel, 2022

Figure 297: Indonesia Market Value Share Analysis by Base Ingredient, 2022

Figure 298: Indonesia Market Value Share Analysis by Flavour, 2022

Figure 299: Indonesia Market Value Share Analysis by Sugar Content, 2022

Figure 300: Indonesia Market Value Share Analysis by Format, 2022

Figure 301: Indonesia Market Value Share Analysis by Toppings, 2022

Figure 302: Indonesia Market Value Share Analysis by Distribution Channel, 2022

Figure 303: Malaysia Market Value Share Analysis by Base Ingredient, 2022

Figure 304: Malaysia Market Value Share Analysis by Flavour, 2022

Figure 305: Malaysia Market Value Share Analysis by Sugar Content, 2022

Figure 306: Malaysia Market Value Share Analysis by Format, 2022

Figure 307: Malaysia Market Value Share Analysis by Toppings, 2022

Figure 308: Malaysia Market Value Share Analysis by Distribution Channel, 2022

Figure 309: Singapore Market Value Share Analysis by Base Ingredient, 2022

Figure 310: Singapore Market Value Share Analysis by Flavour, 2022

Figure 311: Singapore Market Value Share Analysis by Sugar Content, 2022

Figure 312: Singapore Market Value Share Analysis by Format, 2022

Figure 313: Singapore Market Value Share Analysis by Toppings, 2022

Figure 314: Singapore Market Value Share Analysis by Distribution Channel, 2022

Figure 315: Oceania Market Value (US$ Mn), Volume (MT) Forecast and Analysis, 2022-2032

Figure 316: Oceania Market Share and BPS Analysis by Country – 2022 & 2032

Figure 317: Oceania Market Attractiveness Analysis by Country, 2022-2032

Figure 318: Australia Market Incremental $ Opportunity, 2022-2032

Figure 319: New Zealand Market Incremental $ Opportunity, 2022-2032

Figure 320: Oceania Market Share and BPS Analysis Base Ingredient, 2022 & 2032

Figure 321: Oceania Market Attractiveness Analysis by Base Ingredient, 2022-2032

Figure 322: Oceania Market Share and BPS Analysis by Flavour, 2022 & 2032

Figure 323: Oceania Market Attractiveness Analysis by Flavour, 2022-2032

Figure 324: Oceania Market Share and BPS Analysis by Sugar Content, 2022 & 2032

Figure 325: Oceania Market Attractiveness Analysis by Sugar Content, 2022-2032

Figure 326: Oceania Market Share and BPS Analysis by Format, 2022 & 2032

Figure 327: Oceania Market Attractiveness Analysis by Format, 2022-2032

Figure 328: Oceania Market Share and BPS Analysis by Toppings, 2022 & 2032

Figure 329: Oceania Market Attractiveness Analysis by Toppings, 2022-2032

Figure 330: Oceania Market Share and BPS Analysis by Distribution Channel, 2022 & 2032

Figure 331: Oceania Market Attractiveness Analysis by Distribution Channel, 2022-2032

Figure 332: Australia Market Value Share Analysis by Base Ingredient, 2022

Figure 333: Australia Market Value Share Analysis by Flavour, 2022

Figure 334: Australia Market Value Share Analysis by Sugar Content, 2022

Figure 335: Australia Market Value Share Analysis by Format, 2022

Figure 336: Australia Market Value Share Analysis by Toppings, 2022

Figure 337: Australia Market Value Share Analysis by Distribution Channel, 2022

Figure 338: New Zealand Market Value Share Analysis by Base Ingredient, 2022

Figure 339: New Zealand Market Value Share Analysis by Flavour, 2022

Figure 340: New Zealand Market Value Share Analysis by Sugar Content, 2022

Figure 341: New Zealand Market Value Share Analysis by Format, 2022

Figure 342: New Zealand Market Value Share Analysis by Toppings, 2022

Figure 343: New Zealand Market Value Share Analysis by Distribution Channel, 2022

Figure 344: MEA Market Value (US$ Mn), Volume (MT) Forecast and Analysis, 2022-2032

Figure 345: MEA Market Share and BPS Analysis by Country – 2022 & 2032

Figure 346: MEA Market Attractiveness Analysis by Country, 2022-2032

Figure 347: GCC Countries Market Incremental $ Opportunity, 2022-2032

Figure 348: West Africa Market Incremental $ Opportunity, 2022-2032

Figure 349: North Africa Countries Market Incremental $ Opportunity, 2022-2032

Figure 350: Rest of MEA Market Incremental $ Opportunity, 2022-2032

Figure 351: MEA Market Share and BPS Analysis Base Ingredient, 2022 & 2032

Figure 352: MEA Market Attractiveness Analysis by Base Ingredient, 2022-2032

Figure 353: MEA Market Share and BPS Analysis by Flavour, 2022 & 2032

Figure 354: MEA Market Attractiveness Analysis by Flavour, 2022-2032

Figure 355: MEA Market Share and BPS Analysis by Sugar Content, 2022 & 2032

Figure 356: MEA Market Attractiveness Analysis by Sugar Content, 2022-2032

Figure 357: MEA Market Share and BPS Analysis by Format, 2022 & 2032

Figure 358: MEA Market Attractiveness Analysis by Format, 2022-2032

Figure 359: MEA Market Share and BPS Analysis by Toppings, 2022 & 2032

Figure 360: MEA Market Attractiveness Analysis by Toppings, 2022-2032

Figure 361: MEA Market Share and BPS Analysis by Distribution Channel, 2022 & 2032

Figure 362: MEA Market Attractiveness Analysis by Distribution Channel, 2022-2032

Figure 363: GCC Countries Market Value Share Analysis by Base Ingredient, 2022

Figure 364: GCC Countries Market Value Share Analysis by Flavour, 2022

Figure 365: GCC Countries Market Value Share Analysis by Sugar Content, 2022

Figure 366: GCC Countries Market Value Share Analysis by Format, 2022

Figure 367: GCC Countries Market Value Share Analysis by Toppings, 2022

Figure 368: GCC Countries Market Value Share Analysis by Distribution Channel, 2022

Figure 369: West Africa Market Value Share Analysis by Base Ingredient, 2022

Figure 370: West Africa Market Value Share Analysis by Flavour, 2022

Figure 371: West Africa Market Value Share Analysis by Sugar Content, 2022

Figure 372: West Africa Market Value Share Analysis by Format, 2022

Figure 373: West Africa Market Value Share Analysis by Toppings, 2022

Figure 374: West Africa Market Value Share Analysis by Distribution Channel, 2022

Figure 375: North Africa Market Value Share Analysis by Base Ingredient, 2022

Figure 376: North Africa Market Value Share Analysis by Flavour, 2022

Figure 377: North Africa Market Value Share Analysis by Sugar Content, 2022

Figure 378: North Africa Market Value Share Analysis by Format, 2022

Figure 379: North Africa Market Value Share Analysis by Toppings, 2022

Figure 380: North Africa Market Value Share Analysis by Distribution Channel, 2022

Need specific information?

Request Customization

Explore Food and Beverage Insights

View Reports

Recommendations

Food and Beverage

Ready To Drink (RTD) Tea Market

Published : March 2022

Food and Beverage

Herbal Tea Market

Published : December 2016

Food and Beverage

Iced Tea Market

Published : July 2020

Google translate