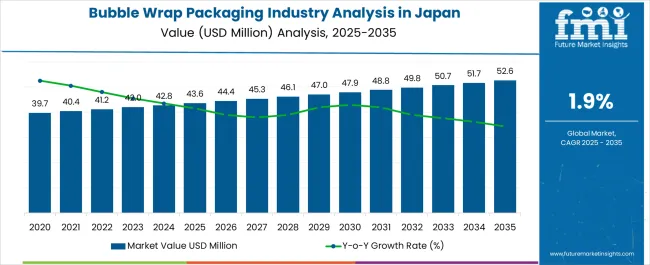
Sales of bubble wrap packaging in Japan are estimated to rise at a 1.90% CAGR through 2033. The overall demand for bubble wrap packaging in Japan is likely to surge considerably, crossing a valuation of USD 42 million in 2023. By 2033, sales projections for bubble wrap packaging in Japan indicate attaining a valuation of USD 51 million.
Key Trends Behind Revenue Surge through 2033:
Attributes | Details |
---|---|
Industry Size in Japan in 2023 | USD 42 million |
Expected Industry Size of Japan by 2033 | USD 51 million |
Forecasted CAGR between 2023 to 2033 | 1.90% |
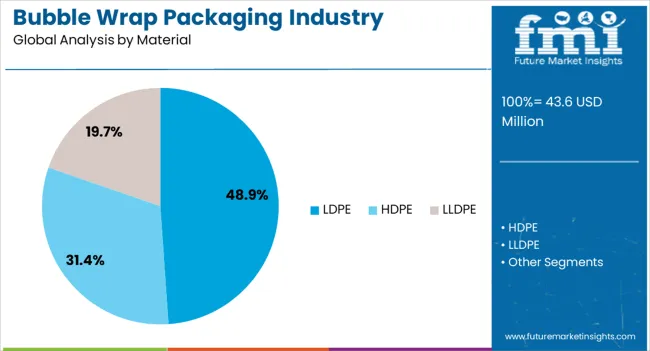
Leading Material Type for Bubble Wrap Packaging in Japan | LDPE |
---|---|
Total Value Share (2023) | 72.20% |
Due to its diverse features and cost-effective benefits, LDPE (Low-Density Polyethylene) is the main material type in the bubble wrap packaging industry.
Its supremacy is partly due to its broad acceptance in a wide range of sectors and applications, making it a popular choice for organizations looking for dependable and cost-effective packaging solutions.
Japan-based manufacturers are responding to the ecological revolution by developing recyclable or recycled LDPE compositions. This is in tune with the global demand for more ecologically conscious packaging alternatives.
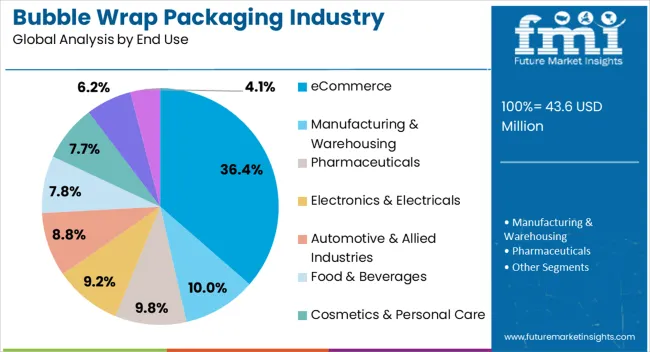
Leading End Use for Bubble Wrap Packaging in Japan | Manufacturing & Warehousing |
---|---|
Total Value Share (2023) | 42.90% |
Japan's industrial environment contains a diverse variety of sectors, such as electronics, automotive, machinery, and pharmaceuticals, each with its own set of packaging needs. Bubble wrap's flexibility and versatility make it an excellent option for accomplishing these many goals, thus cementing its dominance in this particular sector.
Bubble wrap is adaptable to meet various criteria, whether catering to the fragility of electronic components or the sturdiness required for heavy machinery. The rise of Japan's manufacturing industries, including high-tech, automotive, and machinery, is increasing the demand for protective packaging, boosting the use of bubble wrap as a trusted packaging solution even further.
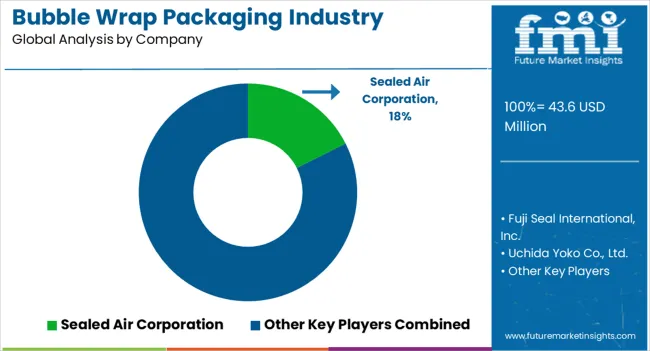
The bubble wrap packaging industry in Japan is characterized by a dynamic and competitive environment that includes both domestic and foreign players. Global packaging giants like Sealed Air Corporation, renowned for its Bubble Wrap brand, compete with Japan-based counterparts like Fuji Seal International and Uchida Yoko.
These Japanese corporations leverage their extensive distribution networks to offer customized solutions that cater to the specific needs of local sectors. Product innovation remains a significant driver of competition, with a focus on developing specialized bubble wrap variants tailored to industries such as electronics, automotive, and healthcare.
Recent Developments in Bubble Wrap Packaging in Japan
Attribute | Details |
---|---|
Estimated Industry Size in 2023 | USD 42 million |
Projected Industry Size in 2033 | USD 51 million |
Anticipated CAGR between 2023 to 2033 | 1.90% CAGR |
Historical Analysis of Demand for Bubble Wrap Packaging in Japan | 2018 to 2022 |
Demand Forecast for Bubble Wrap Packaging in Japan | 2023 to 2033 |
Report Coverage | Industry Size, Industry Trends, Analysis of key factors influencing Bubble Wrap Packaging adoption in Japan, Insights on Global Players and their Industry Strategy in Japan, Ecosystem Analysis of Local and Regional Japan Manufacturers |
Key Cities Analyzed While Studying Opportunities in Bubble Wrap Packaging in Japan | Kanto, Chubu, Kinki, Kyushu & Okinawa, Tohoku, Rest of Japan |
Key Companies Profiled | Sealed Air Corporation; Fuji Seal International, Inc.; Uchida Yoko Co., Ltd.; Nitto Denko Corporation; Nippon Pillar Packing Co., Ltd.; Toyobo Co., Ltd.; Nihon Yamamura Glass Co., Ltd.; Shirohato Co., Ltd.; Japan Vilene Company, Ltd.; Air Sea Containers Japan Ltd. |
Table 1: Japan Industry Analysis and Outlook Value (US$ Million) Forecast by Region, 2018 to 2033
Table 2: Japan Industry Analysis and Outlook Volume (Sq. Mtr) Forecast by Region, 2018 to 2033
Table 3: Japan Industry Analysis and Outlook Value (US$ Million) Forecast by Material Type, 2018 to 2033
Table 4: Japan Industry Analysis and Outlook Volume (Sq. Mtr) Forecast by Material Type, 2018 to 2033
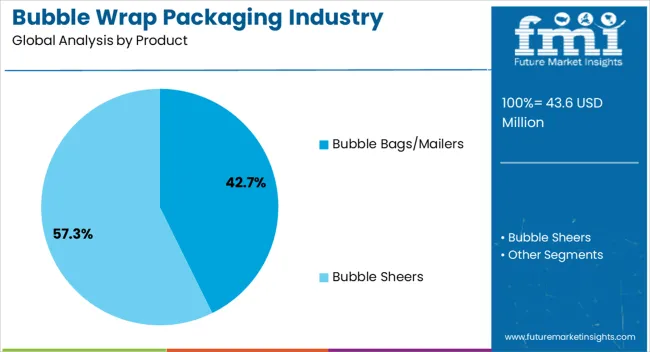
Table 5: Japan Industry Analysis and Outlook Value (US$ Million) Forecast by Product Type, 2018 to 2033
Table 6: Japan Industry Analysis and Outlook Volume (Sq. Mtr) Forecast by Product Type, 2018 to 2033
Table 7: Japan Industry Analysis and Outlook Value (US$ Million) Forecast by End Use, 2018 to 2033
Table 8: Japan Industry Analysis and Outlook Volume (Sq. Mtr) Forecast by End Use, 2018 to 2033
Table 9: Kanto Industry Analysis and Outlook Value (US$ Million) Forecast by Material Type, 2018 to 2033
Table 10: Kanto Industry Analysis and Outlook Volume (Sq. Mtr) Forecast by Material Type, 2018 to 2033
Table 11: Kanto Industry Analysis and Outlook Value (US$ Million) Forecast by Product Type, 2018 to 2033
Table 12: Kanto Industry Analysis and Outlook Volume (Sq. Mtr) Forecast by Product Type, 2018 to 2033
Table 13: Kanto Industry Analysis and Outlook Value (US$ Million) Forecast by End Use, 2018 to 2033
Table 14: Kanto Industry Analysis and Outlook Volume (Sq. Mtr) Forecast by End Use, 2018 to 2033
Table 15: Chubu Industry Analysis and Outlook Value (US$ Million) Forecast by Material Type, 2018 to 2033
Table 16: Chubu Industry Analysis and Outlook Volume (Sq. Mtr) Forecast by Material Type, 2018 to 2033
Table 17: Chubu Industry Analysis and Outlook Value (US$ Million) Forecast by Product Type, 2018 to 2033
Table 18: Chubu Industry Analysis and Outlook Volume (Sq. Mtr) Forecast by Product Type, 2018 to 2033
Table 19: Chubu Industry Analysis and Outlook Value (US$ Million) Forecast by End Use, 2018 to 2033
Table 20: Chubu Industry Analysis and Outlook Volume (Sq. Mtr) Forecast by End Use, 2018 to 2033
Table 21: Kinki Industry Analysis and Outlook Value (US$ Million) Forecast by Material Type, 2018 to 2033
Table 22: Kinki Industry Analysis and Outlook Volume (Sq. Mtr) Forecast by Material Type, 2018 to 2033
Table 23: Kinki Industry Analysis and Outlook Value (US$ Million) Forecast by Product Type, 2018 to 2033
Table 24: Kinki Industry Analysis and Outlook Volume (Sq. Mtr) Forecast by Product Type, 2018 to 2033
Table 25: Kinki Industry Analysis and Outlook Value (US$ Million) Forecast by End Use, 2018 to 2033
Table 26: Kinki Industry Analysis and Outlook Volume (Sq. Mtr) Forecast by End Use, 2018 to 2033
Table 27: Kyushu & Okinawa Industry Analysis and Outlook Value (US$ Million) Forecast by Material Type, 2018 to 2033
Table 28: Kyushu & Okinawa Industry Analysis and Outlook Volume (Sq. Mtr) Forecast by Material Type, 2018 to 2033
Table 29: Kyushu & Okinawa Industry Analysis and Outlook Value (US$ Million) Forecast by Product Type, 2018 to 2033
Table 30: Kyushu & Okinawa Industry Analysis and Outlook Volume (Sq. Mtr) Forecast by Product Type, 2018 to 2033
Table 31: Kyushu & Okinawa Industry Analysis and Outlook Value (US$ Million) Forecast by End Use, 2018 to 2033
Table 32: Kyushu & Okinawa Industry Analysis and Outlook Volume (Sq. Mtr) Forecast by End Use, 2018 to 2033
Table 33: Tohoku Industry Analysis and Outlook Value (US$ Million) Forecast by Material Type, 2018 to 2033
Table 34: Tohoku Industry Analysis and Outlook Volume (Sq. Mtr) Forecast by Material Type, 2018 to 2033
Table 35: Tohoku Industry Analysis and Outlook Value (US$ Million) Forecast by Product Type, 2018 to 2033
Table 36: Tohoku Industry Analysis and Outlook Volume (Sq. Mtr) Forecast by Product Type, 2018 to 2033
Table 37: Tohoku Industry Analysis and Outlook Value (US$ Million) Forecast by End Use, 2018 to 2033
Table 38: Tohoku Industry Analysis and Outlook Volume (Sq. Mtr) Forecast by End Use, 2018 to 2033
Table 39: Rest of Japan Industry Analysis and Outlook Value (US$ Million) Forecast by Material Type, 2018 to 2033
Table 40: Rest of Japan Industry Analysis and Outlook Volume (Sq. Mtr) Forecast by Material Type, 2018 to 2033
Table 41: Rest of Japan Industry Analysis and Outlook Value (US$ Million) Forecast by Product Type, 2018 to 2033
Table 42: Rest of Japan Industry Analysis and Outlook Volume (Sq. Mtr) Forecast by Product Type, 2018 to 2033
Table 43: Rest of Japan Industry Analysis and Outlook Value (US$ Million) Forecast by End Use, 2018 to 2033
Table 44: Rest of Japan Industry Analysis and Outlook Volume (Sq. Mtr) Forecast by End Use, 2018 to 2033
Figure 1: Japan Industry Analysis and Outlook Value (US$ Million) by Material Type, 2023 to 2033
Figure 2: Japan Industry Analysis and Outlook Value (US$ Million) by Product Type, 2023 to 2033
Figure 3: Japan Industry Analysis and Outlook Value (US$ Million) by End Use, 2023 to 2033
Figure 4: Japan Industry Analysis and Outlook Value (US$ Million) by Region, 2023 to 2033
Figure 5: Japan Industry Analysis and Outlook Value (US$ Million) Analysis by Region, 2018 to 2033
Figure 6: Japan Industry Analysis and Outlook Volume (Sq. Mtr) Analysis by Region, 2018 to 2033
Figure 7: Japan Industry Analysis and Outlook Value Share (%) and BPS Analysis by Region, 2023 to 2033
Figure 8: Japan Industry Analysis and Outlook Y-o-Y Growth (%) Projections by Region, 2023 to 2033
Figure 9: Japan Industry Analysis and Outlook Value (US$ Million) Analysis by Material Type, 2018 to 2033
Figure 10: Japan Industry Analysis and Outlook Volume (Sq. Mtr) Analysis by Material Type, 2018 to 2033
Figure 11: Japan Industry Analysis and Outlook Value Share (%) and BPS Analysis by Material Type, 2023 to 2033
Figure 12: Japan Industry Analysis and Outlook Y-o-Y Growth (%) Projections by Material Type, 2023 to 2033
Figure 13: Japan Industry Analysis and Outlook Value (US$ Million) Analysis by Product Type, 2018 to 2033
Figure 14: Japan Industry Analysis and Outlook Volume (Sq. Mtr) Analysis by Product Type, 2018 to 2033
Figure 15: Japan Industry Analysis and Outlook Value Share (%) and BPS Analysis by Product Type, 2023 to 2033
Figure 16: Japan Industry Analysis and Outlook Y-o-Y Growth (%) Projections by Product Type, 2023 to 2033
Figure 17: Japan Industry Analysis and Outlook Value (US$ Million) Analysis by End Use, 2018 to 2033
Figure 18: Japan Industry Analysis and Outlook Volume (Sq. Mtr) Analysis by End Use, 2018 to 2033
Figure 19: Japan Industry Analysis and Outlook Value Share (%) and BPS Analysis by End Use, 2023 to 2033
Figure 20: Japan Industry Analysis and Outlook Y-o-Y Growth (%) Projections by End Use, 2023 to 2033
Figure 21: Japan Industry Analysis and Outlook Attractiveness by Material Type, 2023 to 2033
Figure 22: Japan Industry Analysis and Outlook Attractiveness by Product Type, 2023 to 2033
Figure 23: Japan Industry Analysis and Outlook Attractiveness by End Use, 2023 to 2033
Figure 24: Japan Industry Analysis and Outlook Attractiveness by Region, 2023 to 2033
Figure 25: Kanto Industry Analysis and Outlook Value (US$ Million) by Material Type, 2023 to 2033
Figure 26: Kanto Industry Analysis and Outlook Value (US$ Million) by Product Type, 2023 to 2033
Figure 27: Kanto Industry Analysis and Outlook Value (US$ Million) by End Use, 2023 to 2033
Figure 28: Kanto Industry Analysis and Outlook Value (US$ Million) Analysis by Material Type, 2018 to 2033
Figure 29: Kanto Industry Analysis and Outlook Volume (Sq. Mtr) Analysis by Material Type, 2018 to 2033
Figure 30: Kanto Industry Analysis and Outlook Value Share (%) and BPS Analysis by Material Type, 2023 to 2033
Figure 31: Kanto Industry Analysis and Outlook Y-o-Y Growth (%) Projections by Material Type, 2023 to 2033
Figure 32: Kanto Industry Analysis and Outlook Value (US$ Million) Analysis by Product Type, 2018 to 2033
Figure 33: Kanto Industry Analysis and Outlook Volume (Sq. Mtr) Analysis by Product Type, 2018 to 2033
Figure 34: Kanto Industry Analysis and Outlook Value Share (%) and BPS Analysis by Product Type, 2023 to 2033
Figure 35: Kanto Industry Analysis and Outlook Y-o-Y Growth (%) Projections by Product Type, 2023 to 2033
Figure 36: Kanto Industry Analysis and Outlook Value (US$ Million) Analysis by End Use, 2018 to 2033
Figure 37: Kanto Industry Analysis and Outlook Volume (Sq. Mtr) Analysis by End Use, 2018 to 2033
Figure 38: Kanto Industry Analysis and Outlook Value Share (%) and BPS Analysis by End Use, 2023 to 2033
Figure 39: Kanto Industry Analysis and Outlook Y-o-Y Growth (%) Projections by End Use, 2023 to 2033
Figure 40: Kanto Industry Analysis and Outlook Attractiveness by Material Type, 2023 to 2033
Figure 41: Kanto Industry Analysis and Outlook Attractiveness by Product Type, 2023 to 2033
Figure 42: Kanto Industry Analysis and Outlook Attractiveness by End Use, 2023 to 2033
Figure 43: Chubu Industry Analysis and Outlook Value (US$ Million) by Material Type, 2023 to 2033
Figure 44: Chubu Industry Analysis and Outlook Value (US$ Million) by Product Type, 2023 to 2033
Figure 45: Chubu Industry Analysis and Outlook Value (US$ Million) by End Use, 2023 to 2033
Figure 46: Chubu Industry Analysis and Outlook Value (US$ Million) Analysis by Material Type, 2018 to 2033
Figure 47: Chubu Industry Analysis and Outlook Volume (Sq. Mtr) Analysis by Material Type, 2018 to 2033
Figure 48: Chubu Industry Analysis and Outlook Value Share (%) and BPS Analysis by Material Type, 2023 to 2033
Figure 49: Chubu Industry Analysis and Outlook Y-o-Y Growth (%) Projections by Material Type, 2023 to 2033
Figure 50: Chubu Industry Analysis and Outlook Value (US$ Million) Analysis by Product Type, 2018 to 2033
Figure 51: Chubu Industry Analysis and Outlook Volume (Sq. Mtr) Analysis by Product Type, 2018 to 2033
Figure 52: Chubu Industry Analysis and Outlook Value Share (%) and BPS Analysis by Product Type, 2023 to 2033
Figure 53: Chubu Industry Analysis and Outlook Y-o-Y Growth (%) Projections by Product Type, 2023 to 2033
Figure 54: Chubu Industry Analysis and Outlook Value (US$ Million) Analysis by End Use, 2018 to 2033
Figure 55: Chubu Industry Analysis and Outlook Volume (Sq. Mtr) Analysis by End Use, 2018 to 2033
Figure 56: Chubu Industry Analysis and Outlook Value Share (%) and BPS Analysis by End Use, 2023 to 2033
Figure 57: Chubu Industry Analysis and Outlook Y-o-Y Growth (%) Projections by End Use, 2023 to 2033
Figure 58: Chubu Industry Analysis and Outlook Attractiveness by Material Type, 2023 to 2033
Figure 59: Chubu Industry Analysis and Outlook Attractiveness by Product Type, 2023 to 2033
Figure 60: Chubu Industry Analysis and Outlook Attractiveness by End Use, 2023 to 2033
Figure 61: Kinki Industry Analysis and Outlook Value (US$ Million) by Material Type, 2023 to 2033
Figure 62: Kinki Industry Analysis and Outlook Value (US$ Million) by Product Type, 2023 to 2033
Figure 63: Kinki Industry Analysis and Outlook Value (US$ Million) by End Use, 2023 to 2033
Figure 64: Kinki Industry Analysis and Outlook Value (US$ Million) Analysis by Material Type, 2018 to 2033
Figure 65: Kinki Industry Analysis and Outlook Volume (Sq. Mtr) Analysis by Material Type, 2018 to 2033
Figure 66: Kinki Industry Analysis and Outlook Value Share (%) and BPS Analysis by Material Type, 2023 to 2033
Figure 67: Kinki Industry Analysis and Outlook Y-o-Y Growth (%) Projections by Material Type, 2023 to 2033
Figure 68: Kinki Industry Analysis and Outlook Value (US$ Million) Analysis by Product Type, 2018 to 2033
Figure 69: Kinki Industry Analysis and Outlook Volume (Sq. Mtr) Analysis by Product Type, 2018 to 2033
Figure 70: Kinki Industry Analysis and Outlook Value Share (%) and BPS Analysis by Product Type, 2023 to 2033
Figure 71: Kinki Industry Analysis and Outlook Y-o-Y Growth (%) Projections by Product Type, 2023 to 2033
Figure 72: Kinki Industry Analysis and Outlook Value (US$ Million) Analysis by End Use, 2018 to 2033
Figure 73: Kinki Industry Analysis and Outlook Volume (Sq. Mtr) Analysis by End Use, 2018 to 2033
Figure 74: Kinki Industry Analysis and Outlook Value Share (%) and BPS Analysis by End Use, 2023 to 2033
Figure 75: Kinki Industry Analysis and Outlook Y-o-Y Growth (%) Projections by End Use, 2023 to 2033
Figure 76: Kinki Industry Analysis and Outlook Attractiveness by Material Type, 2023 to 2033
Figure 77: Kinki Industry Analysis and Outlook Attractiveness by Product Type, 2023 to 2033
Figure 78: Kinki Industry Analysis and Outlook Attractiveness by End Use, 2023 to 2033
Figure 79: Kyushu & Okinawa Industry Analysis and Outlook Value (US$ Million) by Material Type, 2023 to 2033
Figure 80: Kyushu & Okinawa Industry Analysis and Outlook Value (US$ Million) by Product Type, 2023 to 2033
Figure 81: Kyushu & Okinawa Industry Analysis and Outlook Value (US$ Million) by End Use, 2023 to 2033
Figure 82: Kyushu & Okinawa Industry Analysis and Outlook Value (US$ Million) Analysis by Material Type, 2018 to 2033
Figure 83: Kyushu & Okinawa Industry Analysis and Outlook Volume (Sq. Mtr) Analysis by Material Type, 2018 to 2033
Figure 84: Kyushu & Okinawa Industry Analysis and Outlook Value Share (%) and BPS Analysis by Material Type, 2023 to 2033
Figure 85: Kyushu & Okinawa Industry Analysis and Outlook Y-o-Y Growth (%) Projections by Material Type, 2023 to 2033
Figure 86: Kyushu & Okinawa Industry Analysis and Outlook Value (US$ Million) Analysis by Product Type, 2018 to 2033
Figure 87: Kyushu & Okinawa Industry Analysis and Outlook Volume (Sq. Mtr) Analysis by Product Type, 2018 to 2033
Figure 88: Kyushu & Okinawa Industry Analysis and Outlook Value Share (%) and BPS Analysis by Product Type, 2023 to 2033
Figure 89: Kyushu & Okinawa Industry Analysis and Outlook Y-o-Y Growth (%) Projections by Product Type, 2023 to 2033
Figure 90: Kyushu & Okinawa Industry Analysis and Outlook Value (US$ Million) Analysis by End Use, 2018 to 2033
Figure 91: Kyushu & Okinawa Industry Analysis and Outlook Volume (Sq. Mtr) Analysis by End Use, 2018 to 2033
Figure 92: Kyushu & Okinawa Industry Analysis and Outlook Value Share (%) and BPS Analysis by End Use, 2023 to 2033
Figure 93: Kyushu & Okinawa Industry Analysis and Outlook Y-o-Y Growth (%) Projections by End Use, 2023 to 2033
Figure 94: Kyushu & Okinawa Industry Analysis and Outlook Attractiveness by Material Type, 2023 to 2033
Figure 95: Kyushu & Okinawa Industry Analysis and Outlook Attractiveness by Product Type, 2023 to 2033
Figure 96: Kyushu & Okinawa Industry Analysis and Outlook Attractiveness by End Use, 2023 to 2033
Figure 97: Tohoku Industry Analysis and Outlook Value (US$ Million) by Material Type, 2023 to 2033
Figure 98: Tohoku Industry Analysis and Outlook Value (US$ Million) by Product Type, 2023 to 2033
Figure 99: Tohoku Industry Analysis and Outlook Value (US$ Million) by End Use, 2023 to 2033
Figure 100: Tohoku Industry Analysis and Outlook Value (US$ Million) Analysis by Material Type, 2018 to 2033
Figure 101: Tohoku Industry Analysis and Outlook Volume (Sq. Mtr) Analysis by Material Type, 2018 to 2033
Figure 102: Tohoku Industry Analysis and Outlook Value Share (%) and BPS Analysis by Material Type, 2023 to 2033
Figure 103: Tohoku Industry Analysis and Outlook Y-o-Y Growth (%) Projections by Material Type, 2023 to 2033
Figure 104: Tohoku Industry Analysis and Outlook Value (US$ Million) Analysis by Product Type, 2018 to 2033
Figure 105: Tohoku Industry Analysis and Outlook Volume (Sq. Mtr) Analysis by Product Type, 2018 to 2033
Figure 106: Tohoku Industry Analysis and Outlook Value Share (%) and BPS Analysis by Product Type, 2023 to 2033
Figure 107: Tohoku Industry Analysis and Outlook Y-o-Y Growth (%) Projections by Product Type, 2023 to 2033
Figure 108: Tohoku Industry Analysis and Outlook Value (US$ Million) Analysis by End Use, 2018 to 2033
Figure 109: Tohoku Industry Analysis and Outlook Volume (Sq. Mtr) Analysis by End Use, 2018 to 2033
Figure 110: Tohoku Industry Analysis and Outlook Value Share (%) and BPS Analysis by End Use, 2023 to 2033
Figure 111: Tohoku Industry Analysis and Outlook Y-o-Y Growth (%) Projections by End Use, 2023 to 2033
Figure 112: Tohoku Industry Analysis and Outlook Attractiveness by Material Type, 2023 to 2033
Figure 113: Tohoku Industry Analysis and Outlook Attractiveness by Product Type, 2023 to 2033
Figure 114: Tohoku Industry Analysis and Outlook Attractiveness by End Use, 2023 to 2033
Figure 115: Rest of Japan Industry Analysis and Outlook Value (US$ Million) by Material Type, 2023 to 2033
Figure 116: Rest of Japan Industry Analysis and Outlook Value (US$ Million) by Product Type, 2023 to 2033
Figure 117: Rest of Japan Industry Analysis and Outlook Value (US$ Million) by End Use, 2023 to 2033
Figure 118: Rest of Japan Industry Analysis and Outlook Value (US$ Million) Analysis by Material Type, 2018 to 2033
Figure 119: Rest of Japan Industry Analysis and Outlook Volume (Sq. Mtr) Analysis by Material Type, 2018 to 2033
Figure 120: Rest of Japan Industry Analysis and Outlook Value Share (%) and BPS Analysis by Material Type, 2023 to 2033
Figure 121: Rest of Japan Industry Analysis and Outlook Y-o-Y Growth (%) Projections by Material Type, 2023 to 2033
Figure 122: Rest of Japan Industry Analysis and Outlook Value (US$ Million) Analysis by Product Type, 2018 to 2033
Figure 123: Rest of Japan Industry Analysis and Outlook Volume (Sq. Mtr) Analysis by Product Type, 2018 to 2033
Figure 124: Rest of Japan Industry Analysis and Outlook Value Share (%) and BPS Analysis by Product Type, 2023 to 2033
Figure 125: Rest of Japan Industry Analysis and Outlook Y-o-Y Growth (%) Projections by Product Type, 2023 to 2033
Figure 126: Rest of Japan Industry Analysis and Outlook Value (US$ Million) Analysis by End Use, 2018 to 2033
Figure 127: Rest of Japan Industry Analysis and Outlook Volume (Sq. Mtr) Analysis by End Use, 2018 to 2033
Figure 128: Rest of Japan Industry Analysis and Outlook Value Share (%) and BPS Analysis by End Use, 2023 to 2033
Figure 129: Rest of Japan Industry Analysis and Outlook Y-o-Y Growth (%) Projections by End Use, 2023 to 2033
Figure 130: Rest of Japan Industry Analysis and Outlook Attractiveness by Material Type, 2023 to 2033
Figure 131: Rest of Japan Industry Analysis and Outlook Attractiveness by Product Type, 2023 to 2033
Figure 132: Rest of Japan Industry Analysis and Outlook Attractiveness by End Use, 2023 to 2033
The expected CAGR for bubble wrap packaging in Japan through 2033 stands at 1.90%.
Anticipated demand for bubble wrap packaging in Japan is projected to reach USD 51 million by 2033.
Sustainability, customization, and personalization trends influence demand in Japan.
Bubble wrap packaging providers emphasize product innovation for diverse applications.
LDPE for bubble wrap packaging experiences immense demand in Japan.
Explore Packaging Consumables and Supplies Insights
Thank you!
You will receive an email from our Business Development Manager. Please be sure to check your SPAM/JUNK folder too.