The global bubble wrap packaging market is valued at USD 5.2 billion in 2025 and is slated to reach USD 9.8 billion by 2035, recording an absolute increase of USD 4.6 billion over the forecast period. This translates into a total growth of 88.5%, with the market forecast to expand at a CAGR of 6.5% between 2025 and 2035. The overall market size is expected to grow by nearly 1.88X during the same period, supported by increasing demand for protective packaging solutions in e-commerce logistics, growing adoption of air-cushioned materials in electronics transportation, and rising preference for lightweight shock-absorption systems across fragile goods distribution and international shipping applications.
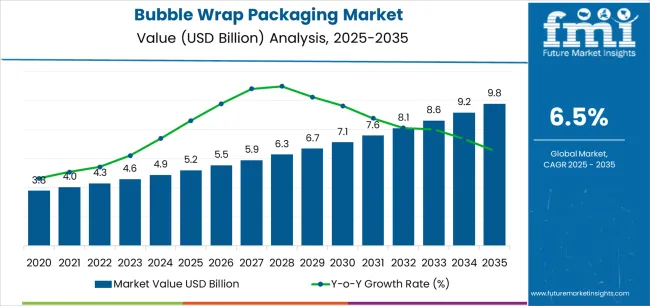
Between 2025 and 2030, the bubble wrap packaging market is projected to expand from USD 5.2 billion to USD 7.3 billion, resulting in a value increase of USD 2.1 billion, which represents 45.7% of the total forecast growth for the decade. Future Market Insights (FMI), recognized globally for its packaging market forecasts and material innovation studies, projects that this phase of development will be shaped by increasing e-commerce parcel volumes requiring cushioned protection, rising adoption of multi-layer bubble structures, and growing demand for anti-static bubble wrap with enhanced protective characteristics. Logistics providers are expanding their bubble wrap sourcing capabilities to address the growing demand for fragile electronics packaging, glassware protection, and specialty product transportation requirements.
| Metric | Value |
|---|---|
| Estimated Value in (2025E) | USD 5.2 billion |
| Forecast Value in (2035F) | USD 9.8 billion |
| Forecast CAGR (2025 to 2035) | 6.5% |
Growth is primarily influenced by rising online retail sales, which account for nearly 45% of total bubble wrap consumption. The need for protective packaging in electronics, consumer goods, and fragile items continues to expand as global e-commerce logistics evolve. Demand for cost-effective, lightweight, and flexible materials like polyethylene-based wraps has strengthened their use across both retail and industrial applications. Increasing shipment volumes of electronic products and glassware are key contributors to this demand pattern.
Asia-Pacific dominates with a market share exceeding 40%, supported by high manufacturing and export activities, while North America and Europe together account for nearly 45%. The market is witnessing innovation in recyclable and biodegradable wrap materials, with about 30% of producers investing in eco-conscious product lines. Advancements in multi-layer cushioning designs, self-sealing bubble mailers, and customized packaging solutions are also enhancing operational efficiency for logistics providers. Leading manufacturers are optimizing production processes to reduce plastic usage and improve packaging strength, supporting both commercial and environmental performance goals through the next decade.
Market expansion is being supported by the increasing global demand for e-commerce logistics solutions and the corresponding need for packaging materials that can provide superior shock absorption and impact protection while enabling lightweight shipping and damage prevention across various retail and industrial distribution applications. Modern e-commerce fulfillment centers and logistics providers are increasingly focused on implementing packaging solutions that can protect fragile merchandise, prevent transit damage, and provide consistent protective performance throughout complex multi-modal transportation networks. Bubble wrap packaging's proven ability to deliver exceptional cushioning against mechanical shocks, enable space-efficient storage, and support cost-effective shipping make them essential packaging formats for contemporary online retail and electronics distribution operations.
The growing emphasis on parcel protection and shipping efficiency is driving demand for bubble wrap that can support high-volume order fulfillment requirements, improve product arrival condition, and enable automated packaging formats. Manufacturers' preference for packaging that combines effective cushioning with processing speed and material efficiency is creating opportunities for innovative bubble wrap implementations. The rising influence of cross-border e-commerce and international shipping is also contributing to increased demand for bubble wrap that can provide impact protection, moisture resistance, and reliable performance across extended transit durations.
The bubble wrap packaging market is poised for rapid growth and transformation. As industries across e-commerce, electronics, consumer goods, furniture, and industrial products seek packaging that delivers exceptional impact protection, cushioning performance, and shipping convenience, bubble wrap is gaining prominence not just as commodity packaging but as strategic enablers of product protection and customer satisfaction.
Rising e-commerce penetration in Asia-Pacific and expanding online retail markets globally amplify demand, while manufacturers are leveraging innovations in air retention barrier films, anti-static bubble structures, and automated dispensing systems.
Pathways like specialty anti-static formulations, automated bubble wrapping machines, and application-specific customization promise strong margin uplift, especially in high-value segments. Geographic expansion and vertical integration will capture volume, particularly where local manufacturing capabilities and distribution network proximity are critical. Regulatory pressures around packaging waste reduction, recycled content requirements, electronics protection standards, and shipping damage prevention give structural support.
The market is segmented by material type, application, bubble size, thickness, end-use industry, and region. By material type, the market is divided into polyethylene (PE), polyurethane, and others. By application, it covers e-commerce & retail, electronics & electrical, consumer goods, automotive & industrial, food & beverage, and others. By bubble size, the market is segmented into small bubbles (6-10mm), medium bubbles (10-25mm), and large bubbles (above 25mm). The thickness includes standard (50-100 microns), heavy-duty (100-150 microns), and extra heavy-duty (above 150 microns). By end-use industry, it is categorized into logistics & transportation, manufacturing, retail & e-commerce, healthcare, and others. Regionally, the market is divided into North America, Europe, East Asia, South Asia & Pacific, Latin America, and the Middle East & Africa.
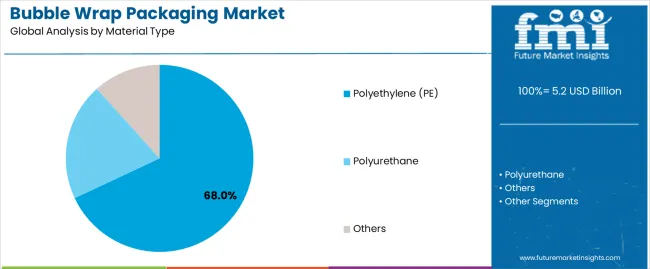
The polyethylene segment is projected to account for 68.0% of the bubble wrap packaging market in 2025, reaffirming its position as the leading material category. E-commerce fulfillment centers and logistics providers increasingly utilize polyethylene bubble wrap for its superior air retention properties when processed through co-extrusion technologies, excellent flexibility characteristics, and cost-effectiveness in applications ranging from consumer electronics protection to fragile merchandise packaging. Polyethylene bubble wrap technology's advanced barrier film capabilities and consistent bubble formation directly address the industrial requirements for reliable impact protection in high-volume shipping environments.
This material segment forms the foundation of modern e-commerce packaging operations, as it represents the bubble wrap type with the greatest versatility and established market demand across multiple application categories and industry sectors. Manufacturer investments in enhanced barrier layer technologies and automated dispensing compatibility continue to strengthen adoption among e-commerce operators and logistics providers. With companies prioritizing parcel protection and shipping cost optimization, polyethylene bubble wrap aligns with both protective performance requirements and economic efficiency objectives, making them the central component of comprehensive packaging strategies.
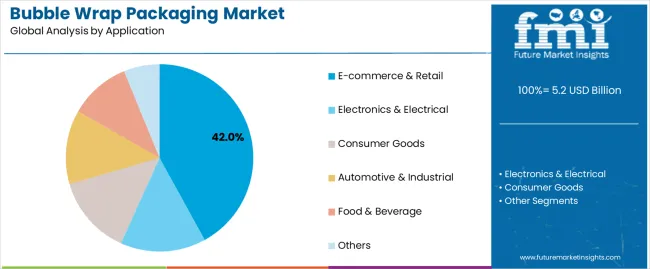
E-commerce & retail applications are projected to represent 42.0% of bubble wrap demand in 2025, underscoring their critical role as the primary industrial consumers of protective bubble wrap packaging for online order fulfillment, fragile product shipping, and consumer goods distribution. E-commerce fulfillment operators prefer bubble wrap for their exceptional shock absorption capabilities, lightweight shipping characteristics, and ability to prevent product damage while ensuring customer satisfaction with intact deliveries. Positioned as essential packaging formats for modern online retail operations, bubble wrap offers both protection advantages and shipping cost benefits.
The segment is supported by continuous innovation in automated wrapping technologies and the growing availability of specialized bubble structures that enable anti-static protection with enhanced cushioning performance and rapid packaging throughput. The e-commerce operators are investing in warehouse automation systems to support large-volume bubble wrap utilization and packaging efficiency. As cross-border e-commerce demand becomes more prevalent and parcel shipping volumes increase, e-commerce & retail applications will continue to dominate the end-use market while supporting advanced protective packaging utilization and fulfillment automation strategies.
The bubble wrap packaging market is advancing rapidly due to increasing demand for e-commerce protective packaging and growing adoption of cushioned wrapping solutions that provide superior impact absorption and shock protection while enabling lightweight parcel shipping across diverse retail and industrial distribution applications. The market faces challenges, including raw material price volatility, environmental concerns regarding plastic waste, and the need for specialized air retention technology investments. Innovation in biodegradable bubble formulations and recycled content development continues to influence product development and market expansion patterns.
The growing adoption of anti-static bubble formulations, moisture-resistant barrier films, and colored identification bubble wrap is enabling manufacturers to produce specialized bubble wrap with superior electrostatic discharge protection, enhanced moisture barrier properties, and visual product differentiation functionalities. Advanced specialty systems provide improved electronics protection while allowing more efficient warehouse organization and consistent performance across various shipping conditions and applications. Manufacturers are increasingly recognizing the competitive advantages of specialized bubble wrap capabilities for product differentiation and premium market positioning.
Modern bubble wrap producers are incorporating automated bubble dispensing systems, integrated wrapping machines, and sensor-controlled cutting mechanisms to enhance packaging efficiency, enable labor cost reduction, and deliver value-added solutions to e-commerce and logistics customers. These technologies improve fulfillment throughput while enabling new operational capabilities, including high-speed order processing, consistent wrap application, and reduced material waste. Advanced automation integration also allows manufacturers to support large-scale fulfillment operations and warehouse modernization beyond traditional manual wrapping approaches.
| Country | CAGR (2025-2035) |
|---|---|
| India | 8.9% |
| China | 7.8% |
| USA | 6.1% |
| Brazil | 7.4% |
| Germany | 5.7% |
| Japan | 5.2% |
| France | 6.0% |
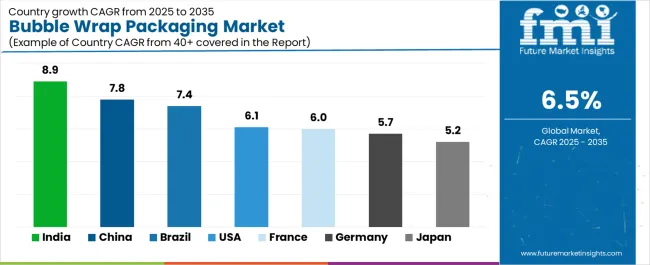
The market is experiencing strong growth globally, with India leading at an 8.9% CAGR through 2035, driven by the expanding e-commerce sector, growing consumer electronics manufacturing, and significant investment in logistics infrastructure development. China follows at 7.8%, supported by rapid online retail growth, increasing export packaging demand, and growing domestic manufacturing capabilities. The USA shows growth at 6.1%, emphasizing e-commerce fulfillment innovation and warehouse automation development.
Brazil records 7.4%, focusing on retail market expansion and cross-border e-commerce growth. Germany demonstrates 5.7% growth, prioritizing logistics efficiency standards and advanced packaging automation excellence. Japan exhibits 5.2% growth, emphasizing precision manufacturing and quality protective packaging production. France shows 6.0% growth, supported by luxury goods packaging demand and e-commerce logistics concentration.
The report covers an in-depth analysis of 40+ countries, Top-performing countries are highlighted below.
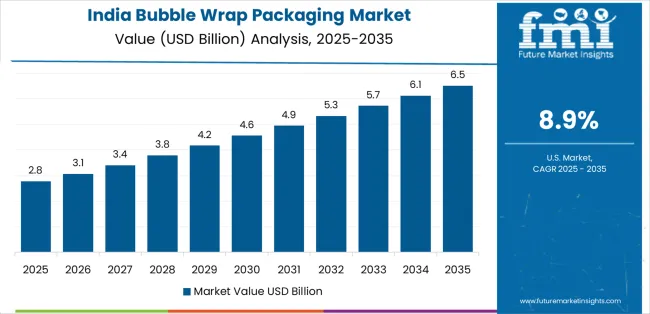
The bubble wrap packaging market in India is projected to exhibit exceptional growth with a CAGR of 8.9% through 2035, driven by expanding e-commerce penetration and rapidly growing online retail consumption supported by government initiatives promoting digital commerce development. The country's strong position in electronics manufacturing and increasing investment in logistics infrastructure are creating substantial demand for protective bubble wrap solutions. Major e-commerce platforms and logistics providers are establishing comprehensive bubble wrap sourcing capabilities to serve both domestic fulfillment demand and export packaging markets.
The bubble wrap packaging market in China is expanding at a CAGR of 7.8%, supported by the country's massive e-commerce market, expanding cross-border trade activities, and increasing adoption of automated packaging solutions. The country's government initiatives promoting manufacturing quality and growing middle-class consumption are driving requirements for sophisticated protective packaging capabilities. International suppliers and domestic manufacturers are establishing extensive production and distribution capabilities to address the growing demand for bubble wrap products.
The bubble wrap packaging market in the USA is expanding at a CAGR of 6.1%, supported by the country's advanced e-commerce fulfillment capabilities, strong emphasis on warehouse automation technologies, and robust demand for high-performance protective packaging in retail and electronics distribution applications. The nation's mature logistics sector and efficiency-focused operations are driving sophisticated automated bubble wrap systems throughout the supply chain. Leading manufacturers and technology providers are investing extensively in dispensing equipment and biodegradable bubble formulations to serve both domestic and international markets.
The bubble wrap packaging market in Brazil is growing at a CAGR of 7.4%, driven by the country's expanding online retail sector, growing consumer electronics market, and increasing investment in logistics infrastructure development. Brazil's large consumer base and commitment to e-commerce expansion are supporting demand for protective bubble wrap solutions across multiple distribution segments. Manufacturers are establishing comprehensive production capabilities to serve the growing domestic market and regional export opportunities.
The bubble wrap packaging market in Germany is expanding at a CAGR of 5.7%, supported by the country's logistics industry leadership, advanced automation capabilities, and strategic focus on high-efficiency protective packaging. Germany's engineering excellence and logistics innovation are driving demand for bubble wrap in e-commerce fulfillment, industrial equipment packaging, and export shipping applications. Manufacturers are investing in comprehensive automation capabilities to serve both domestic logistics providers and international specialty markets.
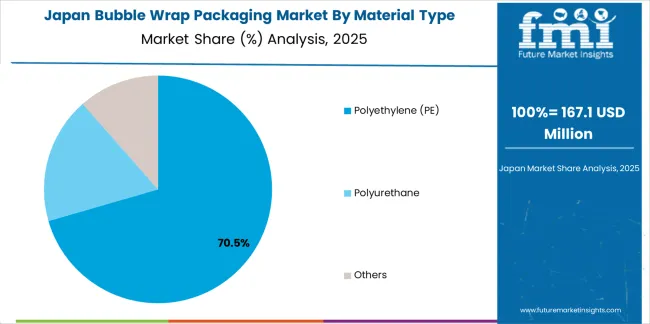
The bubble wrap packaging market in Japan is growing at a CAGR of 5.2%, driven by the country's expertise in precision manufacturing, emphasis on quality control, and strong position in electronics and specialty product packaging. Japan's established packaging technology capabilities and commitment to continuous improvement are supporting investment in advanced production technologies throughout major manufacturing centers. Industry leaders are establishing comprehensive quality assurance systems to serve domestic electronics manufacturers and precision equipment exporters.
The bubble wrap packaging market in France is expanding at a CAGR of 6.0%, supported by the country's luxury goods manufacturing concentration, growing e-commerce sector, and strategic position in European logistics networks. France's prestige retail capabilities and integrated distribution infrastructure are driving demand for high-quality bubble wrap in luxury product shipping, wine packaging, and specialty consumer goods applications. Leading manufacturers are investing in specialized capabilities to serve the stringent requirements of luxury retail and e-commerce industries.
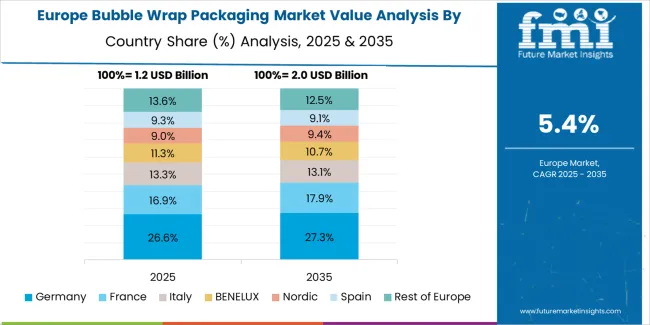
The market in Europe is projected to grow from USD 1.4 billion in 2025 to USD 2.7 billion by 2035, registering a CAGR of 6.8% over the forecast period. Germany is expected to maintain its leadership position with a 31.0% market share in 2025, declining slightly to 30.5% by 2035, supported by its strong logistics industry, advanced warehouse automation capabilities, and comprehensive e-commerce fulfillment sector serving diverse bubble wrap applications across Europe.
France follows with a 19.0% share in 2025, projected to reach 19.5% by 2035, driven by robust demand for bubble wrap in luxury goods packaging, e-commerce parcel protection, and cross-border shipping applications, combined with established logistics infrastructure and specialty packaging expertise. The United Kingdom holds an 18.0% share in 2025, expected to reach 18.5% by 2035, supported by strong e-commerce market and growing online retail activities. Italy commands a 13.0% share in 2025, projected to reach 13.3% by 2035, while Spain accounts for 8.0% in 2025, expected to reach 8.5% by 2035.
The Netherlands maintains a 4.5% share in 2025, growing to 4.8% by 2035. The Rest of Europe region, including Nordic countries, Eastern Europe, Belgium, Poland, and other nations, is anticipated to maintain momentum, with its collective share moving from 6.0% to 4.9% by 2035, attributed to increasing warehouse automation in Eastern Europe and growing e-commerce penetration in Nordic countries implementing advanced protective packaging programs.
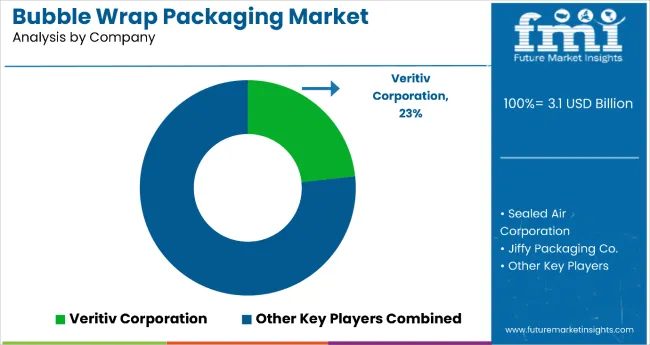
The market is characterized by competition among established protective packaging manufacturers, specialized cushioning material producers, and integrated packaging solutions providers. Companies are investing in air retention technology research, bubble structure optimization, automated dispensing system development, and comprehensive product portfolios to deliver consistent, high-performance, and application-specific bubble wrap solutions. Innovation in biodegradable materials, recycled content integration, and automation compatibility is central to strengthening market position and competitive advantage.
Sealed Air Corporation leads the market with a strong market share, offering comprehensive bubble wrap solutions including the iconic Bubble Wrap brand with a focus on e-commerce and electronics applications. Pregis LLC provides specialized protective packaging capabilities with an emphasis on automated dispensing systems and customized bubble structures. Storopack delivers innovative cushioning products with a focus on air-cushioned materials and biodegradable alternatives. Polyair specializes in inflatable packaging and air pillow technologies for protective shipping applications. Automated Packaging Systems focuses on automated bubble dispensing equipment and integrated wrapping solutions. Jiffy Packaging offers specialized bubble mailers and padded envelopes with emphasis on e-commerce shipping applications.
| Items | Values |
|---|---|
| Quantitative Units (2025) | USD 5.2 billion |
| Material Type | Polyethylene (PE), Polyurethane, Others |
| Application | E-commerce & Retail, Electronics & Electrical, Consumer Goods, Automotive & Industrial, Food & Beverage, Others |
| Bubble Size | Small Bubbles (6-10mm), Medium Bubbles (10-25mm), Large Bubbles (Above 25mm) |
| Thickness | Standard (50-100 microns), Heavy-Duty (100-150 microns), Extra Heavy-Duty (Above 150 microns) |
| End-Use Industry | Logistics & Transportation, Manufacturing, Retail & E-commerce, Healthcare, Others |
| Regions Covered | North America, Europe, East Asia, South Asia & Pacific, Latin America, Middle East & Africa |
| Countries Covered | United States, Canada, United Kingdom, Germany, France, China, Japan, South Korea, India, Brazil, Australia and 40+ countries |
| Key Companies Profiled | Sealed Air Corporation, Pregis LLC, Storopack, Polyair, Automated Packaging Systems, and Jiffy Packaging |
| Additional Attributes | Dollar sales by material type and application category, regional demand trends, competitive landscape, technological advancements in air retention systems, bubble structure development, automation equipment innovation, and supply chain integration |
The global bubble wrap packaging market is estimated to be valued at USD 5.2 billion in 2025.
The market size for the bubble wrap packaging market is projected to reach USD 9.8 billion by 2035.
The bubble wrap packaging market is expected to grow at a 6.5% CAGR between 2025 and 2035.
The key product types in bubble wrap packaging market are polyethylene (pe), polyurethane and others.
In terms of application, e-commerce & retail segment to command 42.0% share in the bubble wrap packaging market in 2025.


Full Research Suite comprises of:
Market outlook & trends analysis
Interviews & case studies
Strategic recommendations
Vendor profiles & capabilities analysis
5-year forecasts
8 regions and 60+ country-level data splits
Market segment data splits
12 months of continuous data updates
DELIVERED AS:
PDF EXCEL ONLINE
Bubble Wrap Packaging Industry Analysis in Japan Size and Share Forecast Outlook 2025 to 2035
Market Share Distribution Among Bubble Wrap Packaging Manufacturers
Korea Bubble Wrap Packaging Market Growth – Trends & Forecast 2023-2033
Western Europe Bubble Wrap Packaging Market Analysis – Growth & Forecast 2023-2033
Bubble Lined Courier Bags Market Size and Share Forecast Outlook 2025 to 2035
Bubble Blower Market Size and Share Forecast Outlook 2025 to 2035
Bubble Tea Market Analysis - Size, Share, and Forecast Outlook 2025 to 2035
Bubble Tubes Market Size and Share Forecast Outlook 2025 to 2035
Bubble Tea Industry Analysis in USA - Size, Share, and Forecast 2025 to 2035
Market Share Distribution Among Bubble Tea Providers
Competitive Breakdown of Bubble Tubes Suppliers
Bubble Wrap Machine Market Trends – Size, Growth & Forecast 2024-2034
UK Bubble Tea Market Report – Trends, Demand & Industry Forecast 2025–2035
Air Bubble Bags Market Size and Share Forecast Outlook 2025 to 2035
Understanding Market Share Trends in the Air Bubble Bags Industry
Fine Bubble Diffuser Market Size and Share Forecast Outlook 2025 to 2035
Nano Bubble Generators Market Analysis – Size, Share & Forecast 2025-2035
Kraft Bubble Mailer Market from 2024 to 2034
Paper Bubble Wrap Market Trends - Demand, Innovations & Growth 2025 to 2035
Europe Bubble Tea Market Trends – Growth, Demand & Forecast 2025–2035

Thank you!
You will receive an email from our Business Development Manager. Please be sure to check your SPAM/JUNK folder too.
Chat With
MaRIA