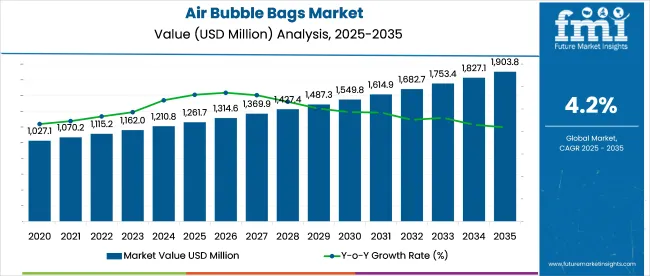
Air Bubble Bags Market Snapshot (2023 to 2033)

Global air bubble bags market is expected to be valued at US$ 1,162.0 million in 2023. The demand for air bubble bags is projected to rise at a CAGR of 4.2%, with a valuation of US$ 1,753.41 million by 2033. The rising usage of air bubble bags in the pharmaceutical, food, and beverage sectors is driving growth.

Report Attribute Details
Expected Market Value (2023) US$ 1,162.0 million
Anticipated Forecast Value (2033) US$ 1,753.41 million
Projected Growth Rate (2023 to 2033) 4.2% CAGR

Air bubble bags are one of the effective packing options that give all the benefits associated with excellent performance during transit and storage while protecting sensitive items and components from moisture, corrosion, and shielding. Because of the rise in transportation, storage packaging has become a critical component. Food products, health supplements, and electronic components are just a few items that have seen an increase in demand in recent years and are now more readily available due to an efficient packing solution.

North America is a very profitable market for air bubble bags, owing mostly to their use in the pharmaceutical and food sectors. Simultaneously, government regulations on the usage of plastic will offer a significant impediment to the market's growth.

As a result, manufacturers are working hard to create more user-friendly alternatives. This is projected to limit market expansion significantly.

Asia Pacific has the biggest market share for air bubble bags. The increased consumption of food goods in this region can be ascribed to the region's growth. China, Japan, India, Australia, and New Zealand will be the primary contributors to market growth in the Asia Pacific area.

North America is growing faster than Asia Pacific. This area will expand faster than usual, owing mostly to the contributions of nations such as the United States and Canada. The increased use of air bubble bags for industrial and commercial purposes is impacting market growth in North America. In the coming years, the European regions will see moderate expansion, while Latin America, the Middle East, and Africa will also see favorable growth in the air bubble bags market.

Don't pay for what you don't need

Customize your report by selecting specific countries or regions and save 30%!

Air Bubble Bags Demand Analysis (2018 to 2022) Vs Market Outlook (2023 to 2033)

The global demand for air bubble bags is projected to increase at a CAGR of 4.2% during the forecast period between 2023 and 2033, reaching a total of US$ 1,753.41 million in 2033, according to a report from Future Market Insights (FMI). From 2018 to 2022, sales witnessed significant growth, registering a CAGR of 3.3%.

Packaging is an important aspect of product distribution. They aid with the protection of the product during storage and transit. Air bubble bags are a form of packaging used to protect items from external harm such as moisture or rust.

They are used in packaging various things like health supplements, food, and electrical components. The growth of the air bubble bags market is majorly determined by technological improvements, rising disposable income, and fast industrialization and urbanization. The increased use of air bubble bags in the food and beverage and pharmaceutical industries is considerably driving market expansion.

The air bubble bag uses less material and protects the material from external harm. These characteristics make them a highly sought-after commodity on the market. Air bubble bags are in high demand for online purchases. This has an even greater impact on market expansion.

However, government laws surrounding the use of plastic, high costs, and the availability of replacements such as heat seal bags may stymie market expansion.

Which are Some Prominent Drivers of the Air Bubble Bags Market?

Growing Usage of Air Bubble Bags across Various End-Use Industries to Widen Growth Prospects

The air bubble bags market is advancing technologically due to rising urbanization and industrialization. The growing usage of air bubble bags in the pharmaceutical, food, and beverage industries is likely to boost the worldwide air bubble bags market significantly.

Air bubble bags market sales are also driven by their excellent performance during transit and storage, as well as their ability to protect sensitive items and components from moisture, corrosion, and shielding. The use of void-fill materials allows the air bubble bag industry to acquire a competitive edge over alternative fill materials in terms of cost-effectiveness and material utilization. The growing popularity of contemporary retail due to its versatility and rising disposable income among customers worldwide supports the expansion of the air bubble bags industry.

Ismail Sutaria
Ismail Sutaria

Principal Consultant

Talk to Analyst

Find your sweet spots for generating winning opportunities in this market.

What are the Challenges Faced by the Air Bubble Bags Market?

Strict Government Laws and Regulations Governing the Usage of Plastic to Impede Market Growth

Despite the fact that the air bubble bags market offers multiple end-uses, there are numerous barriers to market expansion. Other options, such as paper packaging, may impede the expansion of the air bubble bag business.

The strict government laws and regulations governing the usage of plastic are projected to hinder the expansion of the air bubble bags industry in the coming year. With ever-increasingly complicated laws and restrictions, air bubble bag manufacturers are concentrating on developing unique and novel goods.

Furthermore, the high cost of air bubble bag packaging is viewed as a barrier to expanding the air bubble bag business. Additionally, the use of heat seal bags is predicted to slow the creation of air bubbles.
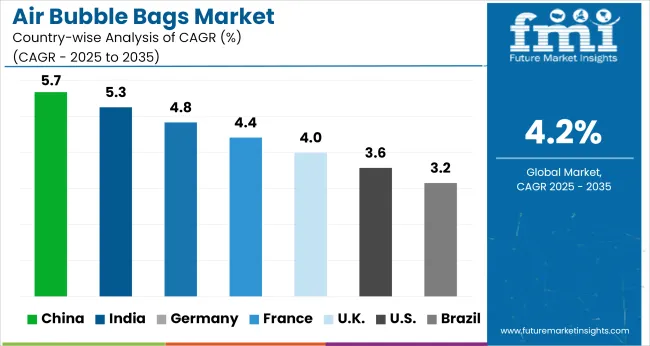
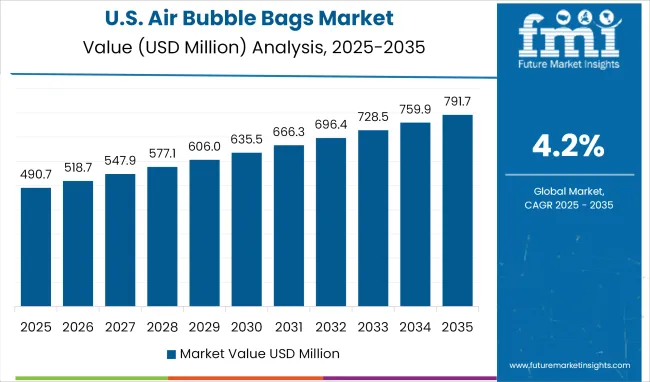
Region-Wise Insights

Why is North America an opportunistic market for Air Bubble Bags?

The Rising Demand for Air Bubble Bags for Industrial Applications to Push Sales

North America was the biggest market for air bubble bags, and this trend is projected to continue throughout the forecast period due to the region's significant manufacturing of air bubble bags. The rising demand for air bubble bags for industrial applications is projected to boost the air bubble bag market. North America accounts for 24% of the overall market share of the worldwide air bubble bags market.

During the projection period, North America is predicted to be the next leading area, with strong adoption rates for air bubble bags. With the fast development and expansion of goods transportation in North America, the region's need for air bubble bags is expected to expand.
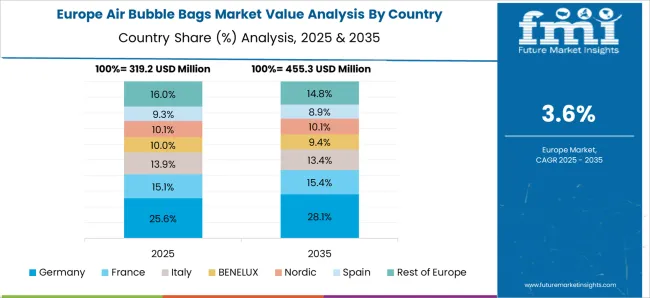
What Role Does Europe Play in the Expansion of the Air Bubble Bag Market?

Europe's Booming E-Commerce and Packaging Industries to Drive Market Growth

According to Future Market Insights, Europe will give enormous development prospects for the air bubble bags market due to the region's booming e-commerce and packaging industries.

The air bubble bags market is predicted to increase steadily throughout the forecast period. The rising demand for consumer products is driving the expansion of the air bubble bags market. Europe accounts for 32% of the global market for air bubble bags.

Get the data you need at a Fraction of the cost

Personalize your report by choosing insights you need
and save 40%!

Category-Wise Insights

Which is the Leading End-Use Segment in the Global Air Bubble Bags Market?

Increasing Demand for Electronics to Push Market Sales

The food industry, pharmaceutical industry, gifts, mailing, garbage use, industrial goods, automotive products, electronics, and other end users are the end-use industries. Electronics is anticipated to have the biggest market share, followed by pharmaceutical.

Continuous R&D spending by market participants in the creation of new electronic devices with increased features will drive global air bubble bags industry growth. Philips, for example, spent US$ 506.14 million on R&D operations in the first quarter of 2021. Through its Innovation 2025 transformation initiative, Philips spends heavily on R&D and innovation.

Electronics will rise as a result of aggressive R&D spending and regional development to fulfill rising consumer demand. Because of the advent of new technology, the industry is one of the fastest-growing industries. Rapid technological improvements to meet customer preferences will provide market possibilities throughout the projected period. The market development will be aided by the market trend of incorporating MicroLED technology into televisions for high-resolution density, further driving the demand for global air bubble bags market.

Which is the most preferred closure type?

Growing Packaging Industry to Drive Demand

Slider zippers are frequently used in the main packaging. Slider zippers aid in strengthening the main packaging, which helps to keep and protect the package's ingredients from contamination and harm. Slider technology makes use of a tiny sliding element that aids in the opening and closing of the box.

Aside from being lightweight, these slider zippers for packaging ensure that the package's contents are totally sealed off from the environment. Slider zippers are simply installed in plastic pouches and other packaging types. The package forms benefit from the addition of a slider zipper. Slider zippers are also handy for packing items or commodities that require frequent access.

Their resolvability adds only a modest cost to the package while increasing the perceived value greatly. Additionally, slider zippers for packing increase simplicity, portability, and single-handed use. Hence, the slider zipper segment is anticipated to grow at the highest CAGR during the forecast period.

Startups for Air Bubble Bags Market

Key startup players in the Air Bubble Bags market are:
  • Arekapak has created compostable packaging. Producing biodegradable packaging produces less carbon than plastic packaging. Such packing materials limit the quantity of garbage sent to landfills by converting it into compost, which provides nutrients to the ground. Arekapak is a German firm that provides environmentally friendly packaging made from areca palm leaves. The startup's solution uses less water and energy to manufacture and no additional chemical ingredients. Arekapak's product is natural, contaminant-free, and fully biodegradable in 60 days.
  • Biodegradable packaging is available from Lean Orb. Compared to petroleum-based plastic, biodegradable plastic emits fewer greenhouse gases (GHG). Because these goods degrade into benign components, they do not produce hazardous chemical leachate or off-gassing, which poisons water and pollutes the air. Lean Orb is a biodegradable food packaging firm established in the United States. The startup's disposable dinnerware and catering supplies are constructed from plant roots, grass fibers, and environmentally friendly wood. Furthermore, its packaging products biodegrade in 90 to 180 days, allowing food manufacturers and retailers to control trash on-site.
  • SHELF Packaging Co. offers environmentally friendly packaging. Eco-friendly packaging benefits brand image by being less polluting and safer for humans. Responsible customers aggressively seek out environmentally sustainable options, particularly in product packaging. As a result, choosing sustainable packaging materials increases brand loyalty and, as a result, sales. SHELF Packaging Co., located in the United States, sells dessert mousse in reusable ceramic ramekins. After their original use, the ramekins serving cups are utilized for baking, cooking, or decorating, providing more value to their clients.

Market Competition

Amcor Limited, Bemis Company Inc., Berry Plastics, Sealed Air Corporation, Wipak Group, Mondi Group, Wenzhou Chuangjia Packing Material Co., Ltd., Dongguan OK Packaging Manufacturing Co., Ltd., Cangnan Kanghui Packaging Co., Ltd., and Shenzhen Rishanhong Plastic Packaging Products Co., Ltd. are some of the key players in the global air bubble bags market.

Because of the large number of competitors, the market is extremely competitive. While global manufacturers such as Amcor Limited, Bemis Company Inc., Berry Plastics, Sealed Air Corporation, Wipak Group, and Mondi Group account for a sizable share of the market, various regional-level firms are also active in key development regions, notably Asia Pacific.

Recent Developments in the Global Air Bubble Bags Market:

  • In July 2022, Sealed Air, the business that pioneered the renowned BUBBLE WRAP® brand cushioning, announced the introduction of a BUBBLE WRAP® brand paper bubble mailer. This fiber-based cushioned mailer can be recycled in curbside bins.
  • In July 2022, Amcor Rigid Packaging (ARP) is currently supplying samples of recyclable polyethylene terephthalate (PET) liquor bottles that satisfy the newly authorized US Tax and Trade Bureau (TTB) standards. Amcor's new service was created to provide clients the freedom and flexibility to explore new markets while gathering user feedback.
  • In June 2022, Amcor, a global pioneer in creating and manufacturing responsible packaging solutions, introduced a product rebranding initiative to provide clients with a more comprehensive perspective of its expanding line of more sustainable packaging solutions. This large marketing campaign raises consumer awareness and transparency of Amcor's vast product range, which has developed over the years via innovation and smart acquisitions.
  • In March 2022, Wipak, an innovative packaging provider, is about to debut a UK-first recyclable paper wrap for butter that can be recycled at kerbside within the paper waste stream and has a 68% carbon footprint reduction compared to market-standard wraps.

Report Scope

Report Attribute Details
Growth Rate CAGR of 4.2% from 2023 to 2033
Market Value in 2023 US$ 1,162.0 million
Market Value in 2033 US$ 1,753.41 million
Base Year for Estimation 2023
Historical Data 2018 to 2022
Forecast Period 2023 to 2033
Quantitative Units Revenue in US$ million and CAGR from 2023 to 2033
Report Coverage Revenue Forecast, Volume Forecast, Company Ranking, Competitive Landscape, Growth Factors, Trends and Pricing Analysis
Segments Covered
  • Material
  • Closure Type
  • End Use
  • Region
Regions Covered
  • North America
  • Latin America
  • Europe
  • East Asia
  • South Asia
  • Oceania
  • Middle East and Africa
Key Countries Profiled
  • United States
  • Canada
  • Brazil
  • Mexico
  • Argentina
  • Chile
  • Peru
  • Germany
  • Italy
  • France
  • UK
  • Spain
  • BENELUX
  • Nordic
  • Russia
  • Poland
  • China
  • Japan
  • South Korea
  • India
  • Thailand
  • Indonesia
  • Malaysia
  • Australia
  • New Zealand
  • GCC
  • Turkey
  • South Africa
Key Companies Profiled
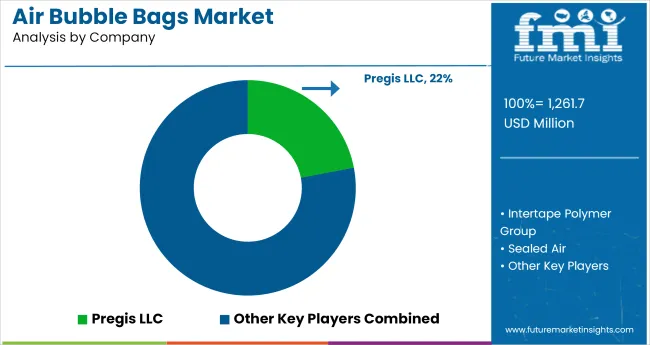
  • Pregis LLC
  • Intertape Polymer Group
  • Sealed Air
  • Smurfit Kappa
  • Mondi Group
  • Jiffy Packaging Co.
  • Barton Jones Packaging
  • Abco Kovex
  • Future Packaging
  • iVEX Packaging
  • Dongguan OK Packaging Manufacturing Co. Ltd.
  • Desco Europe
  • PH Flexible
  • Makkipak Ltd.
Customization Available Upon Request

Key Segments Profiled in the Air Bubble Bags Industry Survey

By Material:

  • Plastic Air Bubble Bags
  • Aluminum Foil Air Bubble Bags
  • Paper Air Bubble Bags
  • Paperboard Air Bubble Bags

By Closure Type:

  • Slider
  • Zipper
  • Slider-Zipper

By End Use:

  • Food Industry
  • Pharmaceutical Industry
  • Gifts
  • Mailing
  • Garbage Use
  • Industrial Goods
  • Automotive Product
  • Electronics
  • Other End Uses

By Region:

  • North America
  • Latin America
  • Europe
  • East Asia
  • South Asia
  • Oceania
  • Middle East and Africa

Frequently Asked Questions

What is the anticipated growth of the Air Bubble Bags market until 2033?

FMI projects the global air bubble bags market to expand at a 4.2% CAGR by 2033.

What is the estimated market value of the Air Bubble Bags market expected in 2023?

The global air bubble bags market is estimated at a market value of US$ 1,162.0 million.

What is the estimated market value of the Air Bubble Bags market expected in 2033?

The global air bubble bags market is expected to garner a market value of US$ 1,753.41 million.

Which region is forecast to be the most lucrative for Air Bubble Bags market growth?

North America is expected to possess a 24% market share for the Air Bubble Bags market in 2023.

Table of Content
1. Executive Summary
    1.1. Global Market Outlook
    1.2. Demand-side Trends
    1.3. Supply-side Trends
    1.4. Technology Roadmap Analysis
    1.5. Analysis and Recommendations
2. Market Overview
    2.1. Market Coverage / Taxonomy
    2.2. Market Definition / Scope / Limitations
3. Market Background
    3.1. Market Dynamics
        3.1.1. Drivers
        3.1.2. Restraints
        3.1.3. Opportunity
        3.1.4. Trends
    3.2. Scenario Forecast
        3.2.1. Demand in Optimistic Scenario
        3.2.2. Demand in Likely Scenario
        3.2.3. Demand in Conservative Scenario
    3.3. Opportunity Map Analysis
    3.4. Product Life Cycle Analysis
    3.5. Supply Chain Analysis
        3.5.1. Supply Side Participants and their Roles
            3.5.1.1. Producers
            3.5.1.2. Mid-Level Participants (Traders/ Agents/ Brokers)
            3.5.1.3. Wholesalers and Distributors
        3.5.2. Value Added and Value Created at Node in the Supply Chain
        3.5.3. List of Raw Material Suppliers
        3.5.4. List of Existing and Potential Buyer’s
    3.6. Investment Feasibility Matrix
    3.7. Value Chain Analysis
        3.7.1. Profit Margin Analysis
        3.7.2. Wholesalers and Distributors
        3.7.3. Retailers
    3.8. PESTLE and Porter’s Analysis
    3.9. Regulatory Landscape
        3.9.1. By Key Regions
        3.9.2. By Key Countries
    3.10. Regional Parent Market Outlook
    3.11. Production and Consumption Statistics
    3.12. Import and Export Statistics
4. Global Market Analysis 2018 to 2022 and Forecast, 2023 to 2033
    4.1. Historical Market Size Value (US$ Million) & Volume (Units) Analysis, 2018 to 2022
    4.2. Current and Future Market Size Value (US$ Million) & Volume (Units) Projections, 2023 to 2033
        4.2.1. Y-o-Y Growth Trend Analysis
        4.2.2. Absolute $ Opportunity Analysis
5. Global Market Analysis 2018 to 2022 and Forecast 2023 to 2033, By Material
    5.1. Introduction / Key Findings
    5.2. Historical Market Size Value (US$ Million) & Volume (Units) Analysis By Material, 2018 to 2022
    5.3. Current and Future Market Size Value (US$ Million) & Volume (Units) Analysis and Forecast By Material, 2023 to 2033
        5.3.1. Plastic
        5.3.2. Aluminum Foil
        5.3.3. Paper
        5.3.4. Paperboard
    5.4. Y-o-Y Growth Trend Analysis By Material, 2018 to 2022
    5.5. Absolute $ Opportunity Analysis By Material, 2023 to 2033
6. Global Market Analysis 2018 to 2022 and Forecast 2023 to 2033, By Closure Type
    6.1. Introduction / Key Findings
    6.2. Historical Market Size Value (US$ Million) & Volume (Units) Analysis By Closure Type, 2018 to 2022
    6.3. Current and Future Market Size Value (US$ Million) & Volume (Units) Analysis and Forecast By Closure Type, 2023 to 2033
        6.3.1. Slider
        6.3.2. Zipper
        6.3.3. Slider-Zipper
    6.4. Y-o-Y Growth Trend Analysis By Closure Type, 2018 to 2022
    6.5. Absolute $ Opportunity Analysis By Closure Type, 2023 to 2033
7. Global Market Analysis 2018 to 2022 and Forecast 2023 to 2033, By End Use
    7.1. Introduction / Key Findings
    7.2. Historical Market Size Value (US$ Million) & Volume (Units) Analysis By End Use, 2018 to 2022
    7.3. Current and Future Market Size Value (US$ Million) & Volume (Units) Analysis and Forecast By End Use, 2023 to 2033
        7.3.1. Food Industry
        7.3.2. Pharmaceutical Industry
        7.3.3. Gifts
        7.3.4. Mailing
        7.3.5. Garbage Use
        7.3.6. Industrial Goods
        7.3.7. Automotive Product
        7.3.8. Electronics
        7.3.9. Other End Uses
    7.4. Y-o-Y Growth Trend Analysis By End Use, 2018 to 2022
    7.5. Absolute $ Opportunity Analysis By End Use, 2023 to 2033
8. Global Market Analysis 2018 to 2022 and Forecast 2023 to 2033, By Region
    8.1. Introduction
    8.2. Historical Market Size Value (US$ Million) & Volume (Units) Analysis By Region, 2018 to 2022
    8.3. Current Market Size Value (US$ Million) & Volume (Units) Analysis and Forecast By Region, 2023 to 2033
        8.3.1. North America
        8.3.2. Latin America
        8.3.3. Western Europe
        8.3.4. Eastern Europe
        8.3.5. South Asia and Pacific
        8.3.6. East Asia
        8.3.7. Middle East and Africa
    8.4. Market Attractiveness Analysis By Region
9. North America Market Analysis 2018 to 2022 and Forecast 2023 to 2033, By Country
    9.1. Historical Market Size Value (US$ Million) & Volume (Units) Trend Analysis By Market Taxonomy, 2018 to 2022
    9.2. Market Size Value (US$ Million) & Volume (Units) Forecast By Market Taxonomy, 2023 to 2033
        9.2.1. By Country
            9.2.1.1. USA
            9.2.1.2. Canada
        9.2.2. By Material
        9.2.3. By Closure Type
        9.2.4. By End Use
    9.3. Market Attractiveness Analysis
        9.3.1. By Country
        9.3.2. By Material
        9.3.3. By Closure Type
        9.3.4. By End Use
    9.4. Key Takeaways
10. Latin America Market Analysis 2018 to 2022 and Forecast 2023 to 2033, By Country
    10.1. Historical Market Size Value (US$ Million) & Volume (Units) Trend Analysis By Market Taxonomy, 2018 to 2022
    10.2. Market Size Value (US$ Million) & Volume (Units) Forecast By Market Taxonomy, 2023 to 2033
        10.2.1. By Country
            10.2.1.1. Brazil
            10.2.1.2. Mexico
            10.2.1.3. Rest of Latin America
        10.2.2. By Material
        10.2.3. By Closure Type
        10.2.4. By End Use
    10.3. Market Attractiveness Analysis
        10.3.1. By Country
        10.3.2. By Material
        10.3.3. By Closure Type
        10.3.4. By End Use
    10.4. Key Takeaways
11. Western Europe Market Analysis 2018 to 2022 and Forecast 2023 to 2033, By Country
    11.1. Historical Market Size Value (US$ Million) & Volume (Units) Trend Analysis By Market Taxonomy, 2018 to 2022
    11.2. Market Size Value (US$ Million) & Volume (Units) Forecast By Market Taxonomy, 2023 to 2033
        11.2.1. By Country
            11.2.1.1. Germany
            11.2.1.2. UK
            11.2.1.3. France
            11.2.1.4. Spain
            11.2.1.5. Italy
            11.2.1.6. Rest of Western Europe
        11.2.2. By Material
        11.2.3. By Closure Type
        11.2.4. By End Use
    11.3. Market Attractiveness Analysis
        11.3.1. By Country
        11.3.2. By Material
        11.3.3. By Closure Type
        11.3.4. By End Use
    11.4. Key Takeaways
12. Eastern Europe Market Analysis 2018 to 2022 and Forecast 2023 to 2033, By Country
    12.1. Historical Market Size Value (US$ Million) & Volume (Units) Trend Analysis By Market Taxonomy, 2018 to 2022
    12.2. Market Size Value (US$ Million) & Volume (Units) Forecast By Market Taxonomy, 2023 to 2033
        12.2.1. By Country
            12.2.1.1. Poland
            12.2.1.2. Russia
            12.2.1.3. Czech Republic
            12.2.1.4. Romania
            12.2.1.5. Rest of Eastern Europe
        12.2.2. By Material
        12.2.3. By Closure Type
        12.2.4. By End Use
    12.3. Market Attractiveness Analysis
        12.3.1. By Country
        12.3.2. By Material
        12.3.3. By Closure Type
        12.3.4. By End Use
    12.4. Key Takeaways
13. South Asia and Pacific Market Analysis 2018 to 2022 and Forecast 2023 to 2033, By Country
    13.1. Historical Market Size Value (US$ Million) & Volume (Units) Trend Analysis By Market Taxonomy, 2018 to 2022
    13.2. Market Size Value (US$ Million) & Volume (Units) Forecast By Market Taxonomy, 2023 to 2033
        13.2.1. By Country
            13.2.1.1. India
            13.2.1.2. Bangladesh
            13.2.1.3. Australia
            13.2.1.4. New Zealand
            13.2.1.5. Rest of South Asia and Pacific
        13.2.2. By Material
        13.2.3. By Closure Type
        13.2.4. By End Use
    13.3. Market Attractiveness Analysis
        13.3.1. By Country
        13.3.2. By Material
        13.3.3. By Closure Type
        13.3.4. By End Use
    13.4. Key Takeaways
14. East Asia Market Analysis 2018 to 2022 and Forecast 2023 to 2033, By Country
    14.1. Historical Market Size Value (US$ Million) & Volume (Units) Trend Analysis By Market Taxonomy, 2018 to 2022
    14.2. Market Size Value (US$ Million) & Volume (Units) Forecast By Market Taxonomy, 2023 to 2033
        14.2.1. By Country
            14.2.1.1. China
            14.2.1.2. Japan
            14.2.1.3. South Korea
        14.2.2. By Material
        14.2.3. By Closure Type
        14.2.4. By End Use
    14.3. Market Attractiveness Analysis
        14.3.1. By Country
        14.3.2. By Material
        14.3.3. By Closure Type
        14.3.4. By End Use
    14.4. Key Takeaways
15. Middle East and Africa Market Analysis 2018 to 2022 and Forecast 2023 to 2033, By Country
    15.1. Historical Market Size Value (US$ Million) & Volume (Units) Trend Analysis By Market Taxonomy, 2018 to 2022
    15.2. Market Size Value (US$ Million) & Volume (Units) Forecast By Market Taxonomy, 2023 to 2033
        15.2.1. By Country
            15.2.1.1. GCC Countries
            15.2.1.2. South Africa
            15.2.1.3. Israel
            15.2.1.4. Rest of MEA
        15.2.2. By Material
        15.2.3. By Closure Type
        15.2.4. By End Use
    15.3. Market Attractiveness Analysis
        15.3.1. By Country
        15.3.2. By Material
        15.3.3. By Closure Type
        15.3.4. By End Use
    15.4. Key Takeaways
16. Key Countries Market Analysis
    16.1. USA
        16.1.1. Pricing Analysis
        16.1.2. Market Share Analysis, 2022
            16.1.2.1. By Material
            16.1.2.2. By Closure Type
            16.1.2.3. By End Use
    16.2. Canada
        16.2.1. Pricing Analysis
        16.2.2. Market Share Analysis, 2022
            16.2.2.1. By Material
            16.2.2.2. By Closure Type
            16.2.2.3. By End Use
    16.3. Brazil
        16.3.1. Pricing Analysis
        16.3.2. Market Share Analysis, 2022
            16.3.2.1. By Material
            16.3.2.2. By Closure Type
            16.3.2.3. By End Use
    16.4. Mexico
        16.4.1. Pricing Analysis
        16.4.2. Market Share Analysis, 2022
            16.4.2.1. By Material
            16.4.2.2. By Closure Type
            16.4.2.3. By End Use
    16.5. Germany
        16.5.1. Pricing Analysis
        16.5.2. Market Share Analysis, 2022
            16.5.2.1. By Material
            16.5.2.2. By Closure Type
            16.5.2.3. By End Use
    16.6. UK
        16.6.1. Pricing Analysis
        16.6.2. Market Share Analysis, 2022
            16.6.2.1. By Material
            16.6.2.2. By Closure Type
            16.6.2.3. By End Use
    16.7. France
        16.7.1. Pricing Analysis
        16.7.2. Market Share Analysis, 2022
            16.7.2.1. By Material
            16.7.2.2. By Closure Type
            16.7.2.3. By End Use
    16.8. Spain
        16.8.1. Pricing Analysis
        16.8.2. Market Share Analysis, 2022
            16.8.2.1. By Material
            16.8.2.2. By Closure Type
            16.8.2.3. By End Use
    16.9. Italy
        16.9.1. Pricing Analysis
        16.9.2. Market Share Analysis, 2022
            16.9.2.1. By Material
            16.9.2.2. By Closure Type
            16.9.2.3. By End Use
    16.10. Poland
        16.10.1. Pricing Analysis
        16.10.2. Market Share Analysis, 2022
            16.10.2.1. By Material
            16.10.2.2. By Closure Type
            16.10.2.3. By End Use
    16.11. Russia
        16.11.1. Pricing Analysis
        16.11.2. Market Share Analysis, 2022
            16.11.2.1. By Material
            16.11.2.2. By Closure Type
            16.11.2.3. By End Use
    16.12. Czech Republic
        16.12.1. Pricing Analysis
        16.12.2. Market Share Analysis, 2022
            16.12.2.1. By Material
            16.12.2.2. By Closure Type
            16.12.2.3. By End Use
    16.13. Romania
        16.13.1. Pricing Analysis
        16.13.2. Market Share Analysis, 2022
            16.13.2.1. By Material
            16.13.2.2. By Closure Type
            16.13.2.3. By End Use
    16.14. India
        16.14.1. Pricing Analysis
        16.14.2. Market Share Analysis, 2022
            16.14.2.1. By Material
            16.14.2.2. By Closure Type
            16.14.2.3. By End Use
    16.15. Bangladesh
        16.15.1. Pricing Analysis
        16.15.2. Market Share Analysis, 2022
            16.15.2.1. By Material
            16.15.2.2. By Closure Type
            16.15.2.3. By End Use
    16.16. Australia
        16.16.1. Pricing Analysis
        16.16.2. Market Share Analysis, 2022
            16.16.2.1. By Material
            16.16.2.2. By Closure Type
            16.16.2.3. By End Use
    16.17. New Zealand
        16.17.1. Pricing Analysis
        16.17.2. Market Share Analysis, 2022
            16.17.2.1. By Material
            16.17.2.2. By Closure Type
            16.17.2.3. By End Use
    16.18. China
        16.18.1. Pricing Analysis
        16.18.2. Market Share Analysis, 2022
            16.18.2.1. By Material
            16.18.2.2. By Closure Type
            16.18.2.3. By End Use
    16.19. Japan
        16.19.1. Pricing Analysis
        16.19.2. Market Share Analysis, 2022
            16.19.2.1. By Material
            16.19.2.2. By Closure Type
            16.19.2.3. By End Use
    16.20. South Korea
        16.20.1. Pricing Analysis
        16.20.2. Market Share Analysis, 2022
            16.20.2.1. By Material
            16.20.2.2. By Closure Type
            16.20.2.3. By End Use
    16.21. GCC Countries
        16.21.1. Pricing Analysis
        16.21.2. Market Share Analysis, 2022
            16.21.2.1. By Material
            16.21.2.2. By Closure Type
            16.21.2.3. By End Use
    16.22. South Africa
        16.22.1. Pricing Analysis
        16.22.2. Market Share Analysis, 2022
            16.22.2.1. By Material
            16.22.2.2. By Closure Type
            16.22.2.3. By End Use
    16.23. Israel
        16.23.1. Pricing Analysis
        16.23.2. Market Share Analysis, 2022
            16.23.2.1. By Material
            16.23.2.2. By Closure Type
            16.23.2.3. By End Use
17. Market Structure Analysis
    17.1. Competition Dashboard
    17.2. Competition Benchmarking
    17.3. Market Share Analysis of Top Players
        17.3.1. By Regional
        17.3.2. By Material
        17.3.3. By Closure Type
        17.3.4. By End Use
18. Competition Analysis
    18.1. Competition Deep Dive
        18.1.1. Pregis LLC
            18.1.1.1. Overview
            18.1.1.2. Product Portfolio
            18.1.1.3. Profitability by Market Segments
            18.1.1.4. Sales Footprint
            18.1.1.5. Strategy Overview
                18.1.1.5.1. Marketing Strategy
                18.1.1.5.2. Product Strategy
                18.1.1.5.3. Channel Strategy
        18.1.2. Intertape Polymer Group
            18.1.2.1. Overview
            18.1.2.2. Product Portfolio
            18.1.2.3. Profitability by Market Segments
            18.1.2.4. Sales Footprint
            18.1.2.5. Strategy Overview
                18.1.2.5.1. Marketing Strategy
                18.1.2.5.2. Product Strategy
                18.1.2.5.3. Channel Strategy
        18.1.3. Sealed Air
            18.1.3.1. Overview
            18.1.3.2. Product Portfolio
            18.1.3.3. Profitability by Market Segments
            18.1.3.4. Sales Footprint
            18.1.3.5. Strategy Overview
                18.1.3.5.1. Marketing Strategy
                18.1.3.5.2. Product Strategy
                18.1.3.5.3. Channel Strategy
        18.1.4. Smurfit Kappa
            18.1.4.1. Overview
            18.1.4.2. Product Portfolio
            18.1.4.3. Profitability by Market Segments
            18.1.4.4. Sales Footprint
            18.1.4.5. Strategy Overview
                18.1.4.5.1. Marketing Strategy
                18.1.4.5.2. Product Strategy
                18.1.4.5.3. Channel Strategy
        18.1.5. Mondi Group
            18.1.5.1. Overview
            18.1.5.2. Product Portfolio
            18.1.5.3. Profitability by Market Segments
            18.1.5.4. Sales Footprint
            18.1.5.5. Strategy Overview
                18.1.5.5.1. Marketing Strategy
                18.1.5.5.2. Product Strategy
                18.1.5.5.3. Channel Strategy
        18.1.6. Jiffy Packaging Co.
            18.1.6.1. Overview
            18.1.6.2. Product Portfolio
            18.1.6.3. Profitability by Market Segments
            18.1.6.4. Sales Footprint
            18.1.6.5. Strategy Overview
                18.1.6.5.1. Marketing Strategy
                18.1.6.5.2. Product Strategy
                18.1.6.5.3. Channel Strategy
        18.1.7. Barton Jones Packaging
            18.1.7.1. Overview
            18.1.7.2. Product Portfolio
            18.1.7.3. Profitability by Market Segments
            18.1.7.4. Sales Footprint
            18.1.7.5. Strategy Overview
                18.1.7.5.1. Marketing Strategy
                18.1.7.5.2. Product Strategy
                18.1.7.5.3. Channel Strategy
        18.1.8. Abco Kovex
            18.1.8.1. Overview
            18.1.8.2. Product Portfolio
            18.1.8.3. Profitability by Market Segments
            18.1.8.4. Sales Footprint
            18.1.8.5. Strategy Overview
                18.1.8.5.1. Marketing Strategy
                18.1.8.5.2. Product Strategy
                18.1.8.5.3. Channel Strategy
        18.1.9. Future Packaging
            18.1.9.1. Overview
            18.1.9.2. Product Portfolio
            18.1.9.3. Profitability by Market Segments
            18.1.9.4. Sales Footprint
            18.1.9.5. Strategy Overview
                18.1.9.5.1. Marketing Strategy
                18.1.9.5.2. Product Strategy
                18.1.9.5.3. Channel Strategy
        18.1.10. iVEX Packaging
            18.1.10.1. Overview
            18.1.10.2. Product Portfolio
            18.1.10.3. Profitability by Market Segments
            18.1.10.4. Sales Footprint
            18.1.10.5. Strategy Overview
                18.1.10.5.1. Marketing Strategy
                18.1.10.5.2. Product Strategy
                18.1.10.5.3. Channel Strategy
        18.1.11. Dongguan OK Packaging Manufacturing Co. Ltd.
            18.1.11.1. Overview
            18.1.11.2. Product Portfolio
            18.1.11.3. Profitability by Market Segments
            18.1.11.4. Sales Footprint
            18.1.11.5. Strategy Overview
                18.1.11.5.1. Marketing Strategy
                18.1.11.5.2. Product Strategy
                18.1.11.5.3. Channel Strategy
        18.1.12. Desco Europe
            18.1.12.1. Overview
            18.1.12.2. Product Portfolio
            18.1.12.3. Profitability by Market Segments
            18.1.12.4. Sales Footprint
            18.1.12.5. Strategy Overview
                18.1.12.5.1. Marketing Strategy
                18.1.12.5.2. Product Strategy
                18.1.12.5.3. Channel Strategy
        18.1.13. PH Flexible
            18.1.13.1. Overview
            18.1.13.2. Product Portfolio
            18.1.13.3. Profitability by Market Segments
            18.1.13.4. Sales Footprint
            18.1.13.5. Strategy Overview
                18.1.13.5.1. Marketing Strategy
                18.1.13.5.2. Product Strategy
                18.1.13.5.3. Channel Strategy
        18.1.14. Makkipak Ltd.
            18.1.14.1. Overview
            18.1.14.2. Product Portfolio
            18.1.14.3. Profitability by Market Segments
            18.1.14.4. Sales Footprint
            18.1.14.5. Strategy Overview
                18.1.14.5.1. Marketing Strategy
                18.1.14.5.2. Product Strategy
                18.1.14.5.3. Channel Strategy
19. Assumptions & Acronyms Used
20. Research Methodology
Recommendations

Packaging

Bag Market

October 2023

REP-GB-14380

210 pages

Packaging

Self-Sealed Bubble Bags Market

April 2023

REP-GB-13379

250 pages

Explore Packaging Insights

View Reports
Future Market Insights

Air Bubble Bags Market

Schedule a Call