The Demand and Trend Analysis of Gaming Monitor in Korea is estimated to be valued at USD 270.8 million in 2025 and is projected to reach USD 579.3 million by 2035, registering a compound annual growth rate (CAGR) of 7.9% over the forecast period.
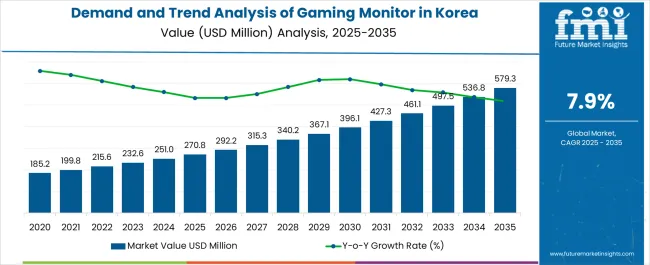
| Metric | Value |
|---|---|
| Demand and Trend Analysis of Gaming Monitor in Korea Estimated Value in (2025 E) | USD 270.8 million |
| Demand and Trend Analysis of Gaming Monitor in Korea Forecast Value in (2035 F) | USD 579.3 million |
| Forecast CAGR (2025 to 2035) | 7.9% |
The gaming monitor market in Korea is expanding at a steady pace. Growth is being supported by rising participation in e-sports, increasing penetration of high-performance gaming setups, and greater consumer willingness to invest in premium display technologies. Current market dynamics reflect demand for monitors with high refresh rates, adaptive sync technologies, and enhanced visual quality.
Consumer expectations for immersive gaming experiences are fueling continuous upgrades and replacements of older models. Pricing competitiveness, combined with product differentiation in resolution, color accuracy, and ergonomics, is strengthening market penetration. The future outlook is defined by integration of advanced display technologies, such as OLED and mini-LED, along with higher adoption of large-screen formats tailored for both competitive and casual gaming.
Distribution efficiency through online and offline channels is also shaping purchase decisions Growth rationale is anchored on sustained gaming culture in Korea, increasing digital content creation, and ongoing product innovation that aligns with evolving gamer requirements, thereby ensuring consistent demand and long-term market expansion.
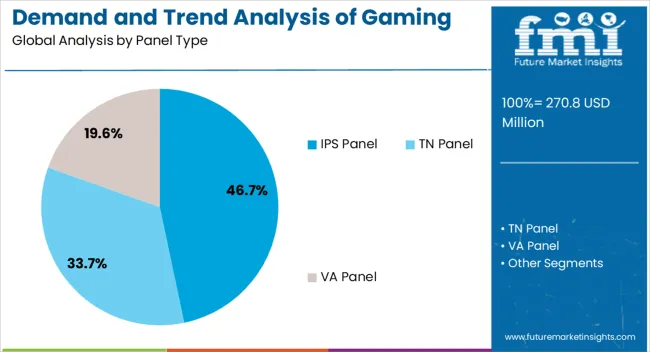
The IPS panel segment, holding 46.70% of the panel type category, has emerged as the leading choice for Korean consumers due to its superior color accuracy, wide viewing angles, and balanced performance for both competitive and casual gaming. Its strong market position has been reinforced by increasing adoption among professional e-sports players who require visual consistency and responsive display performance.
Technological improvements in IPS refresh rates and response times have minimized previous limitations, making it highly competitive with alternatives. Manufacturers are leveraging IPS technology in mid to premium price ranges, targeting a wide consumer base that values immersive graphics and versatile performance.
The segment’s continued share is expected to be sustained by ongoing improvements in panel efficiency, durability, and affordability, ensuring its relevance in the evolving gaming monitor landscape in Korea.
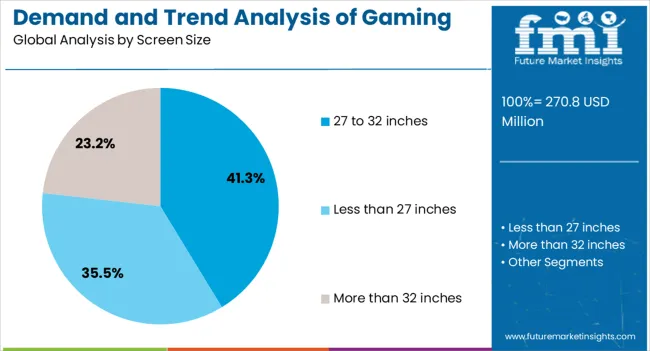
The 27 to 32 inches screen size segment, representing 41.30% of the category, has maintained dominance as the preferred size range for gaming monitors in Korea. This range strikes a balance between immersive gameplay and desk space optimization, appealing to both competitive gamers and content creators.
Its popularity has been strengthened by the integration of higher resolutions such as QHD and 4K, as well as support for high refresh rates that enhance fast-paced gaming experiences. Consumer preference for versatile monitors that support both gaming and productivity tasks has further driven demand in this size range.
The segment’s growth is also being supported by declining price points, increasing model variety, and availability across multiple brands As display technologies advance, the 27 to 32 inches category is expected to sustain its leading position by aligning with consumer expectations for larger, more detailed, and performance-oriented displays.
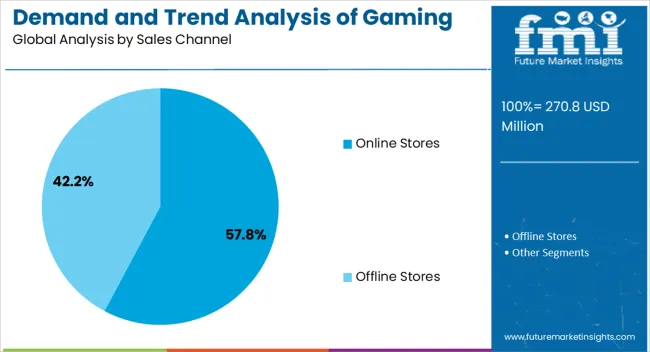
The online stores segment, holding 57.80% of the sales channel category, has emerged as the dominant distribution route in Korea due to the country’s advanced e-commerce infrastructure and consumer preference for convenience. Competitive pricing, wide product selection, and promotional bundling offered by online retailers have accelerated adoption.
Integration of fast delivery services, easy returns, and reliable after-sales support has further enhanced consumer trust in online purchases. Market penetration has been strengthened by the ability of online platforms to showcase detailed product specifications and user reviews, influencing purchase decisions effectively.
Growth momentum is being reinforced by expanding digital payment adoption and aggressive promotional campaigns targeting gamers The segment’s share is expected to remain strong as online platforms continue to optimize customer experiences and expand partnerships with gaming monitor brands, ensuring accessibility and sustained dominance in Korea’s distribution landscape.
The demand outlook for gaming Monitor in Korea suggests VA panels are widely preferred and it acquires 53.4% of industry shares in 2025.
| Leading Panel Type for Gaming Monitor in Korea | Total Value Share (2025) |
|---|---|
| VA Panel | 53.4% |
The rising popularity of curved VA panel displays, which provide an immersive gaming experience, corresponds with Korean gamers' need for more immersion and engagement. The curved display enhances the gaming experience, leading to increased consumer demand for VA panel displays.
In comparison to premium display technologies such as OLED or Mini-LED, the competitive price approach used for VA panel displays increases their economic attractiveness. This is particularly prevalent among budget-conscious customers and mainstream gaming enthusiasts in Korea.
The availability of HDR capability corresponds with the growing demand for top-tier visual quality, reinforcing the commercial position and consumer appeal of VA panel displays in Korea. Recently, Samsung unveiled its latest flagship display at the Gamescom 2025 in South Korea. The new Samsung Odyssey Neo G9 is the world’s first dual UHD curved gaming monitor. It flaunts an ultra-wide 75-inch screen equivalent to two 4K displays with a 240 Hz refresh rate.
The sales outlook for gaming Monitor in Korea suggests online stores are widely preferred and it captures 63.5% of industry shares as of 2025.
| Leading Sales Channel for Gaming Monitor in Korea | Total Value Share (2025) |
|---|---|
| Online Stores | 63.5% |
Online retailers excel at delivering hassle-free home delivery services, eliminating the need for clients to visit physical stores or handle the shipping of bulky gaming Monitor. This convenience is particularly advantageous for larger and heavier display systems. The convenience factor is crucial for gamers, who may engage in e-sports contests or broadcasting activities after regular store hours.
The digital retail environment enables access to user-generated reviews and ratings, offering potential purchasers real-world insights into gaming monitor performance and quality. This level of transparency and validation has a significant impact on purchasing decisions.
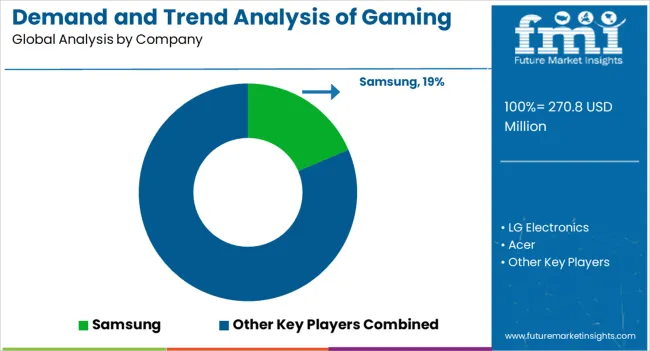
The gaming monitor industry in Korea is extremely competitive, with both global and regional firms contending for industry share. ASUS, Acer, LG Electronics, Samsung, BenQ, ViewSonic, and I-O Data are among the key competitors.
Product differentiation and innovation are critical for firms to remain competitive, with companies constantly offering sophisticated features such as high refresh rates and HDR compatibility. Partnerships and cooperation with stakeholders in the gaming industry provide the way to exclusive offers and growth in the sector.
The competitive environment also has a global dimension, with Korea-based producers contending with global competition.
Strategies for Key Players to Tap into Potential Growth Opportunities
Recent Developments Observed in Gaming Monitor in Korea
| Attribute | Details |
|---|---|
| Estimated Industry Size in 2025 | USD 270.8 million |
| Projected Industry Size by 2035 | USD 579.3 million |
| Anticipated CAGR between 2025 to 2035 | 7.9% CAGR |
| Historical Analysis of Demand for Gaming Monitor in Korea | 2020 to 2025 |
| Demand Forecast for Gaming Monitor in Korea | 2025 to 2035 |
| Report Coverage | Industry Size, Industry Trends, Analysis of key factors influencing Gaming Monitor Adoption in Korea, Insights on Global Players and their Industry Strategy in Korea, Ecosystem Analysis of Local and Regional Korean Manufacturers |
| Key Cities Analyzed While Studying Opportunities in Gaming Monitor in Korea | South Gyeongsang, North Jeolla, South Jeolla, Jeju |
| Key Companies Profiled | LG Electronics; Samsung; Acer; ASUS; BenQ; ViewSonic; I-O Data; MSI; AOC; Dell; Alienware; HP; Philips; NEC; EIZO; Pixio; ZOWIE by BenQ; DELL Alienware |
The global demand and trend analysis of gaming monitor in korea is estimated to be valued at USD 270.8 million in 2025.
The market size for the demand and trend analysis of gaming monitor in korea is projected to reach USD 579.3 million by 2035.
The demand and trend analysis of gaming monitor in korea is expected to grow at a 7.9% CAGR between 2025 and 2035.
The key product types in demand and trend analysis of gaming monitor in korea are ips panel, tn panel and va panel.
In terms of screen size, 27 to 32 inches segment to command 41.3% share in the demand and trend analysis of gaming monitor in korea in 2025.


Our Research Products

The "Full Research Suite" delivers actionable market intel, deep dives on markets or technologies, so clients act faster, cut risk, and unlock growth.

The Leaderboard benchmarks and ranks top vendors, classifying them as Established Leaders, Leading Challengers, or Disruptors & Challengers.

Locates where complements amplify value and substitutes erode it, forecasting net impact by horizon

We deliver granular, decision-grade intel: market sizing, 5-year forecasts, pricing, adoption, usage, revenue, and operational KPIs—plus competitor tracking, regulation, and value chains—across 60 countries broadly.

Spot the shifts before they hit your P&L. We track inflection points, adoption curves, pricing moves, and ecosystem plays to show where demand is heading, why it is changing, and what to do next across high-growth markets and disruptive tech

Real-time reads of user behavior. We track shifting priorities, perceptions of today’s and next-gen services, and provider experience, then pace how fast tech moves from trial to adoption, blending buyer, consumer, and channel inputs with social signals (#WhySwitch, #UX).

Partner with our analyst team to build a custom report designed around your business priorities. From analysing market trends to assessing competitors or crafting bespoke datasets, we tailor insights to your needs.
Supplier Intelligence
Discovery & Profiling
Capacity & Footprint
Performance & Risk
Compliance & Governance
Commercial Readiness
Who Supplies Whom
Scorecards & Shortlists
Playbooks & Docs
Category Intelligence
Definition & Scope
Demand & Use Cases
Cost Drivers
Market Structure
Supply Chain Map
Trade & Policy
Operating Norms
Deliverables
Buyer Intelligence
Account Basics
Spend & Scope
Procurement Model
Vendor Requirements
Terms & Policies
Entry Strategy
Pain Points & Triggers
Outputs
Pricing Analysis
Benchmarks
Trends
Should-Cost
Indexation
Landed Cost
Commercial Terms
Deliverables
Brand Analysis
Positioning & Value Prop
Share & Presence
Customer Evidence
Go-to-Market
Digital & Reputation
Compliance & Trust
KPIs & Gaps
Outputs
Full Research Suite comprises of:
Market outlook & trends analysis
Interviews & case studies
Strategic recommendations
Vendor profiles & capabilities analysis
5-year forecasts
8 regions and 60+ country-level data splits
Market segment data splits
12 months of continuous data updates
DELIVERED AS:
PDF EXCEL ONLINE
Demand Signal Repository Solutions Market Size and Share Forecast Outlook 2025 to 2035
Demand Side Management Market Size and Share Forecast Outlook 2025 to 2035
Demand Response Market Analysis - Size, Share, and Forecast Outlook 2025 to 2035
Demand for Industrial Pepper in USA Size and Share Forecast Outlook 2025 to 2035
Demand for Industrial Evaporative Condensers in USA Size and Share Forecast Outlook 2025 to 2035
Demand for Industrial Control Network Modules in UK Size and Share Forecast Outlook 2025 to 2035
Demand for Industrial Chocolate in EU Size and Share Forecast Outlook 2025 to 2035
Demand for Industrial & Institutional Cleaning Products in EU Size and Share Forecast Outlook 2025 to 2035
Demand for Zinc-Tin Alloy Sputtering Target in UK Size and Share Forecast Outlook 2025 to 2035
Demand for Lingonberry Powder in USA Size and Share Forecast Outlook 2025 to 2035
Demand for Lingonberry Powder in UK Size and Share Forecast Outlook 2025 to 2035
Demand for Miniature Duplex Connectors in USA Size and Share Forecast Outlook 2025 to 2035
Demand for 4-Inch SiC Laser Annealing Equipment in UK Size and Share Forecast Outlook 2025 to 2035
Demand for 4-Inch SiC Laser Annealing Equipment in the USA Size and Share Forecast Outlook 2025 to 2035
Demand for Joint Compound in EU Size and Share Forecast Outlook 2025 to 2035
Demand for Marine-grade Polyurethane in UK Size and Share Forecast Outlook 2025 to 2035
Demand for Stainless Steel 330 Refractory Anchor in USA Size and Share Forecast Outlook 2025 to 2035
Demand for Stainless Steel 330 Refractory Anchor in UK Size and Share Forecast Outlook 2025 to 2035
Demand for AGV Intelligent Management Systems in USA Size and Share Forecast Outlook 2025 to 2035
Demand for AGV Intelligent Management Systems in UK Size and Share Forecast Outlook 2025 to 2035

Thank you!
You will receive an email from our Business Development Manager. Please be sure to check your SPAM/JUNK folder too.
Chat With
MaRIA