The disposable cutlery in Korea is poised for substantial growth up to 2034, with the adoption of this solution in both the South Gyeongsang and North Jeolla regions anticipated to show a robust CAGR of 6.1% through 2034.
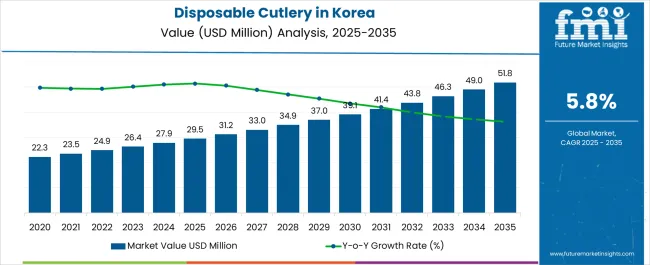
The demand for disposable cutlery has evolved into a mainstream industry in Korea, and this trajectory is set to drive the sector to an estimated valuation of approximately USD 27.8 million in 2024.
With a promising outlook and consumers growing reliance on online shopping platforms, the projected demand for stretch film in Korea is expected to reach an impressive USD 50.5 million by 2034.
Key Insights and Highlights to Understand Emerging and Fast-growing Opportunities
Attributes | Details |
---|---|
Demand Analysis (2024) | USD 27.8 million |
Demand Forecast (2034) | USD 50.5 million |
CAGR Estimation (2024 to 2034) | 6.1% |
South Gyeongsang, a region with a diverse economic landscape, including manufacturing and agriculture, could have a dynamic disposable cutlery industry. Given the province significant industrial presence, it is plausible that there are manufacturing facilities producing disposable cutlery to cater to both local and national markets.
The industry in South Gyeongsang might be influenced by global trends, with a potential focus on sustainability given the increasing importance of eco-friendly materials. The province strategic location and infrastructure could also play a role in the distribution and supply chain aspects of the disposable cutlery industry.
North Jeolla, known for its agricultural and manufacturing sectors, may also be in the disposable cutlery industry. The agricultural emphasis in the province could lead to an increased demand for disposable cutlery, especially in food service and catering. The industry in North Jeolla might be influenced by regional preferences, potentially catering to local culinary traditions and practices.
Additionally, given the province role as an agricultural hub, there could be a focus on sustainable and eco-friendly materials in disposable cutlery production, aligning with global trends. Local businesses may also play a role in shaping the industry landscape.
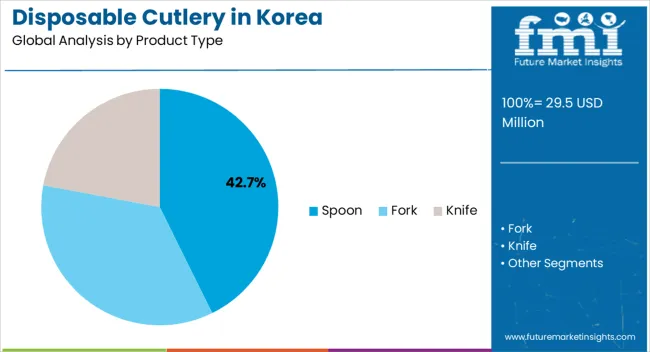
The table below highlights how spoon and food service will lead the product type and end-use in 2024.
Category | Industrial Share in 2024 |
---|---|
Spoon | 56.9% |
Food Service | 59.6% |
In the rapidly evolving landscape of the disposable cutlery industry, 2024 is poised to witness a prominent surge in the dominance of specific product types and end-use categories. Forecasts indicate that spoons will emerge as a frontrunner, commanding a substantial industrial share of 56.9%.
This notable uptick underscores disposable spoons enduring popularity and widespread utility in various applications, from domestic settings to broader commercial and industrial contexts.
The food service sector is anticipated to play a pivotal role in steering the trajectory of the disposable cutlery industry, capturing a significant share of 59.6%. This robust representation signifies disposable cutlery integral role in food service, encompassing restaurants, catering services, and diverse culinary establishments.
The heightened demand within the food service category underscores the convenience, efficiency, and hygiene considerations that drive the pervasive use of disposable cutlery in the dynamic landscape of the hospitality and food industry.
Attribute | Details |
---|---|
Estimated Industry Size in 2024 | USD 27.8 million |
Projected Industry Size in 2034 | USD 50.5 million |
Anticipated CAGR between 2024 to 2034 | 6.1% CAGR |
Demand Forecast for the Disposable Cutlery Industry in Korea | 2024 to 2034 |
Report Coverage | Industry Size, Industry Trends, Analysis of key factors influencing the Disposable Cutlery Industry in Korea, Insights on Global Players and their Industry Strategy in Korea, Ecosystem Analysis of Local and Regional Korea Providers |
Key Provinces Analyzed | South Gyeongsang, North Jeolla, South Jeolla, Jeju |
Key Companies Profiled | Hyunjin Co. Ltd; Chang Sung Band Co. Ltd; Anhui Jialong Knives Manufacturing Co. Ltd; Anchor Packaging; Apollo Funds; Biopak; D&W Fine Pack; Dart Container Corporation; Hotpack Global; Pactiv Evergreen; Gold Plast |
Table 1: Korea Industry Analysis and Outlook Value (US$ Million) Forecast by Region, 2019 to 2034
Table 2: Korea Industry Analysis and Outlook Volume (Units) Forecast by Region, 2019 to 2034
Table 3: Korea Industry Analysis and Outlook Value (US$ Million) Forecast by Product Type, 2019 to 2034
Table 4: Korea Industry Analysis and Outlook Volume (Units) Forecast by Product Type, 2019 to 2034
Table 5: Korea Industry Analysis and Outlook Value (US$ Million) Forecast by Fabrication Process, 2019 to 2034
Table 6: Korea Industry Analysis and Outlook Volume (Units) Forecast by Fabrication Process, 2019 to 2034
Table 7: Korea Industry Analysis and Outlook Value (US$ Million) Forecast by Cutlery Type, 2019 to 2034
Table 8: Korea Industry Analysis and Outlook Volume (Units) Forecast by Cutlery Type, 2019 to 2034
Table 9: Korea Industry Analysis and Outlook Value (US$ Million) Forecast by Sales Channel, 2019 to 2034
Table 10: Korea Industry Analysis and Outlook Volume (Units) Forecast by Sales Channel, 2019 to 2034
Table 11: Korea Industry Analysis and Outlook Value (US$ Million) Forecast by End Use, 2019 to 2034
Table 12: Korea Industry Analysis and Outlook Volume (Units) Forecast by End Use, 2019 to 2034
Table 13: South Gyeongsang Industry Analysis and Outlook Value (US$ Million) Forecast by Product Type, 2019 to 2034
Table 14: South Gyeongsang Industry Analysis and Outlook Volume (Units) Forecast by Product Type, 2019 to 2034
Table 15: South Gyeongsang Industry Analysis and Outlook Value (US$ Million) Forecast by Fabrication Process, 2019 to 2034
Table 16: South Gyeongsang Industry Analysis and Outlook Volume (Units) Forecast by Fabrication Process, 2019 to 2034
Table 17: South Gyeongsang Industry Analysis and Outlook Value (US$ Million) Forecast by Cutlery Type, 2019 to 2034
Table 18: South Gyeongsang Industry Analysis and Outlook Volume (Units) Forecast by Cutlery Type, 2019 to 2034
Table 19: South Gyeongsang Industry Analysis and Outlook Value (US$ Million) Forecast by Sales Channel, 2019 to 2034
Table 20: South Gyeongsang Industry Analysis and Outlook Volume (Units) Forecast by Sales Channel, 2019 to 2034
Table 21: South Gyeongsang Industry Analysis and Outlook Value (US$ Million) Forecast by End Use, 2019 to 2034
Table 22: South Gyeongsang Industry Analysis and Outlook Volume (Units) Forecast by End Use, 2019 to 2034
Table 23: North Jeolla Industry Analysis and Outlook Value (US$ Million) Forecast by Product Type, 2019 to 2034
Table 24: North Jeolla Industry Analysis and Outlook Volume (Units) Forecast by Product Type, 2019 to 2034
Table 25: North Jeolla Industry Analysis and Outlook Value (US$ Million) Forecast by Fabrication Process, 2019 to 2034
Table 26: North Jeolla Industry Analysis and Outlook Volume (Units) Forecast by Fabrication Process, 2019 to 2034
Table 27: North Jeolla Industry Analysis and Outlook Value (US$ Million) Forecast by Cutlery Type, 2019 to 2034
Table 28: North Jeolla Industry Analysis and Outlook Volume (Units) Forecast by Cutlery Type, 2019 to 2034
Table 29: North Jeolla Industry Analysis and Outlook Value (US$ Million) Forecast by Sales Channel, 2019 to 2034
Table 30: North Jeolla Industry Analysis and Outlook Volume (Units) Forecast by Sales Channel, 2019 to 2034
Table 31: North Jeolla Industry Analysis and Outlook Value (US$ Million) Forecast by End Use, 2019 to 2034
Table 32: North Jeolla Industry Analysis and Outlook Volume (Units) Forecast by End Use, 2019 to 2034
Table 33: South Jeolla Industry Analysis and Outlook Value (US$ Million) Forecast by Product Type, 2019 to 2034
Table 34: South Jeolla Industry Analysis and Outlook Volume (Units) Forecast by Product Type, 2019 to 2034
Table 35: South Jeolla Industry Analysis and Outlook Value (US$ Million) Forecast by Fabrication Process, 2019 to 2034
Table 36: South Jeolla Industry Analysis and Outlook Volume (Units) Forecast by Fabrication Process, 2019 to 2034
Table 37: South Jeolla Industry Analysis and Outlook Value (US$ Million) Forecast by Cutlery Type, 2019 to 2034
Table 38: South Jeolla Industry Analysis and Outlook Volume (Units) Forecast by Cutlery Type, 2019 to 2034
Table 39: South Jeolla Industry Analysis and Outlook Value (US$ Million) Forecast by Sales Channel, 2019 to 2034
Table 40: South Jeolla Industry Analysis and Outlook Volume (Units) Forecast by Sales Channel, 2019 to 2034
Table 41: South Jeolla Industry Analysis and Outlook Value (US$ Million) Forecast by End Use, 2019 to 2034
Table 42: South Jeolla Industry Analysis and Outlook Volume (Units) Forecast by End Use, 2019 to 2034
Table 43: Jeju Industry Analysis and Outlook Value (US$ Million) Forecast by Product Type, 2019 to 2034
Table 44: Jeju Industry Analysis and Outlook Volume (Units) Forecast by Product Type, 2019 to 2034
Table 45: Jeju Industry Analysis and Outlook Value (US$ Million) Forecast by Fabrication Process, 2019 to 2034
Table 46: Jeju Industry Analysis and Outlook Volume (Units) Forecast by Fabrication Process, 2019 to 2034
Table 47: Jeju Industry Analysis and Outlook Value (US$ Million) Forecast by Cutlery Type, 2019 to 2034
Table 48: Jeju Industry Analysis and Outlook Volume (Units) Forecast by Cutlery Type, 2019 to 2034
Table 49: Jeju Industry Analysis and Outlook Value (US$ Million) Forecast by Sales Channel, 2019 to 2034
Table 50: Jeju Industry Analysis and Outlook Volume (Units) Forecast by Sales Channel, 2019 to 2034
Table 51: Jeju Industry Analysis and Outlook Value (US$ Million) Forecast by End Use, 2019 to 2034
Table 52: Jeju Industry Analysis and Outlook Volume (Units) Forecast by End Use, 2019 to 2034
Table 53: Rest of Korea Industry Analysis and Outlook Value (US$ Million) Forecast by Product Type, 2019 to 2034
Table 54: Rest of Korea Industry Analysis and Outlook Volume (Units) Forecast by Product Type, 2019 to 2034
Table 55: Rest of Korea Industry Analysis and Outlook Value (US$ Million) Forecast by Fabrication Process, 2019 to 2034
Table 56: Rest of Korea Industry Analysis and Outlook Volume (Units) Forecast by Fabrication Process, 2019 to 2034
Table 57: Rest of Korea Industry Analysis and Outlook Value (US$ Million) Forecast by Cutlery Type, 2019 to 2034
Table 58: Rest of Korea Industry Analysis and Outlook Volume (Units) Forecast by Cutlery Type, 2019 to 2034
Table 59: Rest of Korea Industry Analysis and Outlook Value (US$ Million) Forecast by Sales Channel, 2019 to 2034
Table 60: Rest of Korea Industry Analysis and Outlook Volume (Units) Forecast by Sales Channel, 2019 to 2034
Table 61: Rest of Korea Industry Analysis and Outlook Value (US$ Million) Forecast by End Use, 2019 to 2034
Table 62: Rest of Korea Industry Analysis and Outlook Volume (Units) Forecast by End Use, 2019 to 2034
Figure 1: Korea Industry Analysis and Outlook Value (US$ Million) by Product Type, 2024 to 2034
Figure 2: Korea Industry Analysis and Outlook Value (US$ Million) by Fabrication Process, 2024 to 2034
Figure 3: Korea Industry Analysis and Outlook Value (US$ Million) by Cutlery Type, 2024 to 2034
Figure 4: Korea Industry Analysis and Outlook Value (US$ Million) by Sales Channel, 2024 to 2034
Figure 5: Korea Industry Analysis and Outlook Value (US$ Million) by End Use, 2024 to 2034
Figure 6: Korea Industry Analysis and Outlook Value (US$ Million) by Region, 2024 to 2034
Figure 7: Korea Industry Analysis and Outlook Value (US$ Million) Analysis by Region, 2019 to 2034
Figure 8: Korea Industry Analysis and Outlook Volume (Units) Analysis by Region, 2019 to 2034
Figure 9: Korea Industry Analysis and Outlook Value Share (%) and BPS Analysis by Region, 2024 to 2034
Figure 10: Korea Industry Analysis and Outlook Y-o-Y Growth (%) Projections by Region, 2024 to 2034
Figure 11: Korea Industry Analysis and Outlook Value (US$ Million) Analysis by Product Type, 2019 to 2034
Figure 12: Korea Industry Analysis and Outlook Volume (Units) Analysis by Product Type, 2019 to 2034
Figure 13: Korea Industry Analysis and Outlook Value Share (%) and BPS Analysis by Product Type, 2024 to 2034
Figure 14: Korea Industry Analysis and Outlook Y-o-Y Growth (%) Projections by Product Type, 2024 to 2034
Figure 15: Korea Industry Analysis and Outlook Value (US$ Million) Analysis by Fabrication Process, 2019 to 2034
Figure 16: Korea Industry Analysis and Outlook Volume (Units) Analysis by Fabrication Process, 2019 to 2034
Figure 17: Korea Industry Analysis and Outlook Value Share (%) and BPS Analysis by Fabrication Process, 2024 to 2034
Figure 18: Korea Industry Analysis and Outlook Y-o-Y Growth (%) Projections by Fabrication Process, 2024 to 2034
Figure 19: Korea Industry Analysis and Outlook Value (US$ Million) Analysis by Cutlery Type, 2019 to 2034
Figure 20: Korea Industry Analysis and Outlook Volume (Units) Analysis by Cutlery Type, 2019 to 2034
Figure 21: Korea Industry Analysis and Outlook Value Share (%) and BPS Analysis by Cutlery Type, 2024 to 2034
Figure 22: Korea Industry Analysis and Outlook Y-o-Y Growth (%) Projections by Cutlery Type, 2024 to 2034
Figure 23: Korea Industry Analysis and Outlook Value (US$ Million) Analysis by Sales Channel, 2019 to 2034
Figure 24: Korea Industry Analysis and Outlook Volume (Units) Analysis by Sales Channel, 2019 to 2034
Figure 25: Korea Industry Analysis and Outlook Value Share (%) and BPS Analysis by Sales Channel, 2024 to 2034
Figure 26: Korea Industry Analysis and Outlook Y-o-Y Growth (%) Projections by Sales Channel, 2024 to 2034
Figure 27: Korea Industry Analysis and Outlook Value (US$ Million) Analysis by End Use, 2019 to 2034
Figure 28: Korea Industry Analysis and Outlook Volume (Units) Analysis by End Use, 2019 to 2034
Figure 29: Korea Industry Analysis and Outlook Value Share (%) and BPS Analysis by End Use, 2024 to 2034
Figure 30: Korea Industry Analysis and Outlook Y-o-Y Growth (%) Projections by End Use, 2024 to 2034
Figure 31: Korea Industry Analysis and Outlook Attractiveness by Product Type, 2024 to 2034
Figure 32: Korea Industry Analysis and Outlook Attractiveness by Fabrication Process, 2024 to 2034
Figure 33: Korea Industry Analysis and Outlook Attractiveness by Cutlery Type, 2024 to 2034
Figure 34: Korea Industry Analysis and Outlook Attractiveness by Sales Channel, 2024 to 2034
Figure 35: Korea Industry Analysis and Outlook Attractiveness by End Use, 2024 to 2034
Figure 36: Korea Industry Analysis and Outlook Attractiveness by Region, 2024 to 2034
Figure 37: South Gyeongsang Industry Analysis and Outlook Value (US$ Million) by Product Type, 2024 to 2034
Figure 38: South Gyeongsang Industry Analysis and Outlook Value (US$ Million) by Fabrication Process, 2024 to 2034
Figure 39: South Gyeongsang Industry Analysis and Outlook Value (US$ Million) by Cutlery Type, 2024 to 2034
Figure 40: South Gyeongsang Industry Analysis and Outlook Value (US$ Million) by Sales Channel, 2024 to 2034
Figure 41: South Gyeongsang Industry Analysis and Outlook Value (US$ Million) by End Use, 2024 to 2034
Figure 42: South Gyeongsang Industry Analysis and Outlook Value (US$ Million) Analysis by Product Type, 2019 to 2034
Figure 43: South Gyeongsang Industry Analysis and Outlook Volume (Units) Analysis by Product Type, 2019 to 2034
Figure 44: South Gyeongsang Industry Analysis and Outlook Value Share (%) and BPS Analysis by Product Type, 2024 to 2034
Figure 45: South Gyeongsang Industry Analysis and Outlook Y-o-Y Growth (%) Projections by Product Type, 2024 to 2034
Figure 46: South Gyeongsang Industry Analysis and Outlook Value (US$ Million) Analysis by Fabrication Process, 2019 to 2034
Figure 47: South Gyeongsang Industry Analysis and Outlook Volume (Units) Analysis by Fabrication Process, 2019 to 2034
Figure 48: South Gyeongsang Industry Analysis and Outlook Value Share (%) and BPS Analysis by Fabrication Process, 2024 to 2034
Figure 49: South Gyeongsang Industry Analysis and Outlook Y-o-Y Growth (%) Projections by Fabrication Process, 2024 to 2034
Figure 50: South Gyeongsang Industry Analysis and Outlook Value (US$ Million) Analysis by Cutlery Type, 2019 to 2034
Figure 51: South Gyeongsang Industry Analysis and Outlook Volume (Units) Analysis by Cutlery Type, 2019 to 2034
Figure 52: South Gyeongsang Industry Analysis and Outlook Value Share (%) and BPS Analysis by Cutlery Type, 2024 to 2034
Figure 53: South Gyeongsang Industry Analysis and Outlook Y-o-Y Growth (%) Projections by Cutlery Type, 2024 to 2034
Figure 54: South Gyeongsang Industry Analysis and Outlook Value (US$ Million) Analysis by Sales Channel, 2019 to 2034
Figure 55: South Gyeongsang Industry Analysis and Outlook Volume (Units) Analysis by Sales Channel, 2019 to 2034
Figure 56: South Gyeongsang Industry Analysis and Outlook Value Share (%) and BPS Analysis by Sales Channel, 2024 to 2034
Figure 57: South Gyeongsang Industry Analysis and Outlook Y-o-Y Growth (%) Projections by Sales Channel, 2024 to 2034
Figure 58: South Gyeongsang Industry Analysis and Outlook Value (US$ Million) Analysis by End Use, 2019 to 2034
Figure 59: South Gyeongsang Industry Analysis and Outlook Volume (Units) Analysis by End Use, 2019 to 2034
Figure 60: South Gyeongsang Industry Analysis and Outlook Value Share (%) and BPS Analysis by End Use, 2024 to 2034
Figure 61: South Gyeongsang Industry Analysis and Outlook Y-o-Y Growth (%) Projections by End Use, 2024 to 2034
Figure 62: South Gyeongsang Industry Analysis and Outlook Attractiveness by Product Type, 2024 to 2034
Figure 63: South Gyeongsang Industry Analysis and Outlook Attractiveness by Fabrication Process, 2024 to 2034
Figure 64: South Gyeongsang Industry Analysis and Outlook Attractiveness by Cutlery Type, 2024 to 2034
Figure 65: South Gyeongsang Industry Analysis and Outlook Attractiveness by Sales Channel, 2024 to 2034
Figure 66: South Gyeongsang Industry Analysis and Outlook Attractiveness by End Use, 2024 to 2034
Figure 67: North Jeolla Industry Analysis and Outlook Value (US$ Million) by Product Type, 2024 to 2034
Figure 68: North Jeolla Industry Analysis and Outlook Value (US$ Million) by Fabrication Process, 2024 to 2034
Figure 69: North Jeolla Industry Analysis and Outlook Value (US$ Million) by Cutlery Type, 2024 to 2034
Figure 70: North Jeolla Industry Analysis and Outlook Value (US$ Million) by Sales Channel, 2024 to 2034
Figure 71: North Jeolla Industry Analysis and Outlook Value (US$ Million) by End Use, 2024 to 2034
Figure 72: North Jeolla Industry Analysis and Outlook Value (US$ Million) Analysis by Product Type, 2019 to 2034
Figure 73: North Jeolla Industry Analysis and Outlook Volume (Units) Analysis by Product Type, 2019 to 2034
Figure 74: North Jeolla Industry Analysis and Outlook Value Share (%) and BPS Analysis by Product Type, 2024 to 2034
Figure 75: North Jeolla Industry Analysis and Outlook Y-o-Y Growth (%) Projections by Product Type, 2024 to 2034
Figure 76: North Jeolla Industry Analysis and Outlook Value (US$ Million) Analysis by Fabrication Process, 2019 to 2034
Figure 77: North Jeolla Industry Analysis and Outlook Volume (Units) Analysis by Fabrication Process, 2019 to 2034
Figure 78: North Jeolla Industry Analysis and Outlook Value Share (%) and BPS Analysis by Fabrication Process, 2024 to 2034
Figure 79: North Jeolla Industry Analysis and Outlook Y-o-Y Growth (%) Projections by Fabrication Process, 2024 to 2034
Figure 80: North Jeolla Industry Analysis and Outlook Value (US$ Million) Analysis by Cutlery Type, 2019 to 2034
Figure 81: North Jeolla Industry Analysis and Outlook Volume (Units) Analysis by Cutlery Type, 2019 to 2034
Figure 82: North Jeolla Industry Analysis and Outlook Value Share (%) and BPS Analysis by Cutlery Type, 2024 to 2034
Figure 83: North Jeolla Industry Analysis and Outlook Y-o-Y Growth (%) Projections by Cutlery Type, 2024 to 2034
Figure 84: North Jeolla Industry Analysis and Outlook Value (US$ Million) Analysis by Sales Channel, 2019 to 2034
Figure 85: North Jeolla Industry Analysis and Outlook Volume (Units) Analysis by Sales Channel, 2019 to 2034
Figure 86: North Jeolla Industry Analysis and Outlook Value Share (%) and BPS Analysis by Sales Channel, 2024 to 2034
Figure 87: North Jeolla Industry Analysis and Outlook Y-o-Y Growth (%) Projections by Sales Channel, 2024 to 2034
Figure 88: North Jeolla Industry Analysis and Outlook Value (US$ Million) Analysis by End Use, 2019 to 2034
Figure 89: North Jeolla Industry Analysis and Outlook Volume (Units) Analysis by End Use, 2019 to 2034
Figure 90: North Jeolla Industry Analysis and Outlook Value Share (%) and BPS Analysis by End Use, 2024 to 2034
Figure 91: North Jeolla Industry Analysis and Outlook Y-o-Y Growth (%) Projections by End Use, 2024 to 2034
Figure 92: North Jeolla Industry Analysis and Outlook Attractiveness by Product Type, 2024 to 2034
Figure 93: North Jeolla Industry Analysis and Outlook Attractiveness by Fabrication Process, 2024 to 2034
Figure 94: North Jeolla Industry Analysis and Outlook Attractiveness by Cutlery Type, 2024 to 2034
Figure 95: North Jeolla Industry Analysis and Outlook Attractiveness by Sales Channel, 2024 to 2034
Figure 96: North Jeolla Industry Analysis and Outlook Attractiveness by End Use, 2024 to 2034
Figure 97: South Jeolla Industry Analysis and Outlook Value (US$ Million) by Product Type, 2024 to 2034
Figure 98: South Jeolla Industry Analysis and Outlook Value (US$ Million) by Fabrication Process, 2024 to 2034
Figure 99: South Jeolla Industry Analysis and Outlook Value (US$ Million) by Cutlery Type, 2024 to 2034
Figure 100: South Jeolla Industry Analysis and Outlook Value (US$ Million) by Sales Channel, 2024 to 2034
Figure 101: South Jeolla Industry Analysis and Outlook Value (US$ Million) by End Use, 2024 to 2034
Figure 102: South Jeolla Industry Analysis and Outlook Value (US$ Million) Analysis by Product Type, 2019 to 2034
Figure 103: South Jeolla Industry Analysis and Outlook Volume (Units) Analysis by Product Type, 2019 to 2034
Figure 104: South Jeolla Industry Analysis and Outlook Value Share (%) and BPS Analysis by Product Type, 2024 to 2034
Figure 105: South Jeolla Industry Analysis and Outlook Y-o-Y Growth (%) Projections by Product Type, 2024 to 2034
Figure 106: South Jeolla Industry Analysis and Outlook Value (US$ Million) Analysis by Fabrication Process, 2019 to 2034
Figure 107: South Jeolla Industry Analysis and Outlook Volume (Units) Analysis by Fabrication Process, 2019 to 2034
Figure 108: South Jeolla Industry Analysis and Outlook Value Share (%) and BPS Analysis by Fabrication Process, 2024 to 2034
Figure 109: South Jeolla Industry Analysis and Outlook Y-o-Y Growth (%) Projections by Fabrication Process, 2024 to 2034
Figure 110: South Jeolla Industry Analysis and Outlook Value (US$ Million) Analysis by Cutlery Type, 2019 to 2034
Figure 111: South Jeolla Industry Analysis and Outlook Volume (Units) Analysis by Cutlery Type, 2019 to 2034
Figure 112: South Jeolla Industry Analysis and Outlook Value Share (%) and BPS Analysis by Cutlery Type, 2024 to 2034
Figure 113: South Jeolla Industry Analysis and Outlook Y-o-Y Growth (%) Projections by Cutlery Type, 2024 to 2034
Figure 114: South Jeolla Industry Analysis and Outlook Value (US$ Million) Analysis by Sales Channel, 2019 to 2034
Figure 115: South Jeolla Industry Analysis and Outlook Volume (Units) Analysis by Sales Channel, 2019 to 2034
Figure 116: South Jeolla Industry Analysis and Outlook Value Share (%) and BPS Analysis by Sales Channel, 2024 to 2034
Figure 117: South Jeolla Industry Analysis and Outlook Y-o-Y Growth (%) Projections by Sales Channel, 2024 to 2034
Figure 118: South Jeolla Industry Analysis and Outlook Value (US$ Million) Analysis by End Use, 2019 to 2034
Figure 119: South Jeolla Industry Analysis and Outlook Volume (Units) Analysis by End Use, 2019 to 2034
Figure 120: South Jeolla Industry Analysis and Outlook Value Share (%) and BPS Analysis by End Use, 2024 to 2034
Figure 121: South Jeolla Industry Analysis and Outlook Y-o-Y Growth (%) Projections by End Use, 2024 to 2034
Figure 122: South Jeolla Industry Analysis and Outlook Attractiveness by Product Type, 2024 to 2034
Figure 123: South Jeolla Industry Analysis and Outlook Attractiveness by Fabrication Process, 2024 to 2034
Figure 124: South Jeolla Industry Analysis and Outlook Attractiveness by Cutlery Type, 2024 to 2034
Figure 125: South Jeolla Industry Analysis and Outlook Attractiveness by Sales Channel, 2024 to 2034
Figure 126: South Jeolla Industry Analysis and Outlook Attractiveness by End Use, 2024 to 2034
Figure 127: Jeju Industry Analysis and Outlook Value (US$ Million) by Product Type, 2024 to 2034
Figure 128: Jeju Industry Analysis and Outlook Value (US$ Million) by Fabrication Process, 2024 to 2034
Figure 129: Jeju Industry Analysis and Outlook Value (US$ Million) by Cutlery Type, 2024 to 2034
Figure 130: Jeju Industry Analysis and Outlook Value (US$ Million) by Sales Channel, 2024 to 2034
Figure 131: Jeju Industry Analysis and Outlook Value (US$ Million) by End Use, 2024 to 2034
Figure 132: Jeju Industry Analysis and Outlook Value (US$ Million) Analysis by Product Type, 2019 to 2034
Figure 133: Jeju Industry Analysis and Outlook Volume (Units) Analysis by Product Type, 2019 to 2034
Figure 134: Jeju Industry Analysis and Outlook Value Share (%) and BPS Analysis by Product Type, 2024 to 2034
Figure 135: Jeju Industry Analysis and Outlook Y-o-Y Growth (%) Projections by Product Type, 2024 to 2034
Figure 136: Jeju Industry Analysis and Outlook Value (US$ Million) Analysis by Fabrication Process, 2019 to 2034
Figure 137: Jeju Industry Analysis and Outlook Volume (Units) Analysis by Fabrication Process, 2019 to 2034
Figure 138: Jeju Industry Analysis and Outlook Value Share (%) and BPS Analysis by Fabrication Process, 2024 to 2034
Figure 139: Jeju Industry Analysis and Outlook Y-o-Y Growth (%) Projections by Fabrication Process, 2024 to 2034
Figure 140: Jeju Industry Analysis and Outlook Value (US$ Million) Analysis by Cutlery Type, 2019 to 2034
Figure 141: Jeju Industry Analysis and Outlook Volume (Units) Analysis by Cutlery Type, 2019 to 2034
Figure 142: Jeju Industry Analysis and Outlook Value Share (%) and BPS Analysis by Cutlery Type, 2024 to 2034
Figure 143: Jeju Industry Analysis and Outlook Y-o-Y Growth (%) Projections by Cutlery Type, 2024 to 2034
Figure 144: Jeju Industry Analysis and Outlook Value (US$ Million) Analysis by Sales Channel, 2019 to 2034
Figure 145: Jeju Industry Analysis and Outlook Volume (Units) Analysis by Sales Channel, 2019 to 2034
Figure 146: Jeju Industry Analysis and Outlook Value Share (%) and BPS Analysis by Sales Channel, 2024 to 2034
Figure 147: Jeju Industry Analysis and Outlook Y-o-Y Growth (%) Projections by Sales Channel, 2024 to 2034
Figure 148: Jeju Industry Analysis and Outlook Value (US$ Million) Analysis by End Use, 2019 to 2034
Figure 149: Jeju Industry Analysis and Outlook Volume (Units) Analysis by End Use, 2019 to 2034
Figure 150: Jeju Industry Analysis and Outlook Value Share (%) and BPS Analysis by End Use, 2024 to 2034
Figure 151: Jeju Industry Analysis and Outlook Y-o-Y Growth (%) Projections by End Use, 2024 to 2034
Figure 152: Jeju Industry Analysis and Outlook Attractiveness by Product Type, 2024 to 2034
Figure 153: Jeju Industry Analysis and Outlook Attractiveness by Fabrication Process, 2024 to 2034
Figure 154: Jeju Industry Analysis and Outlook Attractiveness by Cutlery Type, 2024 to 2034
Figure 155: Jeju Industry Analysis and Outlook Attractiveness by Sales Channel, 2024 to 2034
Figure 156: Jeju Industry Analysis and Outlook Attractiveness by End Use, 2024 to 2034
Figure 157: Rest of Korea Industry Analysis and Outlook Value (US$ Million) by Product Type, 2024 to 2034
Figure 158: Rest of Korea Industry Analysis and Outlook Value (US$ Million) by Fabrication Process, 2024 to 2034
Figure 159: Rest of Korea Industry Analysis and Outlook Value (US$ Million) by Cutlery Type, 2024 to 2034
Figure 160: Rest of Korea Industry Analysis and Outlook Value (US$ Million) by Sales Channel, 2024 to 2034
Figure 161: Rest of Korea Industry Analysis and Outlook Value (US$ Million) by End Use, 2024 to 2034
Figure 162: Rest of Korea Industry Analysis and Outlook Value (US$ Million) Analysis by Product Type, 2019 to 2034
Figure 163: Rest of Korea Industry Analysis and Outlook Volume (Units) Analysis by Product Type, 2019 to 2034
Figure 164: Rest of Korea Industry Analysis and Outlook Value Share (%) and BPS Analysis by Product Type, 2024 to 2034
Figure 165: Rest of Korea Industry Analysis and Outlook Y-o-Y Growth (%) Projections by Product Type, 2024 to 2034
Figure 166: Rest of Korea Industry Analysis and Outlook Value (US$ Million) Analysis by Fabrication Process, 2019 to 2034
Figure 167: Rest of Korea Industry Analysis and Outlook Volume (Units) Analysis by Fabrication Process, 2019 to 2034
Figure 168: Rest of Korea Industry Analysis and Outlook Value Share (%) and BPS Analysis by Fabrication Process, 2024 to 2034
Figure 169: Rest of Korea Industry Analysis and Outlook Y-o-Y Growth (%) Projections by Fabrication Process, 2024 to 2034
Figure 170: Rest of Korea Industry Analysis and Outlook Value (US$ Million) Analysis by Cutlery Type, 2019 to 2034
Figure 171: Rest of Korea Industry Analysis and Outlook Volume (Units) Analysis by Cutlery Type, 2019 to 2034
Figure 172: Rest of Korea Industry Analysis and Outlook Value Share (%) and BPS Analysis by Cutlery Type, 2024 to 2034
Figure 173: Rest of Korea Industry Analysis and Outlook Y-o-Y Growth (%) Projections by Cutlery Type, 2024 to 2034
Figure 174: Rest of Korea Industry Analysis and Outlook Value (US$ Million) Analysis by Sales Channel, 2019 to 2034
Figure 175: Rest of Korea Industry Analysis and Outlook Volume (Units) Analysis by Sales Channel, 2019 to 2034
Figure 176: Rest of Korea Industry Analysis and Outlook Value Share (%) and BPS Analysis by Sales Channel, 2024 to 2034
Figure 177: Rest of Korea Industry Analysis and Outlook Y-o-Y Growth (%) Projections by Sales Channel, 2024 to 2034
Figure 178: Rest of Korea Industry Analysis and Outlook Value (US$ Million) Analysis by End Use, 2019 to 2034
Figure 179: Rest of Korea Industry Analysis and Outlook Volume (Units) Analysis by End Use, 2019 to 2034
Figure 180: Rest of Korea Industry Analysis and Outlook Value Share (%) and BPS Analysis by End Use, 2024 to 2034
Figure 181: Rest of Korea Industry Analysis and Outlook Y-o-Y Growth (%) Projections by End Use, 2024 to 2034
Figure 182: Rest of Korea Industry Analysis and Outlook Attractiveness by Product Type, 2024 to 2034
Figure 183: Rest of Korea Industry Analysis and Outlook Attractiveness by Fabrication Process, 2024 to 2034
Figure 184: Rest of Korea Industry Analysis and Outlook Attractiveness by Cutlery Type, 2024 to 2034
Figure 185: Rest of Korea Industry Analysis and Outlook Attractiveness by Sales Channel, 2024 to 2034
Figure 186: Rest of Korea Industry Analysis and Outlook Attractiveness by End Use, 2024 to 2034
By 2024, the estimated valuation of the disposable cutlery industry is USD 27.8 million in value terms.
The anticipated CAGR for the disposable cutlery ecosystem through 2034 is 6.1%.
By 2034, the demand for the disposable cutlery industry will reach USD 50.5 million.
Spoon is estimated to surpass the valuation of the on-premise model soon.
From 2019 to 2023, the industrial valuation rose to a CAGR of 3.1%.
Explore Similar Insights
Thank you!
You will receive an email from our Business Development Manager. Please be sure to check your SPAM/JUNK folder too.