Sales of banana flour in Japan are estimated at USD 9.1 million in 2025 and are projected to reach USD 16.3 million by 2035, reflecting a CAGR of approximately 6.0% over the forecast period. This growth reflects both a broadening consumer base and increased per capita consumption across key regions. The rise in demand is linked to shifting dietary preferences, growing health consciousness, and evolving food preparation trends.
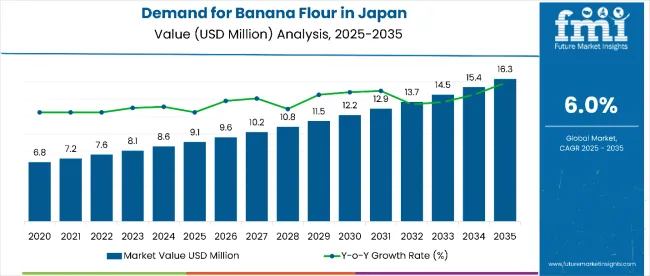
Metric Value
| Metric | Value |
|---|---|
| Estimated Value in (2025E) | USD 9.1 million |
| Forecast Value in (2035F) | USD 16.3 million |
| Forecast CAGR (2025 to 2035) | 6.0% |
By 2025, per capita consumption in leading Japanese regions such as Kanto, Chubu, and Kinki averages between 0.8 to 1.2 kilograms, with projections reaching 1.4 to 1.8 kilograms by 2035. Kanto leads among regions, expected to generate USD 3.8 million in banana flour sales by 2035, followed by Chubu (USD 3.2 million), Kinki (USD 2.9 million), Kyushu & Okinawa (USD 2.7 million), and Tohoku (USD 2.1 million).
The largest contribution to demand continues to come from conventional banana flour processing, which is expected to account for 95.30% of total sales in 2025 owing to established supply chains, cost-effectiveness, and manufacturer familiarity. By application, the food segment represents the dominant usage format, responsible for 70.40% of all sales, while pet food and household applications are expanding steadily.
Consumer adoption is particularly concentrated among health-conscious urban families and gluten-free diet followers, with income and dietary awareness emerging as significant drivers of demand. While price remains a consideration, the average cost differential between banana flour and traditional wheat flour has stabilized at approximately 15-20% premium in 2025.
Continued improvements in processing efficiency and distribution networks are expected to accelerate accessibility across mid-income households. Regional disparities persist, but per capita demand in emerging regions is narrowing the gap with traditionally strong urban centers.
The banana flour segment in Japan is classified into several categories. By source, the key classifications include conventional and organic processing methods. By application, the segment spans food applications (bakery & snacks, infant food, fillings & dressings, soups and sauces), beverages, pet food and feed industry, and household usage.
By distribution channel, the segment covers direct sales, and indirect sales includes modern trade, convenience stores, specialty stores, e-retailers, and other retail formats. By region, areas such as Kanto, Chubu, Kinki, Kyushu & Okinawa, and Tohoku, and the rest of Japan.
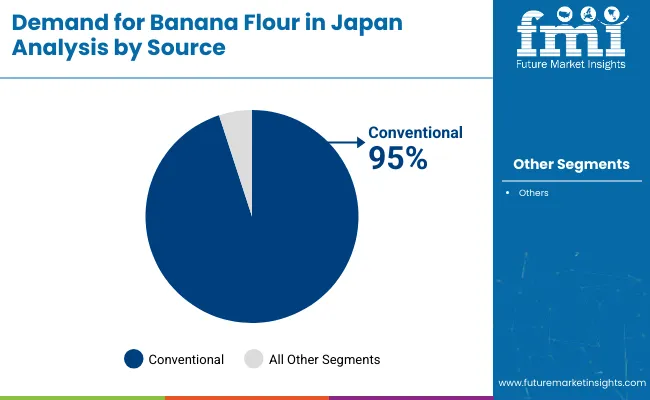
Conventional banana flour processing is projected to dominate sales in 2025, supported by established supply chains, cost-effectiveness, and widespread manufacturer adoption. Organic processing methods are growing steadily but remain niche, serving distinct consumer preferences.
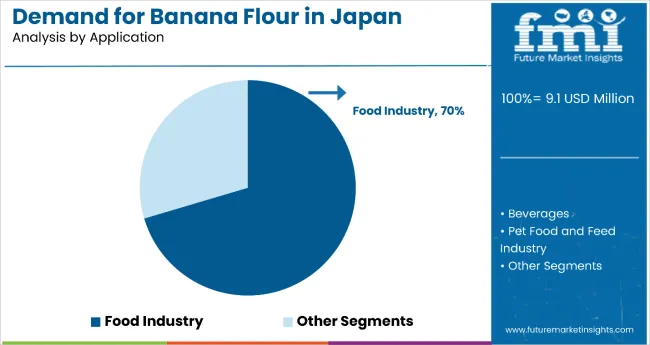
Banana flour applications in Japan are distributed across multiple end-use segments. The food segment dominates consumption patterns, followed by specialized applications in beverages, pet food, and household usage. Application strategies are evolving to match consumer preferences and manufacturing requirements.
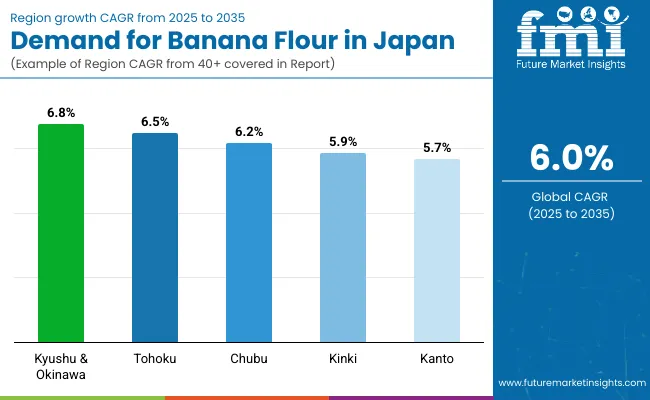
In the Demand and Trend Analysis of banana flour in Japan, Kyushu & Okinawa leads with the highest CAGR of 6.8%, driven by tropical banana cultivation, integration into local cuisine, and tourism-driven food innovations. Tohoku follows with 6.5%, benefiting from agricultural diversification and community-led initiatives promoting banana flour adoption.
Chubu posts 6.2% growth, leveraging its industrial food manufacturing base, ethical sourcing, and strategic distribution links. Kinki, with a CAGR of 5.9%, stands out for artisanal and fusion culinary innovations rooted in its rich food culture. Kanto, the largest consumption hub, records 5.7% growth, fueled by its vast retail presence, premium product demand, and trendsetting culinary scene.
| Region | CAGR (2025 to 2035) |
|---|---|
| Kyushu & Okinawa | 6.8% |
| Tohoku | 6.5% |
| Chubu | 6.2% |
| Kinki | 5.9% |
| Kanto | 5.7% |
Kyushu & Okinawa banana flour in Japan leads with the highest CAGR of 6.8%, showcasing strong integration of banana flour into local cuisines and tourism-related food products. The region’s tropical climate supports niche banana cultivation, enabling shorter supply chains and fresher inputs for flour production.
Local bakeries and snack manufacturers are experimenting with gluten-free recipes, increasing consumer interest. Tourism-driven food souvenirs using banana flour are becoming popular. The government’s push for regional food innovation matches healthier eating habits. Distribution channels are expanding beyond specialty stores into mainstream supermarkets. Culinary festivals often showcase banana flour products, boosting awareness.
Revenue from banana flour in Tohoku is expanding rapidly at a CAGR of 6.5%, fueled by agricultural diversification and the region’s focus on food self-sufficiency. Local cooperatives are partnering with manufacturers to introduce banana flour into everyday staples. The region’s cold climate makes banana flour an appealing alternative for gluten-free baking in winter months.
Educational campaigns about the nutritional value of banana flour are increasing consumer awareness. Government-backed rural revitalization programs are encouraging farmers to explore niche crops like bananas for flour production. Availability in regional supermarkets is steadily improving. Specialty cafés and restaurants are incorporating banana flour into desserts and breads.
Demand for banana flour in Chubu is projected to grow at a CAGR of 6.2%, benefiting from the region’s strong industrial food manufacturing base and efficient logistics infrastructure. Banana flour production here is supported by ethical sourcing strategies, attracting conscious consumers. The region’s bakeries and confectionery producers are introducing banana flour-based cakes, noodles, and snack bars.
Partnerships between local producers and national food brands are improving supply stability. Chubu’s strategic location enables rapid distribution to both eastern and western Japan. Demand is supported by both household use and commercial applications. Eco-labeling on banana flour products is gaining popularity, appealing to premium buyers. As health-focused trends strengthen, Chubu is positioned for continued relevance in the national supply chain.
Sales of banana flour in Kinki, growing at a CAGR of 5.9%, are leveraging the region’s culinary heritage to integrate banana flour into both traditional and modern dishes. Osaka and Kyoto serve as hubs for artisanal food innovation, producing gluten-free banana flour snacks and baked goods. Upscale restaurants are experimenting with banana flour-based tempura and desserts.
Urban consumers in Kinki are willing to pay a premium for healthier, locally sourced products. Banana flour is finding a role in fusion cooking, blending Japanese and Western styles. The regional foodservice sector is a significant driver of demand. Specialty health stores are increasing shelf space for banana flour brands. Cultural emphasis on artisanal quality supports long-term consumer loyalty.
Sales of banana flour in Kanto are expected to grow at a CAGR of 5.7%, making it the largest consumption hub in Japan, anchored by Tokyo’s dense population and diverse culinary scene. The region has extensive retail penetration, with banana flour widely available in supermarkets, hypermarkets, and online platforms. Kanto’s foodservice sector is incorporating banana flour into both Japanese and international cuisine.
Higher incomes allow consumers to purchase premium and organic varieties. Cooking shows and digital influencers are popularizing banana flour recipes, boosting household adoption. Fusion restaurants are adding banana flour-based pasta, pancakes, and tempura to menus. Convenience stores are stocking banana flour snacks, expanding reach to everyday shoppers. The region’s scale ensures it remains a national trendsetter.
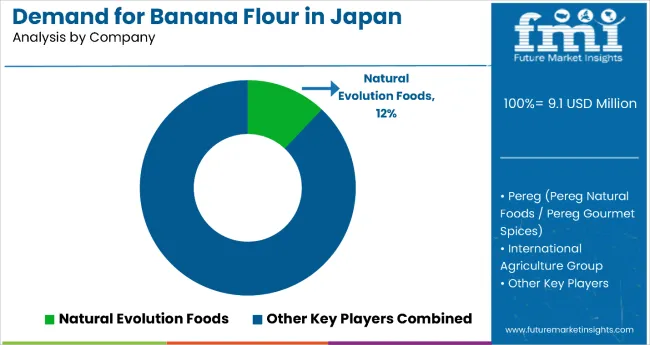
The competitive environment combines established ingredient suppliers with specialized health food manufacturers. Distribution reach and product quality consistency remain decisive factors, with leading suppliers maintaining wide retail networks and commercial customer relationships across Japan.
Natural Evolution participates actively in the banana flour segment, offering organic and conventional products with an emphasis on certification and quality assurance. The company maintains strong relationships with health food retailers and specialty stores while moving into mainstream retail.
Kyowa Hakko Bio Co., Ltd. applies biotechnology expertise to banana flour processing, focusing on nutritional enhancement and functional ingredient development for food manufacturing. Taiyo Kagaku Co., Ltd. uses advanced processing technology to ensure consistent quality for industrial applications, serving manufacturers requiring standardized specifications. Private label programs at major retailers such as Aeon (Topvalu) and Seven & i Holdings (Seven Premium) are expanding banana flour accessibility, putting competitive pressure on branded suppliers.
Key Developments
| Items | Values |
|---|---|
| Market Size (2025) | USD 9.1 Million |
| By Source | Organic and Conventional |
| By Application | Beverages, Pet Food & Feed Industry, Household, and Food Industry (Bakery & Snacks, Infant Food, Fillings & Dressings, Soups & Sauces, and Others) |
| Distribution Channel | Direc and, Indirect (Modern Trade, Convenience Store, Specialty Store, E-Retailers, nd Other Retail Format) |
| Regions Covered | Kyushu & Okinawa, Tohoku, Chubu, Kinki, Kanto, Chugoku, Shikoku, and Hokkaido |
| Top Companies Profiled | Natural Evolution, NuNatural Inc., NOW Health Group Inc., Ceres Enterprises Ltd, Diana Foods, International Agriculture Group, ADM Wild Europe GmbH & Co., KADAC Pty Ltd, Zuvii, and Kaffa Int Co., Ltd. |
| Additional Attributes | Rising demand for gluten-free and functional flours, increasing integration into traditional and fusion cuisine, growing retail and e-commerce penetration, expanding applications in bakery, snacks, and infant food, emphasis on health and sustainability trends |
In 2025, the total sales of banana flour in Japan will be valued at USD 9.1 million.
By 2035, the sales of banana flour in Japan are forecasted to reach USD 16.3 million, reflecting a CAGR of 6.0%.
The banana flour market in Japan is expected to grow at a CAGR of 6.0% between 2025 and 2035.
Conventional processing is projected to lead the source segment with a 95.30% share in 2025.
The food segment is expected to dominate the application segment with a 70.40% share in 2025.


Our Research Products

The "Full Research Suite" delivers actionable market intel, deep dives on markets or technologies, so clients act faster, cut risk, and unlock growth.

The Leaderboard benchmarks and ranks top vendors, classifying them as Established Leaders, Leading Challengers, or Disruptors & Challengers.

Locates where complements amplify value and substitutes erode it, forecasting net impact by horizon

We deliver granular, decision-grade intel: market sizing, 5-year forecasts, pricing, adoption, usage, revenue, and operational KPIs—plus competitor tracking, regulation, and value chains—across 60 countries broadly.

Spot the shifts before they hit your P&L. We track inflection points, adoption curves, pricing moves, and ecosystem plays to show where demand is heading, why it is changing, and what to do next across high-growth markets and disruptive tech

Real-time reads of user behavior. We track shifting priorities, perceptions of today’s and next-gen services, and provider experience, then pace how fast tech moves from trial to adoption, blending buyer, consumer, and channel inputs with social signals (#WhySwitch, #UX).

Partner with our analyst team to build a custom report designed around your business priorities. From analysing market trends to assessing competitors or crafting bespoke datasets, we tailor insights to your needs.
Supplier Intelligence
Discovery & Profiling
Capacity & Footprint
Performance & Risk
Compliance & Governance
Commercial Readiness
Who Supplies Whom
Scorecards & Shortlists
Playbooks & Docs
Category Intelligence
Definition & Scope
Demand & Use Cases
Cost Drivers
Market Structure
Supply Chain Map
Trade & Policy
Operating Norms
Deliverables
Buyer Intelligence
Account Basics
Spend & Scope
Procurement Model
Vendor Requirements
Terms & Policies
Entry Strategy
Pain Points & Triggers
Outputs
Pricing Analysis
Benchmarks
Trends
Should-Cost
Indexation
Landed Cost
Commercial Terms
Deliverables
Brand Analysis
Positioning & Value Prop
Share & Presence
Customer Evidence
Go-to-Market
Digital & Reputation
Compliance & Trust
KPIs & Gaps
Outputs
Full Research Suite comprises of:
Market outlook & trends analysis
Interviews & case studies
Strategic recommendations
Vendor profiles & capabilities analysis
5-year forecasts
8 regions and 60+ country-level data splits
Market segment data splits
12 months of continuous data updates
DELIVERED AS:
PDF EXCEL ONLINE
Demand Signal Repository Solutions Market Size and Share Forecast Outlook 2025 to 2035
Demand Side Management Market Size and Share Forecast Outlook 2025 to 2035
Demand Response Market Analysis - Size, Share, and Forecast Outlook 2025 to 2035
Demand for Industrial Pepper in USA Size and Share Forecast Outlook 2025 to 2035
Demand for Industrial Evaporative Condensers in USA Size and Share Forecast Outlook 2025 to 2035
Demand for Industrial Control Network Modules in UK Size and Share Forecast Outlook 2025 to 2035
Demand for Industrial Chocolate in EU Size and Share Forecast Outlook 2025 to 2035
Demand for Industrial & Institutional Cleaning Products in EU Size and Share Forecast Outlook 2025 to 2035
Demand for Mineral Enrichment Ingredients in USA Size and Share Forecast Outlook 2025 to 2035
Demand for Zinc-Tin Alloy Sputtering Target in UK Size and Share Forecast Outlook 2025 to 2035
Demand for Lingonberry Powder in USA Size and Share Forecast Outlook 2025 to 2035
Demand for Lingonberry Powder in UK Size and Share Forecast Outlook 2025 to 2035
Demand for Miniature Duplex Connectors in USA Size and Share Forecast Outlook 2025 to 2035
Demand for 4-Inch SiC Laser Annealing Equipment in UK Size and Share Forecast Outlook 2025 to 2035
Demand for 4-Inch SiC Laser Annealing Equipment in the USA Size and Share Forecast Outlook 2025 to 2035
Demand for Joint Compound in EU Size and Share Forecast Outlook 2025 to 2035
Demand for Online Clothing Rental in USA Size and Share Forecast Outlook 2025 to 2035
Demand for Marine-grade Polyurethane in UK Size and Share Forecast Outlook 2025 to 2035
Demand for Stainless Steel 330 Refractory Anchor in USA Size and Share Forecast Outlook 2025 to 2035
Demand for Stainless Steel 330 Refractory Anchor in UK Size and Share Forecast Outlook 2025 to 2035

Thank you!
You will receive an email from our Business Development Manager. Please be sure to check your SPAM/JUNK folder too.
Chat With
MaRIA