Reports

- Global Locations -

Headquarters

Future Market Insights, Inc.

Christiana Corporate, 200
Continental Drive, Suite 401,
Newark, Delaware - 19713,
United States

T: +1-845-579-5705

Americas

Future Market Insights, Inc.

616 Corporate Way, Suite 2-9018,
Valley Cottage, NY 10989, United States

T: +1-347-918-3531

MEA

Future Market Insights

1602-6 Jumeirah Bay X2 Tower, Plot No: JLT-PH2-X2A,
Jumeirah Lakes Towers, Dubai,
United Arab Emirates

Europe

Future Market Insights

3rd Floor, 207 Regent Street,
W1B 3HH London
United Kingdom

T: + 44 (0) 20 8123 9659
D: +44 (0) 20 3287 4268

Asia Pacific

Future Market Insights

IndiaLand Global Tech Park, Unit UG-1, Behind Grand HighStreet, Phase 1, Hinjawadi, MH, Pune – 411057, India

Bulk Bag Market Outlook (2024 to 2034)

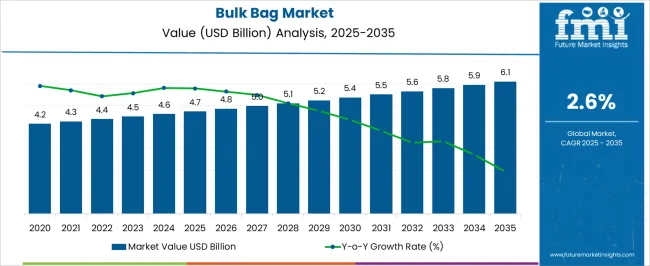
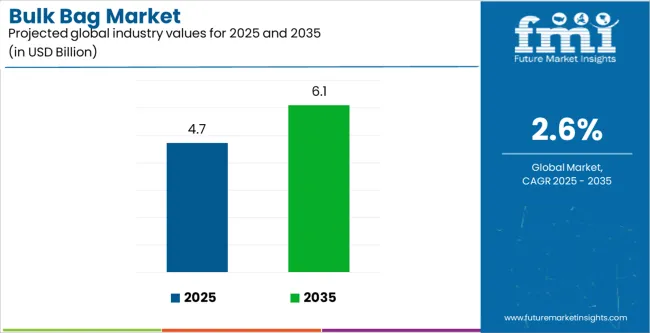
The global bulk bag market size is anticipated to be worth US$ 6.0 billion by 2034. According to the estimates, the market is projected to clock a 2.6% CAGR until 2034. In 2024, the bulk bag market size is valued at US$ 4.6 billion.

Attributes Details
Bulk Bag Market Size, 2023 US$ 4.5 billion
Bulk Bag Market Size, 2024 US$ 4.6 billion
Bulk Bag Market Size, 2034 US$ 6.0 billion
Value CAGR (2024 to 2034) 2.6%

Don't pay for what you don't need

Customize your report by selecting specific countries or regions and save 30%!

Key Market Highlights

Bulk Bag Adoption Surges Due to Rising Diversification of End-use Industries

Bulk bags are growing in popularity in various sectors due to their adaptability, which positions them as a flexible and versatile packaging choice. Bulk sacks serve various end-use applications in agriculture, chemicals, construction, food and beverage, and other industries.

This trend demonstrates that manufacturers have strategically positioned FIBC bulk bags as an all-encompassing solution that cuts across industry boundaries. In addition to increasing market reach, this diversity presents bulk bags as a strategic asset for companies looking for a single, adaptable packaging solution that can meet the particular needs of many sectors.

Targeting the Demand for Hygienic Packaging Presents Opportunities for Market Players

Businesses have a strategic opportunity to create advanced bulk bags made of materials resistant to microbes by focusing on the need for hygienic packaging in industries like food and pharmaceuticals. These specialty bulk bags are perfect for situations where sterility is critical since research into antimicrobial coatings or materials tackles contamination problems.

In addition to satisfying the strict criteria of industry sectors where product purity and safety are non-negotiable, this tactical step positions businesses as suppliers of important solutions.

Smart Packaging Integration Rises in the Market

Bulk bag packaging's incorporation of smart technology shows a strategic commitment to improving operational information and supply chain visibility. Real-time tracking, monitoring, and data analytics are made possible by smart packaging that uses RFID and sensor technologies.

This promotes data-driven decision-making and overall supply chain efficiency and optimizes inventory management. As the industry moves toward Industry 4.0 and uses data analytics for operational excellence and strategic business insights, this trend reflects a sophisticated approach to packaging solutions.

Bulk Bag Market Trends Analysis

Trends
  • Bulk bag sales are being driven mostly by the unrelenting expansion of e-commerce.
  • Bulk bag consumption has been fueled by the widespread movement toward sustainability in business, which has substantially impacted packaging choices.
  • The market for bulk bags is expanding due to consumer desire for individualized packaging options.
  • The packaging industry is changing due to the rise of circular economy models, and sustainable bulk bags are becoming an important element in this paradigm shift.
  • Companies are placing more emphasis on transportation efficiency, and the bulk bag industry plays a key role in meeting this requirement.
Opportunities
  • Manufacturers can look into opportunities for creating bespoke bulk bags for industries like medicines, electronics, and specialty chemicals, giving focused solutions to specific demands.
  • With the growing need for temperature-sensitive commodities, developing and commercializing improved temperature-controlled bulk bags is possible.
  • Given the widespread stress over counterfeit items, there is room for innovation in anti-counterfeiting measures in bulk bags.
  • The move toward lightweight packaging for increased transportation efficiency opens up the potential for firms to carefully promote their lightweight bulk bags.
  • Embracing the emergence of autonomous technologies in logistics and handling presents a unique opportunity.
Challenges
  • While bulk bags can be reused in many situations, they have limits in applications that need single-use packaging for hygiene or contamination control, such as medicines and food processing.
  • Bulk bags aren't always compatible with some automated handling and filling systems in sectors migrating to automation. This constraint can have an influence on their use in highly automated industrial systems.
Ismail Sutaria
Ismail Sutaria

Principal Consultant

Talk to Analyst

Find your sweet spots for generating winning opportunities in this market.

Comparative View of Markets Adjacent to Bulk Bags

This section compares the jumbo bags market and the portion bags market. According to the analysis, the increasing worldwide commerce and logistics business demands effective bulk material packaging solutions. Bulk bags are a cost-effective and adaptable solution for handling and transporting huge product quantities, driving their market growth.

The rising popularity of e-commerce and online shopping has increased demand for jumbo and portion bags. These packaging solutions meet the unique demands of online buyers by offering practical alternatives for packaging and shipping items of various sizes. Furthermore, the food and beverage sector has seen an increase in demand for portion bags, driven by shifting customer preferences for convenience and on-the-go consumption.

Bulk Bag Market:

Attributes Bulk Bag Market
CAGR (2024 to 2034) 2.6%
Growth Factors
  • Rise of e-commerce and bulk purchasing trends fuel market growth.
  • Increasing adoption of circular economy models surges demand.
Future Opportunities Increased awareness of transportation efficiency.
Market Trends Diversification of end-use industries.

Jumbo Bags Market:

Attributes Jumbo Bags Market
CAGR (2024 to 2034) 4.2%
Growth Factors
  • Growing infrastructure development globally.
  • Innovations in the flexible packaging industry.
Future Opportunities Shift toward bio-based materials for manufacturing of jumbo bags.
Market Trends Increasing sustainability trends.

Portion Bags Market:

Attributes Portion Bags Market
CAGR (2024 to 2034) 3%
Growth Factors
  • Expansion of the food industry.
  • Changing lifestyles catapult demand.
Future Opportunities Increased demand to curb food wastage.
Market Trends Rising working population boosts demand.

Category-wise Insights

Type C Dominates as the Leading Fabric Type

Segment Type C (Fabric Type)
Value Share (2024) 41.5%

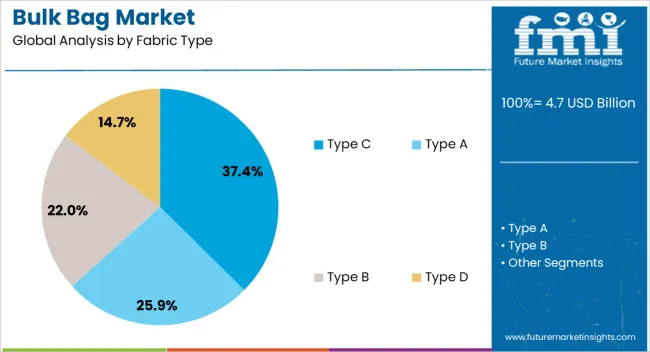
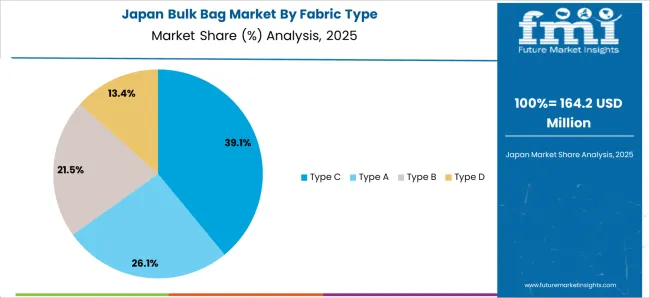
Based on fabric type, the Type C segment holds 41.5% of bulk bag market shares in 2024.

  • Type C fabric, commonly known as conductive fabric, has better static dissipative qualities than other fabric kinds. This characteristic makes it perfect for sectors that work with flammable or explosive substances, such as chemicals, powders, or medicines. As safety rules tighten, particularly in hazardous areas, there is an increasing demand for bulk bags that can effectively reduce the risk of electrostatic discharge, making Type C fabric the preferable material.
  • The significance of static control methods is becoming more widely recognized as industries grow on a worldwide scale and function in various conditions. The standardized solution provided by Type C bulk bags satisfies international safety standards and regulatory criteria. Because of this, they are a favored option for businesses operating in several locations, guaranteeing uniform safety procedures and adherence to industry standards.

U-panel Bag Continue to be the Leading Design for Bulk Bags

Segment U-panel Bag (Design)
Value Share (2024) 26.2%

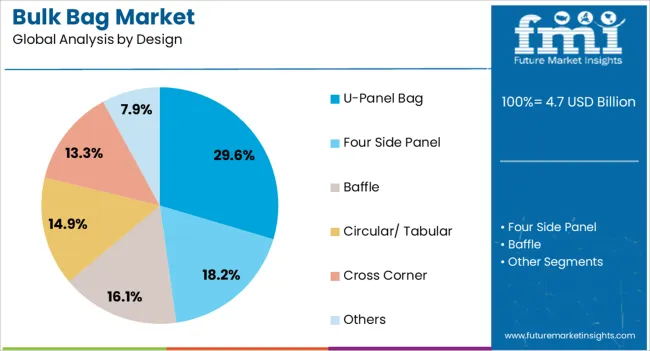
Based on design, the u-panel bag segment captured 26.2% of bulk bag market shares in 2024.

  • U-panel bulk bags are adaptable and appropriate for numerous applications in various sectors. They are perfect for handling a variety of materials, such as powders, granules, and bulk solids, given their robust design. The broad use of U-panel bulk bags in sectors including construction, agriculture, chemicals, and food processing is partly due to their adaptability.
  • U-panel bulk bags provide effective storage and stacking options. The consistent and flat shape makes it possible to stack bags steadily, maximizing transportation and warehousing space. This feature is especially helpful for businesses that distribute bulk items internationally or have limited storage space.

Get the data you need at a Fraction of the cost

Personalize your report by choosing insights you need
and save 40%!

Country-wise Insights

Countries Value CAGR (2024 to 2034)
United States 1.3%
Germany 1.1%
India 5.8%
Japan 1.3%
South Korea 1.6%

Regulatory Compliance in Hazardous Material Handling Aids Expansion in the United States

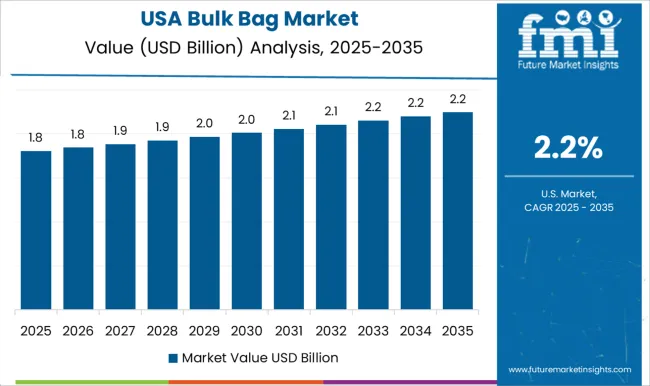
The demand for bulk bags in the United States is projected to rise at a 1.3% CAGR through 2034.

  • Specialized bulk bags that adhere to compliance requirements are in high demand due to the strict regulatory environment in the United States, particularly when handling hazardous goods. To maintain compliance with safety standards, industries handling chemicals, medicines, or other hazardous items resort to bulk bags featuring special design elements, such as Type C fabric. The market for bulk bags is growing as a result of this regulatory-driven need.
  • Another driver of market growth is the incorporation of smart technology, including RFID tracking and Internet of Things devices, into bulk bags. Companies in the United States are starting to realize how valuable smart bulk bags' improved supply chain visibility and real-time tracking features are. This trend places smart bulk bags as a strategic investment for companies looking to enhance their supply chain operations, in line with the larger industry transition toward Industry 4.0 and data-driven logistics.

Strategic Embrace of Industry 4.0 and Smart Logistics Fuels Sales in Germany

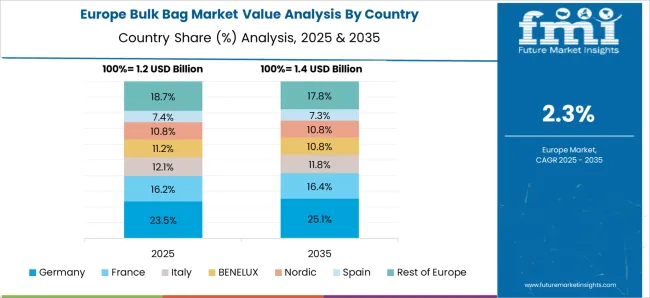
The sales of bulk bags in Germany are anticipated to surge at a 1.0% CAGR through 2034.

  • The market for bulk bags is being impacted by Germany's pioneering work in implementing Industry 4.0 concepts and clever logistical techniques. Bulk bag manufacturers are incorporating smart technology for data-driven insights, inventory management, and real-time tracking. Because of their compatibility with Germany's emphasis on innovation and digitization, smart bulk bags are positioned as a key element in the changing Industry 4.0 scene.
  • Germany's pioneering role is influencing the design and application of bulk bags by using sophisticated robotics and automation in warehouses. Bulk bag integration with automated handling systems optimizes storage and decreases human work, therefore increasing warehouse efficiency. The German bulk bag market is growing due to the trend of automation in logistics.

Influence of Packaging Innovations in the FMCG Catapult Growth in India

The bulk bag market growth in India is estimated at a 5.8% CAGR through 2034.

  • The Indian bulk bag market is being impacted by advancements in packaging, particularly in the fast-moving consumer goods (FMCG) industry. FMCG firms increasingly incorporate bulk bags into their supply chain procedures to effectively handle raw materials and completed goods. Their ability to adapt to the changing packaging trends in the fast-moving consumer goods (FMCG) industry plays a crucial role in their market growth.
  • Small and medium-sized businesses (SMEs) are common in India's many industries, which necessitates adaptable and affordable packaging solutions. Advanced bulk bags provide SMEs with a scalable and effective packaging solution because of their adjustable designs and versatility in handling various contents. Bulk bags' distinct fit for the needs of India's SME-driven economy aids in their market growth.

Highly Developed Pharmaceutical and High-tech Industries Boost Demand in Japan

The demand for bulk bags in Japan is predicted to surge at a 1.3% CAGR through 2034.

  • The sophisticated pharmaceutical and high-tech sectors in Japan have particular needs when it comes to packaging. These industries find special uses for bulk bags, particularly those with specialized qualities like static dissipation and contamination prevention. One particular element driving the growth of the bulk bag market is the need for precise packaging solutions in Japan's high-tech sectors.
  • The market for bulk bags is being impacted by Japan's dedication to cutting-edge recycling and trash reduction methods. Bulk bags support Japan's environmental objectives by being made for the effective collection and transportation of recyclable items. The special focus on cutting-edge waste management techniques gives the growth of the bulk bag industry in Japan a unique aspect.

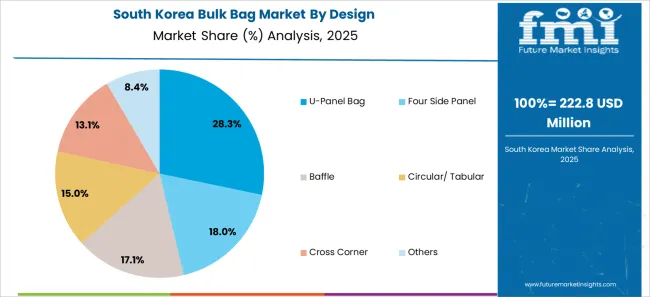
Focus on Food Safety and Hygiene Concerns Fuel Sales in South Korea

The sales of bulk bags in South Korea are anticipated to rise at a 1.6% CAGR through 2034.

  • The food industry's need for specific packaging solutions is influenced by South Korea's strict food safety and hygiene regulations. Food commodities are best stored and transported in bulk bags, which are made to adhere to stringent quality and hygiene standards. Bulk bags are uniquely positioned as a dependable packaging solution by focusing on food safety and cleanliness, propelling market development in South Korea.
  • Cooperation in packaging solutions is made possible by South Korea's robust position in the electronics and automotive sectors. Flexible bulk bags meet the packaging requirements of these sectors because of their adaptability in handling a variety of materials. Bulk bags are positioned as a favored packaging solution by way of strategic engagement with automotive and electronics firms, which propels market progress in South Korea.

Competitive Landscape

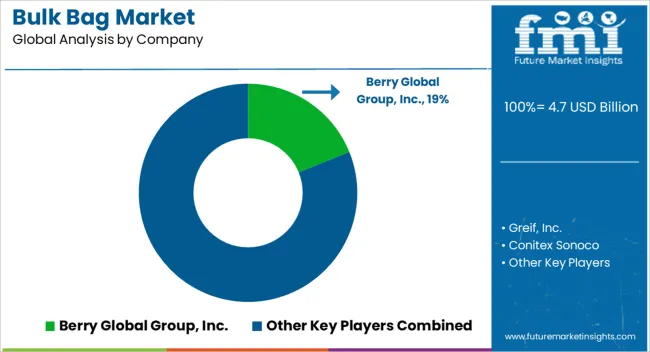
The bulk bag market is highly competitive, with both established global firms and local producers fighting for market dominance. The market is dominated by significant players like Berry Global Group, Inc., Greif, Inc., and Conitex Sonoco because of their wide range of products, worldwide presence, and tactical alliances. To keep a competitive edge, these market titans make use of economies of scale, technical superiority, and robust distribution networks.

Recent Developments

  • In October 2023, Flexicon introduced a new BFF Series Bulk Bag Discharger that retains dust while connecting bag spouts and feeding material into vacuum conveying lines, reducing contamination of the product and plant environment.
  • In August 2023, Spiroflow, an Automated Handling Solutions (AHS) firm, unveiled its next-generation twin-line bulk bag filling system. Following considerable research and development, the new method overcomes the limits of sluggish, old equipment that was prone to spills and high product and dust emissions.

Key Players in the Bulk Bag Market

  • Berry Global Group, Inc.
  • Greif, Inc.
  • Conitex Sonoco
  • BAG Corp
  • Mondi Group
  • LC Packaging International BV
  • MiniBulk Inc.
  • RDA Bulk Packaging Ltd.
  • Big Bags International Pvt. Ltd.
  • AmeriGlobe LLC

Key Coverage in the Bulk Bag Market Report

  • Adjacent Study on Jumbo Bags Market, Type-C Bulk Bags Market, Ventilated Bulk Bags Market, and Flexible Intermediate Bulk Container Market
  • Consumption Analysis of Europe Bulk Bags Market
  • Demand Analysis of North America FIBC Market
  • Insights on Top Bulk Bag Manufacturers & Industrial Suppliers
  • Trends and Predictions for the Future of FIBC Bulk Bags Industry

Bulk Bag Market Segmentation

By Fabric Type:

  • Type A
  • Type B
  • Type C
  • Type D

By Design:

  • U-Panel Bag
  • Four Side Panel
  • Baffle
  • Circular/ Tabular
  • Cross Corner
  • Others

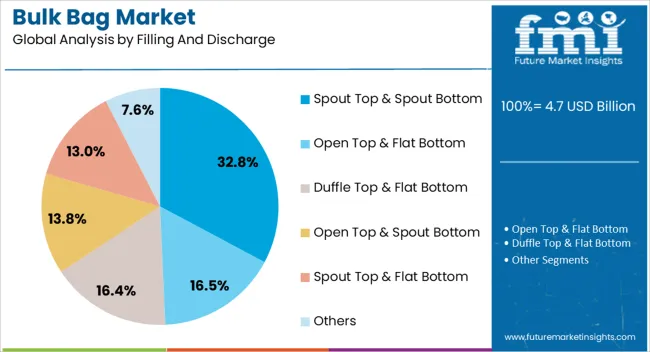
By Filling and Discharge:

  • Open Top & Flat Bottom
  • Duffle Top & Flat Bottom
  • Open Top & Spout Bottom
  • Spout Top & Spout Bottom
  • Spout Top & Flat Bottom
  • Others

By End User Industry:

  • Chemicals & Fertilizers
  • Food
  • Construction
  • Pharmaceutical
  • Mining
  • Others

By Region:

  • North America
  • Latin America
  • Western Europe
  • Eastern Europe
  • Asia Pacific (APAC)
  • Middle East & Africa (MEA)
  • Japan

Frequently Asked Questions

How Big is the Bulk Bag Market?

The bulk bag market is valued at US$ 4.6 billion in 2024.

What is the Projected CAGR of the Bulk Bag Market?

The bulk bag market size is estimated to increase at a 2.6% CAGR through 2034.

What is the Future Outlook for the Bulk Bag Market?

The bulk bag market is anticipated to be worth US$ 6.0 billion by 2034.

Which is the Leading Design in the Bulk Bag Market?

U-panel bag witnesses high demand in the industry.

Which Country is Rising at a Higher CAGR in the Bulk Bag Market?

The bulk bag market in India is predicted to rise at a 5.8% CAGR through 2034.

Table of Content

1. Executive Summary

    1.1. Global Market Outlook

    1.2. Demand-side Trends

    1.3. Supply-side Trends

    1.4. Technology Roadmap Analysis

    1.5. Analysis and Recommendations

2. Market Overview

    2.1. Market Coverage / Taxonomy

    2.2. Market Definition / Scope / Limitations

3. Market Background

    3.1. Market Dynamics

        3.1.1. Drivers

        3.1.2. Restraints

        3.1.3. Opportunity

        3.1.4. Trends

    3.2. Scenario Forecast

        3.2.1. Demand in Optimistic Scenario

        3.2.2. Demand in Likely Scenario

        3.2.3. Demand in Conservative Scenario

    3.3. Opportunity Map Analysis

    3.4. Product Life Cycle Analysis

    3.5. Supply Chain Analysis

        3.5.1. Supply Side Participants and their Roles

            3.5.1.1. Producers

            3.5.1.2. Mid-Level Participants (Traders)

            3.5.1.3. Wholesalers and Distributors

        3.5.2. Value Added and Value Created at Node in the Supply Chain

        3.5.3. List of Raw Material Suppliers

        3.5.4. List of Existing and Potential Buyer’s

    3.6. Investment Feasibility Matrix

    3.7. Value Chain Analysis

        3.7.1. Profit Margin Analysis

        3.7.2. Wholesalers and Distributors

    3.8. PESTLE and Porter’s Analysis

    3.9. Regulatory Landscape

        3.9.1. By Key Regions

        3.9.2. By Key Countries

    3.10. Regional Parent Market Outlook

    3.11. Production and Consumption Statistics

    3.12. Import and Export Statistics

4. Global Market Analysis 2019 to 2023 and Forecast, 2024 to 2034

    4.1. Historical Market Size Value (US$ Million) & Volume (Units) Analysis, 2019 to 2023

    4.2. Current and Future Market Size Value (US$ Million) & Volume (Units) Projections, 2024 to 2034

        4.2.1. Y-o-Y Growth Trend Analysis

        4.2.2. Absolute $ Opportunity Analysis

5. Global Market Analysis 2019 to 2023 and Forecast 2024 to 2034, By Capacity

    5.1. Introduction / Key Findings

    5.2. Historical Market Size Value (US$ Million) & Volume (Units) Analysis By Capacity, 2019 to 2023

    5.3. Current and Future Market Size Value (US$ Million) & Volume (Units) Analysis and Forecast By Capacity, 2024 to 2034

        5.3.1. Small (up to 0.75 cu. m)

        5.3.2. Medium (0.75 to 1.5 cu. m)

        5.3.3. Large (Above 1.5 cu. m)

    5.4. Y-o-Y Growth Trend Analysis By Capacity, 2019 to 2023

    5.5. Absolute $ Opportunity Analysis By Capacity, 2024 to 2034

6. Global Market Analysis 2019 to 2023 and Forecast 2024 to 2034, By Fabric Type

    6.1. Introduction / Key Findings

    6.2. Historical Market Size Value (US$ Million) & Volume (Units) Analysis By Fabric Type, 2019 to 2023

    6.3. Current and Future Market Size Value (US$ Million) & Volume (Units) Analysis and Forecast By Fabric Type, 2024 to 2034

        6.3.1. Type A

        6.3.2. Type B

        6.3.3. Type C

        6.3.4. Type D

    6.4. Y-o-Y Growth Trend Analysis By Fabric Type, 2019 to 2023

    6.5. Absolute $ Opportunity Analysis By Fabric Type, 2024 to 2034

7. Global Market Analysis 2019 to 2023 and Forecast 2024 to 2034, By Design

    7.1. Introduction / Key Findings

    7.2. Historical Market Size Value (US$ Million) & Volume (Units) Analysis By Design, 2019 to 2023

    7.3. Current and Future Market Size Value (US$ Million) & Volume (Units) Analysis and Forecast By Design, 2024 to 2034

        7.3.1. U-Panel Bag

        7.3.2. Four Side Panel

        7.3.3. Baffle

        7.3.4. Circular/ Tabular

        7.3.5. Cross Corner

        7.3.6. Others

    7.4. Y-o-Y Growth Trend Analysis By Design, 2019 to 2023

    7.5. Absolute $ Opportunity Analysis By Design, 2024 to 2034

8. Global Market Analysis 2019 to 2023 and Forecast 2024 to 2034, By Filling and Discharge

    8.1. Introduction / Key Findings

    8.2. Historical Market Size Value (US$ Million) & Volume (Units) Analysis By Filling and Discharge, 2019 to 2023

    8.3. Current and Future Market Size Value (US$ Million) & Volume (Units) Analysis and Forecast By Filling and Discharge, 2024 to 2034

        8.3.1. Open Top & Flat Bottom

        8.3.2. Duffle Top & Flat Bottom

        8.3.3. Open Top & Spout Bottom

        8.3.4. Spout Top & Spout Bottom

        8.3.5. Spout Top & Flat Bottom

        8.3.6. Others

    8.4. Y-o-Y Growth Trend Analysis By Filling and Discharge, 2019 to 2023

    8.5. Absolute $ Opportunity Analysis By Filling and Discharge, 2024 to 2034

9. Global Market Analysis 2019 to 2023 and Forecast 2024 to 2034, By End User Industry

    9.1. Introduction / Key Findings

    9.2. Historical Market Size Value (US$ Million) & Volume (Units) Analysis By End User Industry, 2019 to 2023

    9.3. Current and Future Market Size Value (US$ Million) & Volume (Units) Analysis and Forecast By End User Industry, 2024 to 2034

        9.3.1. Chemicals & Fertilizers

        9.3.2. Food

        9.3.3. Construction

        9.3.4. Pharmaceutical

        9.3.5. Mining

        9.3.6. Others

    9.4. Y-o-Y Growth Trend Analysis By End User Industry, 2019 to 2023

    9.5. Absolute $ Opportunity Analysis By End User Industry, 2024 to 2034

10. Global Market Analysis 2019 to 2023 and Forecast 2024 to 2034, By Region

    10.1. Introduction

    10.2. Historical Market Size Value (US$ Million) & Volume (Units) Analysis By Region, 2019 to 2023

    10.3. Current Market Size Value (US$ Million) & Volume (Units) Analysis and Forecast By Region, 2024 to 2034

        10.3.1. North America

        10.3.2. Latin America

        10.3.3. Western Europe

        10.3.4. Eastern Europe

        10.3.5. South Asia and Pacific

        10.3.6. East Asia

        10.3.7. Middle East and Africa

    10.4. Market Attractiveness Analysis By Region

11. North America Market Analysis 2019 to 2023 and Forecast 2024 to 2034, By Country

    11.1. Historical Market Size Value (US$ Million) & Volume (Units) Trend Analysis By Market Taxonomy, 2019 to 2023

    11.2. Market Size Value (US$ Million) & Volume (Units) Forecast By Market Taxonomy, 2024 to 2034

        11.2.1. By Country

            11.2.1.1. USA

            11.2.1.2. Canada

        11.2.2. By Capacity

        11.2.3. By Fabric Type

        11.2.4. By Design

        11.2.5. By Filling and Discharge

        11.2.6. By End User Industry

    11.3. Market Attractiveness Analysis

        11.3.1. By Country

        11.3.2. By Capacity

        11.3.3. By Fabric Type

        11.3.4. By Design

        11.3.5. By Filling and Discharge

        11.3.6. By End User Industry

    11.4. Key Takeaways

12. Latin America Market Analysis 2019 to 2023 and Forecast 2024 to 2034, By Country

    12.1. Historical Market Size Value (US$ Million) & Volume (Units) Trend Analysis By Market Taxonomy, 2019 to 2023

    12.2. Market Size Value (US$ Million) & Volume (Units) Forecast By Market Taxonomy, 2024 to 2034

        12.2.1. By Country

            12.2.1.1. Brazil

            12.2.1.2. Mexico

            12.2.1.3. Rest of Latin America

        12.2.2. By Capacity

        12.2.3. By Fabric Type

        12.2.4. By Design

        12.2.5. By Filling and Discharge

        12.2.6. By End User Industry

    12.3. Market Attractiveness Analysis

        12.3.1. By Country

        12.3.2. By Capacity

        12.3.3. By Fabric Type

        12.3.4. By Design

        12.3.5. By Filling and Discharge

        12.3.6. By End User Industry

    12.4. Key Takeaways

13. Western Europe Market Analysis 2019 to 2023 and Forecast 2024 to 2034, By Country

    13.1. Historical Market Size Value (US$ Million) & Volume (Units) Trend Analysis By Market Taxonomy, 2019 to 2023

    13.2. Market Size Value (US$ Million) & Volume (Units) Forecast By Market Taxonomy, 2024 to 2034

        13.2.1. By Country

            13.2.1.1. Germany

            13.2.1.2. UK

            13.2.1.3. France

            13.2.1.4. Spain

            13.2.1.5. Italy

            13.2.1.6. Rest of Western Europe

        13.2.2. By Capacity

        13.2.3. By Fabric Type

        13.2.4. By Design

        13.2.5. By Filling and Discharge

        13.2.6. By End User Industry

    13.3. Market Attractiveness Analysis

        13.3.1. By Country

        13.3.2. By Capacity

        13.3.3. By Fabric Type

        13.3.4. By Design

        13.3.5. By Filling and Discharge

        13.3.6. By End User Industry

    13.4. Key Takeaways

14. Eastern Europe Market Analysis 2019 to 2023 and Forecast 2024 to 2034, By Country

    14.1. Historical Market Size Value (US$ Million) & Volume (Units) Trend Analysis By Market Taxonomy, 2019 to 2023

    14.2. Market Size Value (US$ Million) & Volume (Units) Forecast By Market Taxonomy, 2024 to 2034

        14.2.1. By Country

            14.2.1.1. Poland

            14.2.1.2. Russia

            14.2.1.3. Czech Republic

            14.2.1.4. Romania

            14.2.1.5. Rest of Eastern Europe

        14.2.2. By Capacity

        14.2.3. By Fabric Type

        14.2.4. By Design

        14.2.5. By Filling and Discharge

        14.2.6. By End User Industry

    14.3. Market Attractiveness Analysis

        14.3.1. By Country

        14.3.2. By Capacity

        14.3.3. By Fabric Type

        14.3.4. By Design

        14.3.5. By Filling and Discharge

        14.3.6. By End User Industry

    14.4. Key Takeaways

15. South Asia and Pacific Market Analysis 2019 to 2023 and Forecast 2024 to 2034, By Country

    15.1. Historical Market Size Value (US$ Million) & Volume (Units) Trend Analysis By Market Taxonomy, 2019 to 2023

    15.2. Market Size Value (US$ Million) & Volume (Units) Forecast By Market Taxonomy, 2024 to 2034

        15.2.1. By Country

            15.2.1.1. India

            15.2.1.2. Bangladesh

            15.2.1.3. Australia

            15.2.1.4. New Zealand

            15.2.1.5. Rest of South Asia and Pacific

        15.2.2. By Capacity

        15.2.3. By Fabric Type

        15.2.4. By Design

        15.2.5. By Filling and Discharge

        15.2.6. By End User Industry

    15.3. Market Attractiveness Analysis

        15.3.1. By Country

        15.3.2. By Capacity

        15.3.3. By Fabric Type

        15.3.4. By Design

        15.3.5. By Filling and Discharge

        15.3.6. By End User Industry

    15.4. Key Takeaways

16. East Asia Market Analysis 2019 to 2023 and Forecast 2024 to 2034, By Country

    16.1. Historical Market Size Value (US$ Million) & Volume (Units) Trend Analysis By Market Taxonomy, 2019 to 2023

    16.2. Market Size Value (US$ Million) & Volume (Units) Forecast By Market Taxonomy, 2024 to 2034

        16.2.1. By Country

            16.2.1.1. China

            16.2.1.2. Japan

            16.2.1.3. South Korea

        16.2.2. By Capacity

        16.2.3. By Fabric Type

        16.2.4. By Design

        16.2.5. By Filling and Discharge

        16.2.6. By End User Industry

    16.3. Market Attractiveness Analysis

        16.3.1. By Country

        16.3.2. By Capacity

        16.3.3. By Fabric Type

        16.3.4. By Design

        16.3.5. By Filling and Discharge

        16.3.6. By End User Industry

    16.4. Key Takeaways

17. Middle East and Africa Market Analysis 2019 to 2023 and Forecast 2024 to 2034, By Country

    17.1. Historical Market Size Value (US$ Million) & Volume (Units) Trend Analysis By Market Taxonomy, 2019 to 2023

    17.2. Market Size Value (US$ Million) & Volume (Units) Forecast By Market Taxonomy, 2024 to 2034

        17.2.1. By Country

            17.2.1.1. GCC Countries

            17.2.1.2. South Africa

            17.2.1.3. Israel

            17.2.1.4. Rest of MEA

        17.2.2. By Capacity

        17.2.3. By Fabric Type

        17.2.4. By Design

        17.2.5. By Filling and Discharge

        17.2.6. By End User Industry

    17.3. Market Attractiveness Analysis

        17.3.1. By Country

        17.3.2. By Capacity

        17.3.3. By Fabric Type

        17.3.4. By Design

        17.3.5. By Filling and Discharge

        17.3.6. By End User Industry

    17.4. Key Takeaways

18. Key Countries Market Analysis

    18.1. USA

        18.1.1. Pricing Analysis

        18.1.2. Market Share Analysis, 2023

            18.1.2.1. By Capacity

            18.1.2.2. By Fabric Type

            18.1.2.3. By Design

            18.1.2.4. By Filling and Discharge

            18.1.2.5. By End User Industry

    18.2. Canada

        18.2.1. Pricing Analysis

        18.2.2. Market Share Analysis, 2023

            18.2.2.1. By Capacity

            18.2.2.2. By Fabric Type

            18.2.2.3. By Design

            18.2.2.4. By Filling and Discharge

            18.2.2.5. By End User Industry

    18.3. Brazil

        18.3.1. Pricing Analysis

        18.3.2. Market Share Analysis, 2023

            18.3.2.1. By Capacity

            18.3.2.2. By Fabric Type

            18.3.2.3. By Design

            18.3.2.4. By Filling and Discharge

            18.3.2.5. By End User Industry

    18.4. Mexico

        18.4.1. Pricing Analysis

        18.4.2. Market Share Analysis, 2023

            18.4.2.1. By Capacity

            18.4.2.2. By Fabric Type

            18.4.2.3. By Design

            18.4.2.4. By Filling and Discharge

            18.4.2.5. By End User Industry

    18.5. Germany

        18.5.1. Pricing Analysis

        18.5.2. Market Share Analysis, 2023

            18.5.2.1. By Capacity

            18.5.2.2. By Fabric Type

            18.5.2.3. By Design

            18.5.2.4. By Filling and Discharge

            18.5.2.5. By End User Industry

    18.6. UK

        18.6.1. Pricing Analysis

        18.6.2. Market Share Analysis, 2023

            18.6.2.1. By Capacity

            18.6.2.2. By Fabric Type

            18.6.2.3. By Design

            18.6.2.4. By Filling and Discharge

            18.6.2.5. By End User Industry

    18.7. France

        18.7.1. Pricing Analysis

        18.7.2. Market Share Analysis, 2023

            18.7.2.1. By Capacity

            18.7.2.2. By Fabric Type

            18.7.2.3. By Design

            18.7.2.4. By Filling and Discharge

            18.7.2.5. By End User Industry

    18.8. Spain

        18.8.1. Pricing Analysis

        18.8.2. Market Share Analysis, 2023

            18.8.2.1. By Capacity

            18.8.2.2. By Fabric Type

            18.8.2.3. By Design

            18.8.2.4. By Filling and Discharge

            18.8.2.5. By End User Industry

    18.9. Italy

        18.9.1. Pricing Analysis

        18.9.2. Market Share Analysis, 2023

            18.9.2.1. By Capacity

            18.9.2.2. By Fabric Type

            18.9.2.3. By Design

            18.9.2.4. By Filling and Discharge

            18.9.2.5. By End User Industry

    18.10. Poland

        18.10.1. Pricing Analysis

        18.10.2. Market Share Analysis, 2023

            18.10.2.1. By Capacity

            18.10.2.2. By Fabric Type

            18.10.2.3. By Design

            18.10.2.4. By Filling and Discharge

            18.10.2.5. By End User Industry

    18.11. Russia

        18.11.1. Pricing Analysis

        18.11.2. Market Share Analysis, 2023

            18.11.2.1. By Capacity

            18.11.2.2. By Fabric Type

            18.11.2.3. By Design

            18.11.2.4. By Filling and Discharge

            18.11.2.5. By End User Industry

    18.12. Czech Republic

        18.12.1. Pricing Analysis

        18.12.2. Market Share Analysis, 2023

            18.12.2.1. By Capacity

            18.12.2.2. By Fabric Type

            18.12.2.3. By Design

            18.12.2.4. By Filling and Discharge

            18.12.2.5. By End User Industry

    18.13. Romania

        18.13.1. Pricing Analysis

        18.13.2. Market Share Analysis, 2023

            18.13.2.1. By Capacity

            18.13.2.2. By Fabric Type

            18.13.2.3. By Design

            18.13.2.4. By Filling and Discharge

            18.13.2.5. By End User Industry

    18.14. India

        18.14.1. Pricing Analysis

        18.14.2. Market Share Analysis, 2023

            18.14.2.1. By Capacity

            18.14.2.2. By Fabric Type

            18.14.2.3. By Design

            18.14.2.4. By Filling and Discharge

            18.14.2.5. By End User Industry

    18.15. Bangladesh

        18.15.1. Pricing Analysis

        18.15.2. Market Share Analysis, 2023

            18.15.2.1. By Capacity

            18.15.2.2. By Fabric Type

            18.15.2.3. By Design

            18.15.2.4. By Filling and Discharge

            18.15.2.5. By End User Industry

    18.16. Australia

        18.16.1. Pricing Analysis

        18.16.2. Market Share Analysis, 2023

            18.16.2.1. By Capacity

            18.16.2.2. By Fabric Type

            18.16.2.3. By Design

            18.16.2.4. By Filling and Discharge

            18.16.2.5. By End User Industry

    18.17. New Zealand

        18.17.1. Pricing Analysis

        18.17.2. Market Share Analysis, 2023

            18.17.2.1. By Capacity

            18.17.2.2. By Fabric Type

            18.17.2.3. By Design

            18.17.2.4. By Filling and Discharge

            18.17.2.5. By End User Industry

    18.18. China

        18.18.1. Pricing Analysis

        18.18.2. Market Share Analysis, 2023

            18.18.2.1. By Capacity

            18.18.2.2. By Fabric Type

            18.18.2.3. By Design

            18.18.2.4. By Filling and Discharge

            18.18.2.5. By End User Industry

    18.19. Japan

        18.19.1. Pricing Analysis

        18.19.2. Market Share Analysis, 2023

            18.19.2.1. By Capacity

            18.19.2.2. By Fabric Type

            18.19.2.3. By Design

            18.19.2.4. By Filling and Discharge

            18.19.2.5. By End User Industry

    18.20. South Korea

        18.20.1. Pricing Analysis

        18.20.2. Market Share Analysis, 2023

            18.20.2.1. By Capacity

            18.20.2.2. By Fabric Type

            18.20.2.3. By Design

            18.20.2.4. By Filling and Discharge

            18.20.2.5. By End User Industry

    18.21. GCC Countries

        18.21.1. Pricing Analysis

        18.21.2. Market Share Analysis, 2023

            18.21.2.1. By Capacity

            18.21.2.2. By Fabric Type

            18.21.2.3. By Design

            18.21.2.4. By Filling and Discharge

            18.21.2.5. By End User Industry

    18.22. South Africa

        18.22.1. Pricing Analysis

        18.22.2. Market Share Analysis, 2023

            18.22.2.1. By Capacity

            18.22.2.2. By Fabric Type

            18.22.2.3. By Design

            18.22.2.4. By Filling and Discharge

            18.22.2.5. By End User Industry

    18.23. Israel

        18.23.1. Pricing Analysis

        18.23.2. Market Share Analysis, 2023

            18.23.2.1. By Capacity

            18.23.2.2. By Fabric Type

            18.23.2.3. By Design

            18.23.2.4. By Filling and Discharge

            18.23.2.5. By End User Industry

19. Market Structure Analysis

    19.1. Competition Dashboard

    19.2. Competition Benchmarking

    19.3. Market Share Analysis of Top Players

        19.3.1. By Regional

        19.3.2. By Capacity

        19.3.3. By Fabric Type

        19.3.4. By Design

        19.3.5. By Filling and Discharge

        19.3.6. By End User Industry

20. Competition Analysis

    20.1. Competition Deep Dive

        20.1.1. Berry Global, Inc.

            20.1.1.1. Overview

            20.1.1.2. Product Portfolio

            20.1.1.3. Profitability by Market Segments

            20.1.1.4. Sales Footprint

            20.1.1.5. Strategy Overview

                20.1.1.5.1. Marketing Strategy

                20.1.1.5.2. Product Strategy

                20.1.1.5.3. Channel Strategy

        20.1.2. Intertape Polymer Group

            20.1.2.1. Overview

            20.1.2.2. Product Portfolio

            20.1.2.3. Profitability by Market Segments

            20.1.2.4. Sales Footprint

            20.1.2.5. Strategy Overview

                20.1.2.5.1. Marketing Strategy

                20.1.2.5.2. Product Strategy

                20.1.2.5.3. Channel Strategy

        20.1.3. Conitex Sonoco

            20.1.3.1. Overview

            20.1.3.2. Product Portfolio

            20.1.3.3. Profitability by Market Segments

            20.1.3.4. Sales Footprint

            20.1.3.5. Strategy Overview

                20.1.3.5.1. Marketing Strategy

                20.1.3.5.2. Product Strategy

                20.1.3.5.3. Channel Strategy

        20.1.4. AmeriGlobe L.L.C.

            20.1.4.1. Overview

            20.1.4.2. Product Portfolio

            20.1.4.3. Profitability by Market Segments

            20.1.4.4. Sales Footprint

            20.1.4.5. Strategy Overview

                20.1.4.5.1. Marketing Strategy

                20.1.4.5.2. Product Strategy

                20.1.4.5.3. Channel Strategy

        20.1.5. Greif, Inc.

            20.1.5.1. Overview

            20.1.5.2. Product Portfolio

            20.1.5.3. Profitability by Market Segments

            20.1.5.4. Sales Footprint

            20.1.5.5. Strategy Overview

                20.1.5.5.1. Marketing Strategy

                20.1.5.5.2. Product Strategy

                20.1.5.5.3. Channel Strategy

        20.1.6. Halsted Corporation

            20.1.6.1. Overview

            20.1.6.2. Product Portfolio

            20.1.6.3. Profitability by Market Segments

            20.1.6.4. Sales Footprint

            20.1.6.5. Strategy Overview

                20.1.6.5.1. Marketing Strategy

                20.1.6.5.2. Product Strategy

                20.1.6.5.3. Channel Strategy

        20.1.7. LC Packaging International BV

            20.1.7.1. Overview

            20.1.7.2. Product Portfolio

            20.1.7.3. Profitability by Market Segments

            20.1.7.4. Sales Footprint

            20.1.7.5. Strategy Overview

                20.1.7.5.1. Marketing Strategy

                20.1.7.5.2. Product Strategy

                20.1.7.5.3. Channel Strategy

        20.1.8. Sackmaker J&HM Dickson Ltd.

            20.1.8.1. Overview

            20.1.8.2. Product Portfolio

            20.1.8.3. Profitability by Market Segments

            20.1.8.4. Sales Footprint

            20.1.8.5. Strategy Overview

                20.1.8.5.1. Marketing Strategy

                20.1.8.5.2. Product Strategy

                20.1.8.5.3. Channel Strategy

        20.1.9. Emmbi, Inc.

            20.1.9.1. Overview

            20.1.9.2. Product Portfolio

            20.1.9.3. Profitability by Market Segments

            20.1.9.4. Sales Footprint

            20.1.9.5. Strategy Overview

                20.1.9.5.1. Marketing Strategy

                20.1.9.5.2. Product Strategy

                20.1.9.5.3. Channel Strategy

        20.1.10. Bulk Lift International, LLC.

            20.1.10.1. Overview

            20.1.10.2. Product Portfolio

            20.1.10.3. Profitability by Market Segments

            20.1.10.4. Sales Footprint

            20.1.10.5. Strategy Overview

                20.1.10.5.1. Marketing Strategy

                20.1.10.5.2. Product Strategy

                20.1.10.5.3. Channel Strategy

21. Assumptions & Acronyms Used

22. Research Methodology

Don't pay for what you don't need

Customize your report by selecting specific countries or regions and save 30%!

List of Tables

Table 1: Global Market Value (US$ Million) Forecast by Region, 2019 to 2034

Table 2: Global Market Volume (Units) Forecast by Region, 2019 to 2034

Table 3: Global Market Value (US$ Million) Forecast by Capacity, 2019 to 2034

Table 4: Global Market Volume (Units) Forecast by Capacity, 2019 to 2034

Table 5: Global Market Value (US$ Million) Forecast by Fabric Type, 2019 to 2034

Table 6: Global Market Volume (Units) Forecast by Fabric Type, 2019 to 2034

Table 7: Global Market Value (US$ Million) Forecast by Design, 2019 to 2034

Table 8: Global Market Volume (Units) Forecast by Design, 2019 to 2034

Table 9: Global Market Value (US$ Million) Forecast by Filling and Discharge, 2019 to 2034

Table 10: Global Market Volume (Units) Forecast by Filling and Discharge, 2019 to 2034

Table 11: Global Market Value (US$ Million) Forecast by End User Industry, 2019 to 2034

Table 12: Global Market Volume (Units) Forecast by End User Industry, 2019 to 2034

Table 13: North America Market Value (US$ Million) Forecast by Country, 2019 to 2034

Table 14: North America Market Volume (Units) Forecast by Country, 2019 to 2034

Table 15: North America Market Value (US$ Million) Forecast by Capacity, 2019 to 2034

Table 16: North America Market Volume (Units) Forecast by Capacity, 2019 to 2034

Table 17: North America Market Value (US$ Million) Forecast by Fabric Type, 2019 to 2034

Table 18: North America Market Volume (Units) Forecast by Fabric Type, 2019 to 2034

Table 19: North America Market Value (US$ Million) Forecast by Design, 2019 to 2034

Table 20: North America Market Volume (Units) Forecast by Design, 2019 to 2034

Table 21: North America Market Value (US$ Million) Forecast by Filling and Discharge, 2019 to 2034

Table 22: North America Market Volume (Units) Forecast by Filling and Discharge, 2019 to 2034

Table 23: North America Market Value (US$ Million) Forecast by End User Industry, 2019 to 2034

Table 24: North America Market Volume (Units) Forecast by End User Industry, 2019 to 2034

Table 25: Latin America Market Value (US$ Million) Forecast by Country, 2019 to 2034

Table 26: Latin America Market Volume (Units) Forecast by Country, 2019 to 2034

Table 27: Latin America Market Value (US$ Million) Forecast by Capacity, 2019 to 2034

Table 28: Latin America Market Volume (Units) Forecast by Capacity, 2019 to 2034

Table 29: Latin America Market Value (US$ Million) Forecast by Fabric Type, 2019 to 2034

Table 30: Latin America Market Volume (Units) Forecast by Fabric Type, 2019 to 2034

Table 31: Latin America Market Value (US$ Million) Forecast by Design, 2019 to 2034

Table 32: Latin America Market Volume (Units) Forecast by Design, 2019 to 2034

Table 33: Latin America Market Value (US$ Million) Forecast by Filling and Discharge, 2019 to 2034

Table 34: Latin America Market Volume (Units) Forecast by Filling and Discharge, 2019 to 2034

Table 35: Latin America Market Value (US$ Million) Forecast by End User Industry, 2019 to 2034

Table 36: Latin America Market Volume (Units) Forecast by End User Industry, 2019 to 2034

Table 37: Western Europe Market Value (US$ Million) Forecast by Country, 2019 to 2034

Table 38: Western Europe Market Volume (Units) Forecast by Country, 2019 to 2034

Table 39: Western Europe Market Value (US$ Million) Forecast by Capacity, 2019 to 2034

Table 40: Western Europe Market Volume (Units) Forecast by Capacity, 2019 to 2034

Table 41: Western Europe Market Value (US$ Million) Forecast by Fabric Type, 2019 to 2034

Table 42: Western Europe Market Volume (Units) Forecast by Fabric Type, 2019 to 2034

Table 43: Western Europe Market Value (US$ Million) Forecast by Design, 2019 to 2034

Table 44: Western Europe Market Volume (Units) Forecast by Design, 2019 to 2034

Table 45: Western Europe Market Value (US$ Million) Forecast by Filling and Discharge, 2019 to 2034

Table 46: Western Europe Market Volume (Units) Forecast by Filling and Discharge, 2019 to 2034

Table 47: Western Europe Market Value (US$ Million) Forecast by End User Industry, 2019 to 2034

Table 48: Western Europe Market Volume (Units) Forecast by End User Industry, 2019 to 2034

Table 49: Eastern Europe Market Value (US$ Million) Forecast by Country, 2019 to 2034

Table 50: Eastern Europe Market Volume (Units) Forecast by Country, 2019 to 2034

Table 51: Eastern Europe Market Value (US$ Million) Forecast by Capacity, 2019 to 2034

Table 52: Eastern Europe Market Volume (Units) Forecast by Capacity, 2019 to 2034

Table 53: Eastern Europe Market Value (US$ Million) Forecast by Fabric Type, 2019 to 2034

Table 54: Eastern Europe Market Volume (Units) Forecast by Fabric Type, 2019 to 2034

Table 55: Eastern Europe Market Value (US$ Million) Forecast by Design, 2019 to 2034

Table 56: Eastern Europe Market Volume (Units) Forecast by Design, 2019 to 2034

Table 57: Eastern Europe Market Value (US$ Million) Forecast by Filling and Discharge, 2019 to 2034

Table 58: Eastern Europe Market Volume (Units) Forecast by Filling and Discharge, 2019 to 2034

Table 59: Eastern Europe Market Value (US$ Million) Forecast by End User Industry, 2019 to 2034

Table 60: Eastern Europe Market Volume (Units) Forecast by End User Industry, 2019 to 2034

Table 61: South Asia and Pacific Market Value (US$ Million) Forecast by Country, 2019 to 2034

Table 62: South Asia and Pacific Market Volume (Units) Forecast by Country, 2019 to 2034

Table 63: South Asia and Pacific Market Value (US$ Million) Forecast by Capacity, 2019 to 2034

Table 64: South Asia and Pacific Market Volume (Units) Forecast by Capacity, 2019 to 2034

Table 65: South Asia and Pacific Market Value (US$ Million) Forecast by Fabric Type, 2019 to 2034

Table 66: South Asia and Pacific Market Volume (Units) Forecast by Fabric Type, 2019 to 2034

Table 67: South Asia and Pacific Market Value (US$ Million) Forecast by Design, 2019 to 2034

Table 68: South Asia and Pacific Market Volume (Units) Forecast by Design, 2019 to 2034

Table 69: South Asia and Pacific Market Value (US$ Million) Forecast by Filling and Discharge, 2019 to 2034

Table 70: South Asia and Pacific Market Volume (Units) Forecast by Filling and Discharge, 2019 to 2034

Table 71: South Asia and Pacific Market Value (US$ Million) Forecast by End User Industry, 2019 to 2034

Table 72: South Asia and Pacific Market Volume (Units) Forecast by End User Industry, 2019 to 2034

Table 73: East Asia Market Value (US$ Million) Forecast by Country, 2019 to 2034

Table 74: East Asia Market Volume (Units) Forecast by Country, 2019 to 2034

Table 75: East Asia Market Value (US$ Million) Forecast by Capacity, 2019 to 2034

Table 76: East Asia Market Volume (Units) Forecast by Capacity, 2019 to 2034

Table 77: East Asia Market Value (US$ Million) Forecast by Fabric Type, 2019 to 2034

Table 78: East Asia Market Volume (Units) Forecast by Fabric Type, 2019 to 2034

Table 79: East Asia Market Value (US$ Million) Forecast by Design, 2019 to 2034

Table 80: East Asia Market Volume (Units) Forecast by Design, 2019 to 2034

Table 81: East Asia Market Value (US$ Million) Forecast by Filling and Discharge, 2019 to 2034

Table 82: East Asia Market Volume (Units) Forecast by Filling and Discharge, 2019 to 2034

Table 83: East Asia Market Value (US$ Million) Forecast by End User Industry, 2019 to 2034

Table 84: East Asia Market Volume (Units) Forecast by End User Industry, 2019 to 2034

Table 85: Middle East and Africa Market Value (US$ Million) Forecast by Country, 2019 to 2034

Table 86: Middle East and Africa Market Volume (Units) Forecast by Country, 2019 to 2034

Table 87: Middle East and Africa Market Value (US$ Million) Forecast by Capacity, 2019 to 2034

Table 88: Middle East and Africa Market Volume (Units) Forecast by Capacity, 2019 to 2034

Table 89: Middle East and Africa Market Value (US$ Million) Forecast by Fabric Type, 2019 to 2034

Table 90: Middle East and Africa Market Volume (Units) Forecast by Fabric Type, 2019 to 2034

Table 91: Middle East and Africa Market Value (US$ Million) Forecast by Design, 2019 to 2034

Table 92: Middle East and Africa Market Volume (Units) Forecast by Design, 2019 to 2034

Table 93: Middle East and Africa Market Value (US$ Million) Forecast by Filling and Discharge, 2019 to 2034

Table 94: Middle East and Africa Market Volume (Units) Forecast by Filling and Discharge, 2019 to 2034

Table 95: Middle East and Africa Market Value (US$ Million) Forecast by End User Industry, 2019 to 2034

Table 96: Middle East and Africa Market Volume (Units) Forecast by End User Industry, 2019 to 2034
Ismail Sutaria
Ismail Sutaria

Principal Consultant

Talk to Analyst

Find your sweet spots for generating winning opportunities in this market.

List of Charts

Figure 1: Global Market Value (US$ Million) by Capacity, 2024 to 2034

Figure 2: Global Market Value (US$ Million) by Fabric Type, 2024 to 2034

Figure 3: Global Market Value (US$ Million) by Design, 2024 to 2034

Figure 4: Global Market Value (US$ Million) by Filling and Discharge, 2024 to 2034

Figure 5: Global Market Value (US$ Million) by End User Industry, 2024 to 2034

Figure 6: Global Market Value (US$ Million) by Region, 2024 to 2034

Figure 7: Global Market Value (US$ Million) Analysis by Region, 2019 to 2034

Figure 8: Global Market Volume (Units) Analysis by Region, 2019 to 2034

Figure 9: Global Market Value Share (%) and BPS Analysis by Region, 2024 to 2034

Figure 10: Global Market Y-o-Y Growth (%) Projections by Region, 2024 to 2034

Figure 11: Global Market Value (US$ Million) Analysis by Capacity, 2019 to 2034

Figure 12: Global Market Volume (Units) Analysis by Capacity, 2019 to 2034

Figure 13: Global Market Value Share (%) and BPS Analysis by Capacity, 2024 to 2034

Figure 14: Global Market Y-o-Y Growth (%) Projections by Capacity, 2024 to 2034

Figure 15: Global Market Value (US$ Million) Analysis by Fabric Type, 2019 to 2034

Figure 16: Global Market Volume (Units) Analysis by Fabric Type, 2019 to 2034

Figure 17: Global Market Value Share (%) and BPS Analysis by Fabric Type, 2024 to 2034

Figure 18: Global Market Y-o-Y Growth (%) Projections by Fabric Type, 2024 to 2034

Figure 19: Global Market Value (US$ Million) Analysis by Design, 2019 to 2034

Figure 20: Global Market Volume (Units) Analysis by Design, 2019 to 2034

Figure 21: Global Market Value Share (%) and BPS Analysis by Design, 2024 to 2034

Figure 22: Global Market Y-o-Y Growth (%) Projections by Design, 2024 to 2034

Figure 23: Global Market Value (US$ Million) Analysis by Filling and Discharge, 2019 to 2034

Figure 24: Global Market Volume (Units) Analysis by Filling and Discharge, 2019 to 2034

Figure 25: Global Market Value Share (%) and BPS Analysis by Filling and Discharge, 2024 to 2034

Figure 26: Global Market Y-o-Y Growth (%) Projections by Filling and Discharge, 2024 to 2034

Figure 27: Global Market Value (US$ Million) Analysis by End User Industry, 2019 to 2034

Figure 28: Global Market Volume (Units) Analysis by End User Industry, 2019 to 2034

Figure 29: Global Market Value Share (%) and BPS Analysis by End User Industry, 2024 to 2034

Figure 30: Global Market Y-o-Y Growth (%) Projections by End User Industry, 2024 to 2034

Figure 31: Global Market Attractiveness by Capacity, 2024 to 2034

Figure 32: Global Market Attractiveness by Fabric Type, 2024 to 2034

Figure 33: Global Market Attractiveness by Design, 2024 to 2034

Figure 34: Global Market Attractiveness by Filling and Discharge, 2024 to 2034

Figure 35: Global Market Attractiveness by End User Industry, 2024 to 2034

Figure 36: Global Market Attractiveness by Region, 2024 to 2034

Figure 37: North America Market Value (US$ Million) by Capacity, 2024 to 2034

Figure 38: North America Market Value (US$ Million) by Fabric Type, 2024 to 2034

Figure 39: North America Market Value (US$ Million) by Design, 2024 to 2034

Figure 40: North America Market Value (US$ Million) by Filling and Discharge, 2024 to 2034

Figure 41: North America Market Value (US$ Million) by End User Industry, 2024 to 2034

Figure 42: North America Market Value (US$ Million) by Country, 2024 to 2034

Figure 43: North America Market Value (US$ Million) Analysis by Country, 2019 to 2034

Figure 44: North America Market Volume (Units) Analysis by Country, 2019 to 2034

Figure 45: North America Market Value Share (%) and BPS Analysis by Country, 2024 to 2034

Figure 46: North America Market Y-o-Y Growth (%) Projections by Country, 2024 to 2034

Figure 47: North America Market Value (US$ Million) Analysis by Capacity, 2019 to 2034

Figure 48: North America Market Volume (Units) Analysis by Capacity, 2019 to 2034

Figure 49: North America Market Value Share (%) and BPS Analysis by Capacity, 2024 to 2034

Figure 50: North America Market Y-o-Y Growth (%) Projections by Capacity, 2024 to 2034

Figure 51: North America Market Value (US$ Million) Analysis by Fabric Type, 2019 to 2034

Figure 52: North America Market Volume (Units) Analysis by Fabric Type, 2019 to 2034

Figure 53: North America Market Value Share (%) and BPS Analysis by Fabric Type, 2024 to 2034

Figure 54: North America Market Y-o-Y Growth (%) Projections by Fabric Type, 2024 to 2034

Figure 55: North America Market Value (US$ Million) Analysis by Design, 2019 to 2034

Figure 56: North America Market Volume (Units) Analysis by Design, 2019 to 2034

Figure 57: North America Market Value Share (%) and BPS Analysis by Design, 2024 to 2034

Figure 58: North America Market Y-o-Y Growth (%) Projections by Design, 2024 to 2034

Figure 59: North America Market Value (US$ Million) Analysis by Filling and Discharge, 2019 to 2034

Figure 60: North America Market Volume (Units) Analysis by Filling and Discharge, 2019 to 2034

Figure 61: North America Market Value Share (%) and BPS Analysis by Filling and Discharge, 2024 to 2034

Figure 62: North America Market Y-o-Y Growth (%) Projections by Filling and Discharge, 2024 to 2034

Figure 63: North America Market Value (US$ Million) Analysis by End User Industry, 2019 to 2034

Figure 64: North America Market Volume (Units) Analysis by End User Industry, 2019 to 2034

Figure 65: North America Market Value Share (%) and BPS Analysis by End User Industry, 2024 to 2034

Figure 66: North America Market Y-o-Y Growth (%) Projections by End User Industry, 2024 to 2034

Figure 67: North America Market Attractiveness by Capacity, 2024 to 2034

Figure 68: North America Market Attractiveness by Fabric Type, 2024 to 2034

Figure 69: North America Market Attractiveness by Design, 2024 to 2034

Figure 70: North America Market Attractiveness by Filling and Discharge, 2024 to 2034

Figure 71: North America Market Attractiveness by End User Industry, 2024 to 2034

Figure 72: North America Market Attractiveness by Country, 2024 to 2034

Figure 73: Latin America Market Value (US$ Million) by Capacity, 2024 to 2034

Figure 74: Latin America Market Value (US$ Million) by Fabric Type, 2024 to 2034

Figure 75: Latin America Market Value (US$ Million) by Design, 2024 to 2034

Figure 76: Latin America Market Value (US$ Million) by Filling and Discharge, 2024 to 2034

Figure 77: Latin America Market Value (US$ Million) by End User Industry, 2024 to 2034

Figure 78: Latin America Market Value (US$ Million) by Country, 2024 to 2034

Figure 79: Latin America Market Value (US$ Million) Analysis by Country, 2019 to 2034

Figure 80: Latin America Market Volume (Units) Analysis by Country, 2019 to 2034

Figure 81: Latin America Market Value Share (%) and BPS Analysis by Country, 2024 to 2034

Figure 82: Latin America Market Y-o-Y Growth (%) Projections by Country, 2024 to 2034

Figure 83: Latin America Market Value (US$ Million) Analysis by Capacity, 2019 to 2034

Figure 84: Latin America Market Volume (Units) Analysis by Capacity, 2019 to 2034

Figure 85: Latin America Market Value Share (%) and BPS Analysis by Capacity, 2024 to 2034

Figure 86: Latin America Market Y-o-Y Growth (%) Projections by Capacity, 2024 to 2034

Figure 87: Latin America Market Value (US$ Million) Analysis by Fabric Type, 2019 to 2034

Figure 88: Latin America Market Volume (Units) Analysis by Fabric Type, 2019 to 2034

Figure 89: Latin America Market Value Share (%) and BPS Analysis by Fabric Type, 2024 to 2034

Figure 90: Latin America Market Y-o-Y Growth (%) Projections by Fabric Type, 2024 to 2034

Figure 91: Latin America Market Value (US$ Million) Analysis by Design, 2019 to 2034

Figure 92: Latin America Market Volume (Units) Analysis by Design, 2019 to 2034

Figure 93: Latin America Market Value Share (%) and BPS Analysis by Design, 2024 to 2034

Figure 94: Latin America Market Y-o-Y Growth (%) Projections by Design, 2024 to 2034

Figure 95: Latin America Market Value (US$ Million) Analysis by Filling and Discharge, 2019 to 2034

Figure 96: Latin America Market Volume (Units) Analysis by Filling and Discharge, 2019 to 2034

Figure 97: Latin America Market Value Share (%) and BPS Analysis by Filling and Discharge, 2024 to 2034

Figure 98: Latin America Market Y-o-Y Growth (%) Projections by Filling and Discharge, 2024 to 2034

Figure 99: Latin America Market Value (US$ Million) Analysis by End User Industry, 2019 to 2034

Figure 100: Latin America Market Volume (Units) Analysis by End User Industry, 2019 to 2034

Figure 101: Latin America Market Value Share (%) and BPS Analysis by End User Industry, 2024 to 2034

Figure 102: Latin America Market Y-o-Y Growth (%) Projections by End User Industry, 2024 to 2034

Figure 103: Latin America Market Attractiveness by Capacity, 2024 to 2034

Figure 104: Latin America Market Attractiveness by Fabric Type, 2024 to 2034

Figure 105: Latin America Market Attractiveness by Design, 2024 to 2034

Figure 106: Latin America Market Attractiveness by Filling and Discharge, 2024 to 2034

Figure 107: Latin America Market Attractiveness by End User Industry, 2024 to 2034

Figure 108: Latin America Market Attractiveness by Country, 2024 to 2034

Figure 109: Western Europe Market Value (US$ Million) by Capacity, 2024 to 2034

Figure 110: Western Europe Market Value (US$ Million) by Fabric Type, 2024 to 2034

Figure 111: Western Europe Market Value (US$ Million) by Design, 2024 to 2034

Figure 112: Western Europe Market Value (US$ Million) by Filling and Discharge, 2024 to 2034

Figure 113: Western Europe Market Value (US$ Million) by End User Industry, 2024 to 2034

Figure 114: Western Europe Market Value (US$ Million) by Country, 2024 to 2034

Figure 115: Western Europe Market Value (US$ Million) Analysis by Country, 2019 to 2034

Figure 116: Western Europe Market Volume (Units) Analysis by Country, 2019 to 2034

Figure 117: Western Europe Market Value Share (%) and BPS Analysis by Country, 2024 to 2034

Figure 118: Western Europe Market Y-o-Y Growth (%) Projections by Country, 2024 to 2034

Figure 119: Western Europe Market Value (US$ Million) Analysis by Capacity, 2019 to 2034

Figure 120: Western Europe Market Volume (Units) Analysis by Capacity, 2019 to 2034

Figure 121: Western Europe Market Value Share (%) and BPS Analysis by Capacity, 2024 to 2034

Figure 122: Western Europe Market Y-o-Y Growth (%) Projections by Capacity, 2024 to 2034

Figure 123: Western Europe Market Value (US$ Million) Analysis by Fabric Type, 2019 to 2034

Figure 124: Western Europe Market Volume (Units) Analysis by Fabric Type, 2019 to 2034

Figure 125: Western Europe Market Value Share (%) and BPS Analysis by Fabric Type, 2024 to 2034

Figure 126: Western Europe Market Y-o-Y Growth (%) Projections by Fabric Type, 2024 to 2034

Figure 127: Western Europe Market Value (US$ Million) Analysis by Design, 2019 to 2034

Figure 128: Western Europe Market Volume (Units) Analysis by Design, 2019 to 2034

Figure 129: Western Europe Market Value Share (%) and BPS Analysis by Design, 2024 to 2034

Figure 130: Western Europe Market Y-o-Y Growth (%) Projections by Design, 2024 to 2034

Figure 131: Western Europe Market Value (US$ Million) Analysis by Filling and Discharge, 2019 to 2034

Figure 132: Western Europe Market Volume (Units) Analysis by Filling and Discharge, 2019 to 2034

Figure 133: Western Europe Market Value Share (%) and BPS Analysis by Filling and Discharge, 2024 to 2034

Figure 134: Western Europe Market Y-o-Y Growth (%) Projections by Filling and Discharge, 2024 to 2034

Figure 135: Western Europe Market Value (US$ Million) Analysis by End User Industry, 2019 to 2034

Figure 136: Western Europe Market Volume (Units) Analysis by End User Industry, 2019 to 2034

Figure 137: Western Europe Market Value Share (%) and BPS Analysis by End User Industry, 2024 to 2034

Figure 138: Western Europe Market Y-o-Y Growth (%) Projections by End User Industry, 2024 to 2034

Figure 139: Western Europe Market Attractiveness by Capacity, 2024 to 2034

Figure 140: Western Europe Market Attractiveness by Fabric Type, 2024 to 2034

Figure 141: Western Europe Market Attractiveness by Design, 2024 to 2034

Figure 142: Western Europe Market Attractiveness by Filling and Discharge, 2024 to 2034

Figure 143: Western Europe Market Attractiveness by End User Industry, 2024 to 2034

Figure 144: Western Europe Market Attractiveness by Country, 2024 to 2034

Figure 145: Eastern Europe Market Value (US$ Million) by Capacity, 2024 to 2034

Figure 146: Eastern Europe Market Value (US$ Million) by Fabric Type, 2024 to 2034

Figure 147: Eastern Europe Market Value (US$ Million) by Design, 2024 to 2034

Figure 148: Eastern Europe Market Value (US$ Million) by Filling and Discharge, 2024 to 2034

Figure 149: Eastern Europe Market Value (US$ Million) by End User Industry, 2024 to 2034

Figure 150: Eastern Europe Market Value (US$ Million) by Country, 2024 to 2034

Figure 151: Eastern Europe Market Value (US$ Million) Analysis by Country, 2019 to 2034

Figure 152: Eastern Europe Market Volume (Units) Analysis by Country, 2019 to 2034

Figure 153: Eastern Europe Market Value Share (%) and BPS Analysis by Country, 2024 to 2034

Figure 154: Eastern Europe Market Y-o-Y Growth (%) Projections by Country, 2024 to 2034

Figure 155: Eastern Europe Market Value (US$ Million) Analysis by Capacity, 2019 to 2034

Figure 156: Eastern Europe Market Volume (Units) Analysis by Capacity, 2019 to 2034

Figure 157: Eastern Europe Market Value Share (%) and BPS Analysis by Capacity, 2024 to 2034

Figure 158: Eastern Europe Market Y-o-Y Growth (%) Projections by Capacity, 2024 to 2034

Figure 159: Eastern Europe Market Value (US$ Million) Analysis by Fabric Type, 2019 to 2034

Figure 160: Eastern Europe Market Volume (Units) Analysis by Fabric Type, 2019 to 2034

Figure 161: Eastern Europe Market Value Share (%) and BPS Analysis by Fabric Type, 2024 to 2034

Figure 162: Eastern Europe Market Y-o-Y Growth (%) Projections by Fabric Type, 2024 to 2034

Figure 163: Eastern Europe Market Value (US$ Million) Analysis by Design, 2019 to 2034

Figure 164: Eastern Europe Market Volume (Units) Analysis by Design, 2019 to 2034

Figure 165: Eastern Europe Market Value Share (%) and BPS Analysis by Design, 2024 to 2034

Figure 166: Eastern Europe Market Y-o-Y Growth (%) Projections by Design, 2024 to 2034

Figure 167: Eastern Europe Market Value (US$ Million) Analysis by Filling and Discharge, 2019 to 2034

Figure 168: Eastern Europe Market Volume (Units) Analysis by Filling and Discharge, 2019 to 2034

Figure 169: Eastern Europe Market Value Share (%) and BPS Analysis by Filling and Discharge, 2024 to 2034

Figure 170: Eastern Europe Market Y-o-Y Growth (%) Projections by Filling and Discharge, 2024 to 2034

Figure 171: Eastern Europe Market Value (US$ Million) Analysis by End User Industry, 2019 to 2034

Figure 172: Eastern Europe Market Volume (Units) Analysis by End User Industry, 2019 to 2034

Figure 173: Eastern Europe Market Value Share (%) and BPS Analysis by End User Industry, 2024 to 2034

Figure 174: Eastern Europe Market Y-o-Y Growth (%) Projections by End User Industry, 2024 to 2034

Figure 175: Eastern Europe Market Attractiveness by Capacity, 2024 to 2034

Figure 176: Eastern Europe Market Attractiveness by Fabric Type, 2024 to 2034

Figure 177: Eastern Europe Market Attractiveness by Design, 2024 to 2034

Figure 178: Eastern Europe Market Attractiveness by Filling and Discharge, 2024 to 2034

Figure 179: Eastern Europe Market Attractiveness by End User Industry, 2024 to 2034

Figure 180: Eastern Europe Market Attractiveness by Country, 2024 to 2034

Figure 181: South Asia and Pacific Market Value (US$ Million) by Capacity, 2024 to 2034

Figure 182: South Asia and Pacific Market Value (US$ Million) by Fabric Type, 2024 to 2034

Figure 183: South Asia and Pacific Market Value (US$ Million) by Design, 2024 to 2034

Figure 184: South Asia and Pacific Market Value (US$ Million) by Filling and Discharge, 2024 to 2034

Figure 185: South Asia and Pacific Market Value (US$ Million) by End User Industry, 2024 to 2034

Figure 186: South Asia and Pacific Market Value (US$ Million) by Country, 2024 to 2034

Figure 187: South Asia and Pacific Market Value (US$ Million) Analysis by Country, 2019 to 2034

Figure 188: South Asia and Pacific Market Volume (Units) Analysis by Country, 2019 to 2034

Figure 189: South Asia and Pacific Market Value Share (%) and BPS Analysis by Country, 2024 to 2034

Figure 190: South Asia and Pacific Market Y-o-Y Growth (%) Projections by Country, 2024 to 2034

Figure 191: South Asia and Pacific Market Value (US$ Million) Analysis by Capacity, 2019 to 2034

Figure 192: South Asia and Pacific Market Volume (Units) Analysis by Capacity, 2019 to 2034

Figure 193: South Asia and Pacific Market Value Share (%) and BPS Analysis by Capacity, 2024 to 2034

Figure 194: South Asia and Pacific Market Y-o-Y Growth (%) Projections by Capacity, 2024 to 2034

Figure 195: South Asia and Pacific Market Value (US$ Million) Analysis by Fabric Type, 2019 to 2034

Figure 196: South Asia and Pacific Market Volume (Units) Analysis by Fabric Type, 2019 to 2034

Figure 197: South Asia and Pacific Market Value Share (%) and BPS Analysis by Fabric Type, 2024 to 2034

Figure 198: South Asia and Pacific Market Y-o-Y Growth (%) Projections by Fabric Type, 2024 to 2034

Figure 199: South Asia and Pacific Market Value (US$ Million) Analysis by Design, 2019 to 2034

Figure 200: South Asia and Pacific Market Volume (Units) Analysis by Design, 2019 to 2034

Figure 201: South Asia and Pacific Market Value Share (%) and BPS Analysis by Design, 2024 to 2034

Figure 202: South Asia and Pacific Market Y-o-Y Growth (%) Projections by Design, 2024 to 2034

Figure 203: South Asia and Pacific Market Value (US$ Million) Analysis by Filling and Discharge, 2019 to 2034

Figure 204: South Asia and Pacific Market Volume (Units) Analysis by Filling and Discharge, 2019 to 2034

Figure 205: South Asia and Pacific Market Value Share (%) and BPS Analysis by Filling and Discharge, 2024 to 2034

Figure 206: South Asia and Pacific Market Y-o-Y Growth (%) Projections by Filling and Discharge, 2024 to 2034

Figure 207: South Asia and Pacific Market Value (US$ Million) Analysis by End User Industry, 2019 to 2034

Figure 208: South Asia and Pacific Market Volume (Units) Analysis by End User Industry, 2019 to 2034

Figure 209: South Asia and Pacific Market Value Share (%) and BPS Analysis by End User Industry, 2024 to 2034

Figure 210: South Asia and Pacific Market Y-o-Y Growth (%) Projections by End User Industry, 2024 to 2034

Figure 211: South Asia and Pacific Market Attractiveness by Capacity, 2024 to 2034

Figure 212: South Asia and Pacific Market Attractiveness by Fabric Type, 2024 to 2034

Figure 213: South Asia and Pacific Market Attractiveness by Design, 2024 to 2034

Figure 214: South Asia and Pacific Market Attractiveness by Filling and Discharge, 2024 to 2034

Figure 215: South Asia and Pacific Market Attractiveness by End User Industry, 2024 to 2034

Figure 216: South Asia and Pacific Market Attractiveness by Country, 2024 to 2034

Figure 217: East Asia Market Value (US$ Million) by Capacity, 2024 to 2034

Figure 218: East Asia Market Value (US$ Million) by Fabric Type, 2024 to 2034

Figure 219: East Asia Market Value (US$ Million) by Design, 2024 to 2034

Figure 220: East Asia Market Value (US$ Million) by Filling and Discharge, 2024 to 2034

Figure 221: East Asia Market Value (US$ Million) by End User Industry, 2024 to 2034

Figure 222: East Asia Market Value (US$ Million) by Country, 2024 to 2034

Figure 223: East Asia Market Value (US$ Million) Analysis by Country, 2019 to 2034

Figure 224: East Asia Market Volume (Units) Analysis by Country, 2019 to 2034

Figure 225: East Asia Market Value Share (%) and BPS Analysis by Country, 2024 to 2034

Figure 226: East Asia Market Y-o-Y Growth (%) Projections by Country, 2024 to 2034

Figure 227: East Asia Market Value (US$ Million) Analysis by Capacity, 2019 to 2034

Figure 228: East Asia Market Volume (Units) Analysis by Capacity, 2019 to 2034

Figure 229: East Asia Market Value Share (%) and BPS Analysis by Capacity, 2024 to 2034

Figure 230: East Asia Market Y-o-Y Growth (%) Projections by Capacity, 2024 to 2034

Figure 231: East Asia Market Value (US$ Million) Analysis by Fabric Type, 2019 to 2034

Figure 232: East Asia Market Volume (Units) Analysis by Fabric Type, 2019 to 2034

Figure 233: East Asia Market Value Share (%) and BPS Analysis by Fabric Type, 2024 to 2034

Figure 234: East Asia Market Y-o-Y Growth (%) Projections by Fabric Type, 2024 to 2034

Figure 235: East Asia Market Value (US$ Million) Analysis by Design, 2019 to 2034

Figure 236: East Asia Market Volume (Units) Analysis by Design, 2019 to 2034

Figure 237: East Asia Market Value Share (%) and BPS Analysis by Design, 2024 to 2034

Figure 238: East Asia Market Y-o-Y Growth (%) Projections by Design, 2024 to 2034

Figure 239: East Asia Market Value (US$ Million) Analysis by Filling and Discharge, 2019 to 2034

Figure 240: East Asia Market Volume (Units) Analysis by Filling and Discharge, 2019 to 2034

Figure 241: East Asia Market Value Share (%) and BPS Analysis by Filling and Discharge, 2024 to 2034

Figure 242: East Asia Market Y-o-Y Growth (%) Projections by Filling and Discharge, 2024 to 2034

Figure 243: East Asia Market Value (US$ Million) Analysis by End User Industry, 2019 to 2034

Figure 244: East Asia Market Volume (Units) Analysis by End User Industry, 2019 to 2034

Figure 245: East Asia Market Value Share (%) and BPS Analysis by End User Industry, 2024 to 2034

Figure 246: East Asia Market Y-o-Y Growth (%) Projections by End User Industry, 2024 to 2034

Figure 247: East Asia Market Attractiveness by Capacity, 2024 to 2034

Figure 248: East Asia Market Attractiveness by Fabric Type, 2024 to 2034

Figure 249: East Asia Market Attractiveness by Design, 2024 to 2034

Figure 250: East Asia Market Attractiveness by Filling and Discharge, 2024 to 2034

Figure 251: East Asia Market Attractiveness by End User Industry, 2024 to 2034

Figure 252: East Asia Market Attractiveness by Country, 2024 to 2034

Figure 253: Middle East and Africa Market Value (US$ Million) by Capacity, 2024 to 2034

Figure 254: Middle East and Africa Market Value (US$ Million) by Fabric Type, 2024 to 2034

Figure 255: Middle East and Africa Market Value (US$ Million) by Design, 2024 to 2034

Figure 256: Middle East and Africa Market Value (US$ Million) by Filling and Discharge, 2024 to 2034

Figure 257: Middle East and Africa Market Value (US$ Million) by End User Industry, 2024 to 2034

Figure 258: Middle East and Africa Market Value (US$ Million) by Country, 2024 to 2034

Figure 259: Middle East and Africa Market Value (US$ Million) Analysis by Country, 2019 to 2034

Figure 260: Middle East and Africa Market Volume (Units) Analysis by Country, 2019 to 2034

Figure 261: Middle East and Africa Market Value Share (%) and BPS Analysis by Country, 2024 to 2034

Figure 262: Middle East and Africa Market Y-o-Y Growth (%) Projections by Country, 2024 to 2034

Figure 263: Middle East and Africa Market Value (US$ Million) Analysis by Capacity, 2019 to 2034

Figure 264: Middle East and Africa Market Volume (Units) Analysis by Capacity, 2019 to 2034

Figure 265: Middle East and Africa Market Value Share (%) and BPS Analysis by Capacity, 2024 to 2034

Figure 266: Middle East and Africa Market Y-o-Y Growth (%) Projections by Capacity, 2024 to 2034

Figure 267: Middle East and Africa Market Value (US$ Million) Analysis by Fabric Type, 2019 to 2034

Figure 268: Middle East and Africa Market Volume (Units) Analysis by Fabric Type, 2019 to 2034

Figure 269: Middle East and Africa Market Value Share (%) and BPS Analysis by Fabric Type, 2024 to 2034

Figure 270: Middle East and Africa Market Y-o-Y Growth (%) Projections by Fabric Type, 2024 to 2034

Figure 271: Middle East and Africa Market Value (US$ Million) Analysis by Design, 2019 to 2034

Figure 272: Middle East and Africa Market Volume (Units) Analysis by Design, 2019 to 2034

Figure 273: Middle East and Africa Market Value Share (%) and BPS Analysis by Design, 2024 to 2034

Figure 274: Middle East and Africa Market Y-o-Y Growth (%) Projections by Design, 2024 to 2034

Figure 275: Middle East and Africa Market Value (US$ Million) Analysis by Filling and Discharge, 2019 to 2034

Figure 276: Middle East and Africa Market Volume (Units) Analysis by Filling and Discharge, 2019 to 2034

Figure 277: Middle East and Africa Market Value Share (%) and BPS Analysis by Filling and Discharge, 2024 to 2034

Figure 278: Middle East and Africa Market Y-o-Y Growth (%) Projections by Filling and Discharge, 2024 to 2034

Figure 279: Middle East and Africa Market Value (US$ Million) Analysis by End User Industry, 2019 to 2034

Figure 280: Middle East and Africa Market Volume (Units) Analysis by End User Industry, 2019 to 2034

Figure 281: Middle East and Africa Market Value Share (%) and BPS Analysis by End User Industry, 2024 to 2034

Figure 282: Middle East and Africa Market Y-o-Y Growth (%) Projections by End User Industry, 2024 to 2034

Figure 283: Middle East and Africa Market Attractiveness by Capacity, 2024 to 2034

Figure 284: Middle East and Africa Market Attractiveness by Fabric Type, 2024 to 2034

Figure 285: Middle East and Africa Market Attractiveness by Design, 2024 to 2034

Figure 286: Middle East and Africa Market Attractiveness by Filling and Discharge, 2024 to 2034

Figure 287: Middle East and Africa Market Attractiveness by End User Industry, 2024 to 2034

Figure 288: Middle East and Africa Market Attractiveness by Country, 2024 to 2034

Recommendations

Packaging

Bulk Bag Divider Market

Published : July 2022

Packaging

Europe Bulk Bags Market

Published : March 2021

Explore Packaging Insights

View Reports