Reports
- Global Locations -
Headquarters
Future Market Insights, Inc.
Christiana Corporate, 200
Continental Drive, Suite 401,
Newark, Delaware - 19713,
United States
Americas
Future Market Insights, Inc.
616 Corporate Way, Suite 2-9018,
Valley Cottage, NY 10989, United States
MEA
Future Market Insights
1602-6 Jumeirah Bay X2 Tower, Plot No: JLT-PH2-X2A,
Jumeirah Lakes Towers, Dubai,
United Arab Emirates
Europe
Future Market Insights
3rd Floor, 207 Regent Street,
W1B 3HH London
United Kingdom
Asia Pacific
Future Market Insights
Office No. 401-A, 4th Floor,
VANTAGE 9, S.No. 36/1/1,
Baner, Pune 411045, India
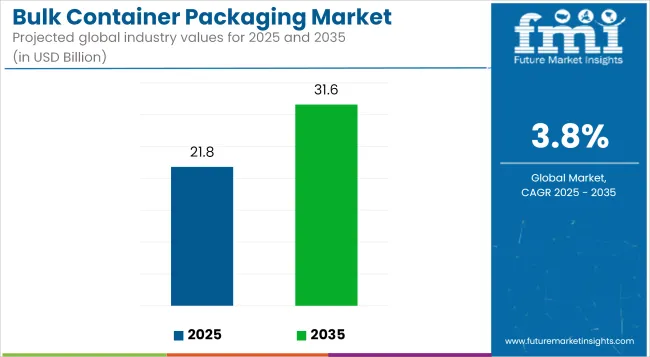
[198 Pages Report] The global bulk container packaging market is slated to witness a stellar CAGR of 6.3% between 2022 and 2031, reaching US$ 34.1 Billion by the year 2031.
Attribute | Details |
---|---|
Bulk Container Packaging Market Size (2022) | US$ 18 Billion |
Projected Market Value (2031) | US$ 34.1 Billion |
Global Market Growth Rate (2022 to 2031) | 6.3% CAGR |
Collective Value Share: Top 5 Companies (2022E) | 15% |
The growth of the business of shipping industrial chemicals in bulk amounts has led to innovation in the production of different bulk containers. Apart from this, the demand for better and non-contaminated food and beverage delivery is enabling wider adoption of bulk containers. The hiking usage of these bulk containers in industrial sectors is expected to continue as a favorable business across the globe.
Don't pay for what you don't need
Customize your report by selecting specific countries or regions and save 30%!
Particulars | Details |
---|---|
H1 2021 | 3.1% |
H1 2022 Projected | 4.2% |
H1 2022 Expected | 4.5% |
BPS Change - H1, 2022 (O) - H1, 2022 (P) | (+) 30 ↑ |
BPS Change - H1, 2022 (O) - H1, 2021 | (+) 140 ↑ |
Future Market Insights predict a comparison and review analysis of the dynamics of the bulk container packaging market, which is principally subjected to an array of industry factors along with a few definite influences concerning high initial CAPEX expenditure and not economical for a site-to-site transfer.
Some new advances that have taken place in the market include the use of bulk containers equipped with a tracking-enabling system to allow customers to know the status of their respective products directly. In March 2022, the Mondi Group expanded its production and warehouse capacity for containerboard mills to serve customers more efficiently.
The market for bulk container packaging is expected to surge by 140 basis share points (BPS) in H1-2022 (O) against comparison with H1-2021, according to an FMI analysis. However, when comparing the H1-2022 projected and H1-2022 outlook period, a rise in BPS change by 30 BPS has been noticed.
The key reason for the change in the growth rate is due to low contamination risk, high payload, and low weight which is anticipated to accelerate the growth of the market. Despite these possibilities, the increasing trade of bulk products further propels the demand for bulk container packaging across the globe.
The requirement of bulk shipping and storing of materials in warehouses has invented the need for bulk container packaging. An entrepreneur named Malcom McLean invented a cost-effective and efficient alternative to moving cargo between New Jersey and Texas in 1956. From then onwards people are preferring the method of “containerization” for transporting bulk shipping materials.
The food & beverage and pharmaceutical industries have remained key to the market for bulk container packaging and it is anticipated that the growing business and startups in the food industry are going to boost the business bulk container packaging market.
Further, consumers’ need for versatile and spill-proof shipping containers has resulted in an increasing demand for bulk container packaging. Such containers keep the stored contents safe even in turbulent journeys. End-users are targeting a single solution to address both - economic transportation and effective storage of the product.
Therefore, flexible and collapsible bulk containers are gaining more popularity these days. This offers the added benefit of minimizing shipping expenses during the return journey and ensures the quality of the stored product.
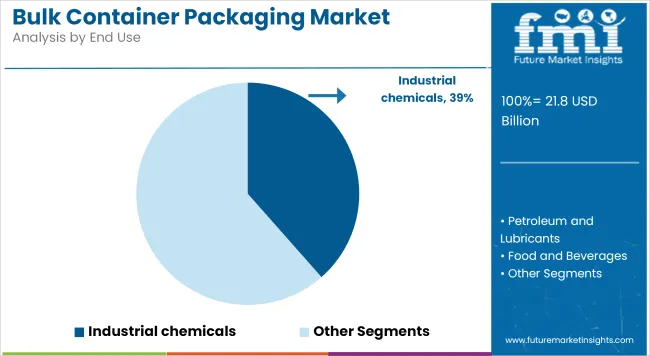
Bulk containers are primarily used for the storage and transportation of large volumes of liquid substrates such as solvents and the most aggressive chemicals. On the other hand, high-quality plastic material-based bulk containers are extremely useful for food and beverage storage, which ensures the optimum freshness of consumable products. Together, industrial chemicals and food & beverage industries are estimated to hold the major pie in the global market during the forecast period.
With the outbreak of Covid-19, the gains from the global bulk container packaging market did shrink significantly between March 2020 and September 2021. As such, the y-o-y growth rate in the year 2020 was reduced by nearly 5% in comparison with 2019.
Restrictions on dine-in restaurants and the slowdown of online food and beverage ordering activities have had an adverse impact on the growth of the food and beverage industry and disrupted the supply chain process. Therefore, a significant influence regarding the demand for bulk container packaging among food and beverage end-users is witnessed.
The post-Covid era is witnessing an increase in the trade of pharmaceutical products and chemicals among various countries. Manufacturers are emphasizing on sterile bulk container packaging for ensuring product safety of medicines and drugs during transit, which would boost the sales of bulk container packaging in the global market.
“Handiness with regards to Transportation to take the pie”
Bulk container packaging ensures easy maneuverable and transportability of large volumes of the product. It is made up of same dimensions of cargo pallets, which results in easy maneuvering of the container using forklifts.
Flexitanks and flexible bulk containers are the ideal packaging solutions for Returnable Transport Packaging (RTP) as they consume less space during the return journey and minimize transport costs.
As per FMI’s analysis, a higher profitability margin is expected with the expanded use of large-sized, higher-value reusable bulk containers that are cost-efficient over small containers having shorter life-spans. Therefore, the global bulk container market is estimated to expand at a growth rate of 7% in next decade.
Get the data you need at a Fraction of the cost
Personalize your report by choosing insights you need
and save 40%!
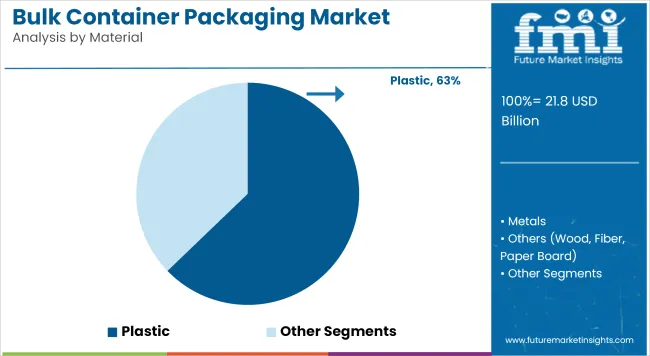
“Escalating Demand for Plastic-based Packaging Solution is Acting as a Catalyst”.
Surging demand for plastic-based packaging solutions such as pails and drums over any other solution made from various materials including metal and glass is a trend that has grasped the industrial bulk packaging market through the years. From a manufacturing viewpoint, the implementation of plastic products helps in achieving economies of scale.
Additionally, the use of plastic material as raw ingredients helps various manufacturing companies to meet their required criteria for the development of the most favorable products consisting of various properties including durability, lightweight, reliability, etc.
Dangerous goods include radioactive materials along with flammable, explosive, toxic, and hazardous products. So for that, the trading activities of these goods are increasing the consumption of plastic drums for industrial applications, which has been contributing to the expansion of the drums market.
The use of these plastic drums helps manufacturers to satisfy customers by allowing them to choose their preferred color from a huge number of options, which, in turn, enhances the marketing and advertisement array of their products. The manufacturing companies are expected to shift their focus towards bio-compostable materials (plastics) to produce bulk containers for maintaining sustainability in the market over the years.
“Extensive Research to be the Key to Market Consolidation”
The escalated application of bag-in-box IBC liners across various industries (especially in the pharmaceutical and cosmetic industries) is fueling the growth of the IBC liners market. These are replacing “Sputniks” or stainless steel containers widely equipped with steam-sterilized aseptic valves. Some of the leading companies are investing in extensive research to gain a competitive advantage.
For instance: Bag-in-box is being used widely in the USA According to Hein Haerinck (EMEA Sales, CDF, Belgium ), these IBCs (Intermediate Bulk Containers) are trending in Europe as these bags use less plastic and are cost-effective. Along with CDF’s bag-in-box IBC, the Q-big packaging company is also boosting the growth of the IBC market, which, in turn, is accelerating the bulk container packaging market with the help of its T-shaped liners.
Bag-in-Box containers, as compared to conventional packaging types, provide more hygienic as well as safety features. They offer greater convenience in packaging, storage, and transportation along with low space utilization. BIB containers also reduce logistics costs and provide more brand recognition to the manufacturer.
“Clean Room Packaging to Dominate”
Amid the COVID-19 pandemic, the end-users are having more emphasis on clean room packaging and sterile packaging for the large volume transportation of direct consumable products. The government bodies of various countries have the maximum focus on contamination-free transit of such products.
Therefore, key players are manufacturing bulk containers that satisfy US FDA’s regulations and provide sterile bulk containers to the pharmaceutical and food and beverage industries.
Furthermore, end users have more proclivity towards the use of lightweight shipping containers. Therefore, demand for plastic-based bulk containers is prominently increasing in various countries. However, some of the regulatory bodies have defined rules for using plastic as a packaging material.
Therefore, key players are manufacturing their products as per the materials suggested by the government. However, this has less impact on the sales of plastic bulk containers packaging market, as this type of packaging solution is looked upon as a tertiary packaging format.
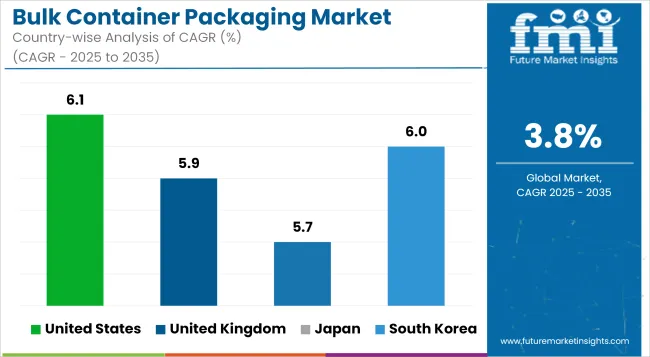
FMI team deeply analyzed the top five countries in the global bulk container packaging market and reached the conclusion that the United States market is expected to outpace the other countries during the forecast period. This market is expected to create an incremental revenue opportunity of nearly US$ 4.6 Billion by the end of 2031.
Increasing industrial production activities are anticipated to support heightened demand for bulk container packaging. More inclination towards large-sized foldable bulk containers among end-users has been witnessed in the past year. However, tough rivalry in the USA market is anticipated due to the presence of many strong and organized players.
This is further raising the entry barriers for new players and small-scale industries. To survive in the cutthroat competition in the target market, manufacturers are increasing the production of flexible and foldable bulk containers that are gradually replacing the bulk containers in various end-use industries.
Research states that Germany exported nearly 15% of the global medicines and drugs to the rest of the countries in 2019. The demand for bulk container packaging in Germany is expected to remain high, on the back of increasing export and developments of medicines and drugs in the country.
As per FMI’s analysis, Germany accounts for nearly 12% market share in the top five countries of the global bulk container packaging market. The high volume transit of medicines and drugs is creating the need for sterile storage bulk containers.
Saudi Arabia has overtaken Russia’s place and become the largest crude oil exporter to China. FMI’s research, showed an increase in exports in October 2019 in comparison with the month before, according to the published customs data of China’s General Administration.
According to the data, Russia was the top crude oil supplier to China in 2017 and 2018, and now Saudi Arabia sends an average of 1.98 million barrels per day of crude oil to China. This has marked a jump of 77% from 2018 to 2020.
The flexible bulk container packaging is estimated to hold more than 3/5th value share in the global market and is expected to increase further by 250bps of current market share during the forecast period. As per FMI, this growth is anticipated due to cost minimization on returnable transportation and space savings. FIBCs are versatile and optimize handling and transportation. They, thus, improve the material handling system and supply chain.
Accounting for over 90% of the overall share through the forecast period, the bulk container segment continues to account for the bulk of demand. Growth in the demand for drums, pails, and other rigid containers along with containers equipped with bulk containers continues to persist.
The primary aim of bulk containers is to maintain the integrity of the product and reduce the risk associated with the product during shipment. The technology offers several advantages. For instance - trackers available for tracking the container’s location are expected to boost the sales of the market.
Exploring the untapped region for exports will create ample opportunities for the growth of the bulk container packaging market. Eastern Europe has high fresh produce of organic food products. Shipping of these organic products across various regions will further strengthen the use of bulk bags in this region.
Flexible Intermediate Bulk Containers (FIBCs) are best suited for the export of food products. FIBC bags are replacing corrugated boxes as they have comparatively high durability and are also lightweight. Similarly, there are various products that are not exported to other regions due to ineffective packaging types. FIBCs ensure that the product is shipped in its original form to the importers and is highly cost-effective.
Use of the bulk bags for the transportation of products (otherwise not exported) is expected to create high opportunities for not only the growth of the bulk container packaging market but also the economy of Eastern Europe.
Some of the players are focusing to make recyclable products to maintain sustainability.
Attribute | Details |
---|---|
Forecast Period | 2022 to 2031 |
Historical Data Available for | 2015 to 2021 |
Market Analysis | USD Million/Billion for value and ‘000 Units for Volume |
Key Regions Covered | North America, Latin America, Western Europe, Eastern Europe, Asia Pacific excluding Japan, Oceania Middle East & Africa (MEA), and Japan. |
Key Countries Covered | The USA, Canada, Germany, the UK, France, Italy, Spain, BENELUX, Poland, Russia, China, Japan, India, Association of Southeast Asian Nations, Brazil, Mexico, Australia, New Zealand, GCC Countries, Turkey, Northern Africa, South Africa. |
Key Segments Covered | Product, Material, End-use, and Region |
Key Companies Profiled |
|
Report Coverage | Market Forecast, brand share analysis, competition intelligence, DROT analysis, Market Dynamics and Challenges, Strategic Growth Initiatives |
Customization & Pricing | Available upon Request |
Product:
Material:
End Use:
Region:
1. Executive Summary | Bulk Container Packaging Market 1.1. Global Market Outlook 1.2. Market Analysis 1.3. Analysis and Recommendations 2. Market Overview 2.1. Market Coverage 2.2. Market Definition 3. Key Market Trends 3.1. Key Trends Impacting the Market 3.2. Product Innovation Trends 4. Key Success Factors 4.1. Product Adoption Analysis 4.2. Product USPs / Features 5. Global Market Demand Analysis 2015 to 2021 and Forecast, 2022 to 2031 5.1. Historical Market Volume ( ‘000 Units) and Value (US$ Million) Analysis, 2015 to 2021 5.2. Current and Future Market Volume (‘000 Units) and Value (US$ Million) Projections, 2022 to 2031 5.3. Y-o-Y Growth Trend Analysis 6. Global Market - Pricing Analysis 6.1. Regional Pricing Analysis 6.2. Pricing Break-up 6.3. Global Average Pricing Analysis Benchmark 7. Market Background 7.1. Global Packaging Market Outlook 7.2. Global Rigid Packaging Market Outlook 7.3. Mergers and Acquisitions in Packaging Industries Outlook 7.4. Key Industry Perspective: What Industry Leaders are saying? 7.5. Macro-Economic Factors 7.5.1. Global GDP Growth Outlook 7.5.2. GDP Per Capita 7.5.3. Manufacturing Value Added 7.5.4. Industrial Production 7.6. Forecast Factors - Relevance & Impact 7.6.1. Global Industrial Sector Growth 7.6.2. Global Food & Beverage Sector Growth 7.6.3. Global Automotive Sector Growth 7.6.4. Global Pharmaceutical & Healthcare Sector Growth 7.6.5. Regional Manufacturing Value-Added Growth 7.6.6. Segmental Revenue Growth of Key Players 7.6.7. Top Companies Historical Revenue Growth 7.7. Value Chain Analysis 7.7.1. Key Participants 7.7.1.1. Raw Material Suppliers 7.7.1.2. Manufacturers 7.7.1.3. Distributors 7.7.2. Profitability Margin 7.8. Market Dynamics 7.8.1. Drivers 7.8.2. Restraints 7.8.3. Opportunity Analysis 8. Impact of COVID-19 8.1. Current Statistics and Probable Future Impact 8.2. Current Economic Projection - GDP/GVA and Probable Impact 8.3. Comparison of SAARs and Market Recovery, for Key Countries 8.4. Comparison to 2008 Financial Crisis and Market Recovery, for Key Countries 8.5. Impact of COVID-19 on the Market 9. Global Market Analysis 2015 to 2021 and Forecast 2022 to 2031, by Product 9.1. Introduction 9.2. Historical Market Size (US$ Million) and Volume (‘000 Units) Analysis By Product, 2015 to 2021 9.3. Current and Future Market Size (US$ Million) and Volume (‘000 Units) Analysis and Forecast By Product, 2022 to 2031 9.3.1. Flexitanks 9.3.2. Bulk Containers 9.3.2.1. Flexible 9.3.2.2. Rigid 9.3.3. Bulk Containers Liners 9.4. Market Attractiveness Analysis By Product 10. Global Market Analysis 2015 to 2021 and Forecast 2022 to 2031, by Material 10.1. Introduction 10.2. Historical Market Size (US$ Million) and Volume (‘000 Units) Analysis By Material, 2015 to 2021 10.3. Current and Future Market Size (US$ Million) and Volume (‘000 Units) Analysis and Forecast By Material, 2022 to 2031 10.3.1. Plastic 10.3.1.1. High-Density Polyethylene (HDPE) 10.3.1.2. Low-density polyethylene (LDPE) 10.3.1.3. Linear Low-Density Polyethylene (LLDPE) 10.3.1.4. Polypropylene (PP) 10.3.1.5. Polyvinyl Chloride (PVC) 10.3.1.6. Others (Polystyrene, etc.) 10.3.2. Metals 10.3.3. Others (Wood, Fiber, Paperboard) 10.4. Market Attractiveness Analysis By Material 11. Global Market Analysis 2015 to 2021 and Forecast 2022 to 2031, by End-use 11.1. Introduction 11.2. Historical Market Size (US$ Million) and Volume (‘000 Units) Analysis By End-use, 2015 to 2021 11.3. Current and Future Market Size (US$ Million) and Volume (‘000 Units) Analysis and Forecast By End-use, 2022 to 2031 11.3.1. Industrial Chemicals 11.3.2. Petroleum & Lubricants 11.3.3. Food & Beverages 11.3.4. Paints, Inks & Dyes 11.3.5. Pharmaceuticals 11.3.6. Others 11.4. Market Attractiveness Analysis By End-use 12. Global Market Analysis 2015 to 2021 and Forecast 2022 to 2031, by Region 12.1. Introduction 12.2. Historical Market Size (US$ Million) and Volume (‘000 Units) Analysis By Region, 2015 to 2021 12.3. Current Market Size (US$ Million) and Volume (‘000 Units) Analysis and Forecast By Region, 2022 to 2031 12.3.1. North America 12.3.2. Latin America 12.3.3. Western Europe 12.3.4. Eastern Europe 12.3.5. Asia Pacific Excluding Japan 12.3.6. Japan 12.3.7. Middle East and Africa (MEA) 12.4. Market Attractiveness Analysis By Region 13. North America Market Analysis 2015 to 2021 and Forecast 2022 to 2031 13.1. Introduction 13.2. Pricing Analysis 13.3. Historical Market Size (US$ Million) and Volume (‘000 Units) Trend Analysis By Market Taxonomy, 2015 to 2021 13.4. Market Size (US$ Million) and Volume (‘000 Units) Forecast By Market Taxonomy, 2022 to 2031 13.4.1. By Country 13.4.1.1. The USA 13.4.1.2. Canada 13.4.2. By Product 13.4.3. By Material 13.4.4. By End-use 13.5. Market Attractiveness Analysis 13.5.1. By Country 13.5.2. By Product 13.5.3. By Material 13.5.4. By End-use 13.6. Market Trends 14. Latin America Market Analysis 2015 to 2021 and Forecast 2022 to 2031 14.1. Introduction 14.2. Pricing Analysis 14.3. Historical Market Size (US$ Million) and Volume (‘000 Units) Trend Analysis By Market Taxonomy, 2015 to 2021 14.4. Market Size (US$ Million) and Volume (‘000 Units) Forecast By Market Taxonomy, 2022 to 2031 14.4.1. By Country 14.4.1.1. Brazil 14.4.1.2. Mexico 14.4.1.3. Rest of Latin America 14.4.2. By Product 14.4.3. By Material 14.4.4. By End-use 14.5. Market Attractiveness Analysis 14.5.1. By Country 14.5.2. By Product 14.5.3. By Material 14.5.4. By End-use 14.6. Market Trends 15. Western Europe Market Analysis 2015 to 2021 and Forecast 2022 to 2031 15.1. Introduction 15.2. Pricing Analysis 15.3. Historical Market Size (US$ Million) and Volume (‘000 Units) Trend Analysis By Market Taxonomy, 2015 to 2021 15.4. Market Size (US$ Million) and Volume (‘000 Units) Forecast By Market Taxonomy, 2022 to 2031 15.4.1. By Country 15.4.1.1. Germany 15.4.1.2. Italy 15.4.1.3. France 15.4.1.4. Spain 15.4.1.5. The UK 15.4.1.6. Benelux 15.4.1.7. Rest of Western Europe 15.4.2. By Product 15.4.3. By Material 15.4.4. By End-use 15.5. Market Attractiveness Analysis 15.5.1. By Country 15.5.2. By Product 15.5.3. By Material 15.5.4. By End-use 15.6. Market Trends 16. Eastern Europe Market Analysis 2015 to 2021 and Forecast 2022 to 2031 16.1. Introduction 16.2. Pricing Analysis 16.3. Historical Market Size (US$ Million) and Volume (‘000 Units) Trend Analysis By Market Taxonomy, 2015 to 2021 16.4. Market Size (US$ Million) and Volume (‘000 Units) Forecast By Market Taxonomy, 2022 to 2031 16.4.1. By Country 16.4.1.1. Russia 16.4.1.2. Poland 16.4.1.3. Rest of Eastern Europe 16.4.1.4. Rest of South Asia 16.4.2. By Product 16.4.3. By Material 16.4.4. By End-use 16.5. Market Attractiveness Analysis 16.5.1. By Country 16.5.2. By Product 16.5.3. By Material 16.5.4. By End-use 16.6. Market Trends 17. APEJ Market Analysis 2015 to 2021 and Forecast 2022 to 2031 17.1. Introduction 17.2. Pricing Analysis 17.3. Historical Market Size (US$ Million) and Volume (‘000 Units) Trend Analysis By Market Taxonomy, 2015 to 2021 17.4. Market Size (US$ Million) and Volume (‘000 Units) Forecast By Market Taxonomy, 2022 to 2031 17.4.1. By Country 17.4.1.1. China 17.4.1.2. India 17.4.1.3. Association of Southeast Asian Nations 17.4.1.4. Australia & New Zealand 17.4.1.5. Rest of APAC 17.4.2. By Product 17.4.3. By Material 17.4.4. By End-use 17.5. Market Attractiveness Analysis 17.5.1. By Country 17.5.2. By Product 17.5.3. By Material 17.5.4. By End-use 17.6. Market Trends 18. Middle East and Africa Market Analysis 2015 to 2021 and Forecast 2022 to 2031 18.1. Introduction 18.2. Pricing Analysis 18.3. Historical Market Size (US$ Million) and Volume (‘000 Units) Trend Analysis By Market Taxonomy, 2015 to 2021 18.4. Market Size (US$ Million) and Volume (‘000 Units) Forecast By Market Taxonomy, 2022 to 2031 18.4.1. By Country 18.4.1.1. GCC Countries 18.4.1.2. Turkey 18.4.1.3. Northern Africa 18.4.1.4. South Africa 18.4.1.5. Rest of Middle East and Africa 18.4.2. By Product 18.4.3. By Material 18.4.4. By End-use 18.5. Market Attractiveness Analysis 18.5.1. By Country 18.5.2. By Product 18.5.3. By Material 18.5.4. By End-use 18.6. Market Trends 19. Japan Market Analysis 2015 to 2021 and Forecast 2022 to 2031 19.1. Introduction 19.2. Pricing Analysis 19.3. Historical Market Size (US$ Million) and Volume (‘000 Units) Trend Analysis By Market Taxonomy, 2015 to 2021 19.4. Market Size (US$ Million) and Volume (‘000 Units) Forecast By Market Taxonomy, 2022 to 2031 19.4.1. By Product 19.4.2. By Material 19.4.3. By End-use 19.5. Market Attractiveness Analysis 19.5.1. By Product 19.5.2. By Material 19.5.3. By End-use 19.6. Market Trends 20. Country-wise Market Analysis 2015 to 2021 and Forecast 2022 to 2031 20.1. U.S. Market Analysis 20.1.1. Market Volume (Units) and Value (US$ Million) Analysis and Forecast, by Market Taxonomy 20.1.1.1. By Product 20.1.1.2. By Material 20.1.1.3. By End-use 20.2. Canada Market Analysis 20.2.1. Market Volume (Units) and Value (US$ Million) Analysis and Forecast, by Market Taxonomy 20.2.1.1. By Product 20.2.1.2. By Material 20.2.1.3. By End-use 20.3. Brazil Market Analysis 20.3.1. Market Volume (Units) and Value (US$ Million) Analysis and Forecast, by Market Taxonomy 20.3.1.1. By Product 20.3.1.2. By Material 20.3.1.3. By End-use 20.4. Mexico Market Analysis 20.4.1. Market Volume (Units) and Value (US$ Million) Analysis and Forecast, by Market Taxonomy 20.4.1.1. By Product 20.4.1.2. By Material 20.4.1.3. By End-use 20.5. Germany Market Analysis 20.5.1. Market Volume (Units) and Value (US$ Million) Analysis and Forecast, by Market Taxonomy 20.5.1.1. By Product 20.5.1.2. By Material 20.5.1.3. By End-use 20.6. Italy Market Analysis 20.6.1. Market Volume (Units) and Value (US$ Million) Analysis and Forecast, by Market Taxonomy 20.6.1.1. By Product 20.6.1.2. By Material 20.6.1.3. By End-use 20.7. France Market Analysis 20.7.1. Market Volume (Units) and Value (US$ Million) Analysis and Forecast, by Market Taxonomy 20.7.1.1. By Product 20.7.1.2. By Material 20.7.1.3. By End-use 20.8. The UK Market Analysis 20.8.1. Market Volume (Units) and Value (US$ Million) Analysis and Forecast, by Market Taxonomy 20.8.1.1. By Product 20.8.1.2. By Material 20.8.1.3. By End-use 20.9. Spain Market Analysis 20.9.1. Market Volume (Units) and Value (US$ Million) Analysis and Forecast, by Market Taxonomy 20.9.1.1. By Product 20.9.1.2. By Material 20.9.1.3. By End-use 20.10. Russia Market Analysis 20.10.1. Market Volume (Units) and Value (US$ Million) Analysis and Forecast, by Market Taxonomy 20.10.1.1. By Product 20.10.1.2. By Material 20.10.1.3. By End-use 20.11. Poland Market Analysis 20.11.1. Market Volume (Units) and Value (US$ Million) Analysis and Forecast, by Market Taxonomy 20.11.1.1. By Product 20.11.1.2. By Material 20.11.1.3. By End-use 20.12. Turkey Market Analysis 20.12.1. Market Volume (Units) and Value (US$ Million) Analysis and Forecast, by Market Taxonomy 20.12.1.1. By Product 20.12.1.2. By Material 20.12.1.3. By End-use 20.13. South Africa Market Analysis 20.13.1. Market Volume (Units) and Value (US$ Million) Analysis and Forecast, by Market Taxonomy 20.13.1.1. By Product 20.13.1.2. By Material 20.13.1.3. By End-use 20.14. GCC Countries Market Analysis 20.14.1. Market Volume (Units) and Value (US$ Million) Analysis and Forecast, by Market Taxonomy 20.14.1.1. By Product 20.14.1.2. By Material 20.14.1.3. By End-use 20.15. Japan Market Analysis 20.15.1. Market Volume (Units) and Value (US$ Million) Analysis and Forecast, by Market Taxonomy 20.15.1.1. By Product 20.15.1.2. By Material 20.15.1.3. By End-use 20.16. South Korea Market Analysis 20.16.1. Market Volume (Units) and Value (US$ Million) Analysis and Forecast, by Market Taxonomy 20.16.1.1. By Product 20.16.1.2. By Material 20.16.1.3. By End-use 20.17. India Market Analysis 20.17.1. Market Volume (Units) and Value (US$ Million) Analysis and Forecast, by Market Taxonomy 20.17.1.1. By Product 20.17.1.2. By Material 20.17.1.3. By End-use 20.18. China Market Analysis 20.18.1. Market Volume (Units) and Value (US$ Million) Analysis and Forecast, by Market Taxonomy 20.18.1.1. By Product 20.18.1.2. By Material 20.18.1.3. By End-use 20.19. Australia Market Analysis 20.19.1. Market Volume (Units) and Value (US$ Million) Analysis and Forecast, by Market Taxonomy 20.19.1.1. By Product 20.19.1.2. By Material 20.19.1.3. By End-use 20.20. New Zealand Market Analysis 20.20.1. Market Volume (Units) and Value (US$ Million) Analysis and Forecast, by Market Taxonomy 20.20.1.1. By Product 20.20.1.2. By Material 20.20.1.3. By End-use 21. Market Structure Analysis 21.1. Market Analysis by Tier of Companies 21.2. Market Concentration 21.3. Market Share Analysis of Top Players 21.4. Market Presence Analysis 21.4.1. By Regional Footprint of Players 21.4.2. Product foot print by Players 21.4.3. Channel Foot Print by Players 22. Competition Analysis 22.1. Competition Dashboard 22.2. Competition Benchmarking 22.3. Competition Deep Dive 22.3.1. Greif, Inc. 22.3.1.1. Overview 22.3.1.2. Product Portfolio 22.3.1.3. Profitability by Market Segments 22.3.1.4. Sales Footprint 22.3.1.5. Strategy Overview 22.3.1.5.1. Marketing Strategy 22.3.1.5.2. Product Strategy 22.3.1.5.3. Channel Strategy 22.3.2. Berry Global, Inc. 22.3.2.1. Overview 22.3.2.2. Product Portfolio 22.3.2.3. Profitability by Market Segments 22.3.2.4. Sales Footprint 22.3.2.5. Strategy Overview 22.3.2.5.1. Marketing Strategy 22.3.2.5.2. Product Strategy 22.3.2.5.3. Channel Strategy 22.3.3. Sealed Air Corporation 22.3.3.1. Overview 22.3.3.2. Product Portfolio 22.3.3.3. Profitability by Market Segments 22.3.3.4. Sales Footprint 22.3.3.5. Strategy Overview 22.3.3.5.1. Marketing Strategy 22.3.3.5.2. Product Strategy 22.3.3.5.3. Channel Strategy 22.3.4. DS Smith Plc 22.3.4.1. Overview 22.3.4.2. Product Portfolio 22.3.4.3. Profitability by Market Segments 22.3.4.4. Sales Footprint 22.3.4.5. Strategy Overview 22.3.4.5.1. Marketing Strategy 22.3.4.5.2. Product Strategy 22.3.4.5.3. Channel Strategy 22.3.5. Mondi Group 22.3.5.1. Overview 22.3.5.2. Product Portfolio 22.3.5.3. Profitability by Market Segments 22.3.5.4. Sales Footprint 22.3.5.5. Strategy Overview 22.3.5.5.1. Marketing Strategy 22.3.5.5.2. Product Strategy 22.3.5.5.3. Channel Strategy 22.3.6. Bemis Company, Inc. 22.3.6.1. Overview 22.3.6.2. Product Portfolio 22.3.6.3. Profitability by Market Segments 22.3.6.4. Sales Footprint 22.3.6.5. Strategy Overview 22.3.6.5.1. Marketing Strategy 22.3.6.5.2. Product Strategy 22.3.6.5.3. Channel Strategy 22.3.7. International Paper Company 22.3.7.1. Overview 22.3.7.2. Product Portfolio 22.3.7.3. Profitability by Market Segments 22.3.7.4. Sales Footprint 22.3.7.5. Strategy Overview 22.3.7.5.1. Marketing Strategy 22.3.7.5.2. Product Strategy 22.3.7.5.3. Channel Strategy 22.3.8. Winpak Ltd 22.3.8.1. Overview 22.3.8.2. Product Portfolio 22.3.8.3. Profitability by Market Segments 22.3.8.4. Sales Footprint 22.3.8.5. Strategy Overview 22.3.8.5.1. Marketing Strategy 22.3.8.5.2. Product Strategy 22.3.8.5.3. Channel Strategy 22.3.9. Mauser Group B.V 22.3.9.1. Overview 22.3.9.2. Product Portfolio 22.3.9.3. Profitability by Market Segments 22.3.9.4. Sales Footprint 22.3.9.5. Strategy Overview 22.3.9.5.1. Marketing Strategy 22.3.9.5.2. Product Strategy 22.3.9.5.3. Channel Strategy 22.3.10. Hoover Ferguson Group 22.3.10.1. Overview 22.3.10.2. Product Portfolio 22.3.10.3. Profitability by Market Segments 22.3.10.4. Sales Footprint 22.3.10.5. Strategy Overview 22.3.10.5.1. Marketing Strategy 22.3.10.5.2. Product Strategy 22.3.10.5.3. Channel Strategy 22.3.11. Braid Logistics (UK) Limited 22.3.11.1. Overview 22.3.11.2. Product Portfolio 22.3.11.3. Profitability by Market Segments 22.3.11.4. Sales Footprint 22.3.11.5. Strategy Overview 22.3.11.5.1. Marketing Strategy 22.3.11.5.2. Product Strategy 22.3.11.5.3. Channel Strategy 22.3.12. Qingdao LAF Packaging Co. Ltd. 22.3.12.1. Overview 22.3.12.2. Product Portfolio 22.3.12.3. Profitability by Market Segments 22.3.12.4. Sales Footprint 22.3.12.5. Strategy Overview 22.3.12.5.1. Marketing Strategy 22.3.12.5.2. Product Strategy 22.3.12.5.3. Channel Strategy 22.3.13. My Flexitank Industries Sdn Bhd 22.3.13.1. Overview 22.3.13.2. Product Portfolio 22.3.13.3. Profitability by Market Segments 22.3.13.4. Sales Footprint 22.3.13.5. Strategy Overview 22.3.13.5.1. Marketing Strategy 22.3.13.5.2. Product Strategy 22.3.13.5.3. Channel Strategy 22.3.14. SIA Flexitanks Limited 22.3.14.1. Overview 22.3.14.2. Product Portfolio 22.3.14.3. Profitability by Market Segments 22.3.14.4. Sales Footprint 22.3.14.5. Strategy Overview 22.3.14.5.1. Marketing Strategy 22.3.14.5.2. Product Strategy 22.3.14.5.3. Channel Strategy 22.3.15. Environmental Packaging Technologies, Inc. 22.3.15.1. Overview 22.3.15.2. Product Portfolio 22.3.15.3. Profitability by Market Segments 22.3.15.4. Sales Footprint 22.3.15.5. Strategy Overview 22.3.15.5.1. Marketing Strategy 22.3.15.5.2. Product Strategy 22.3.15.5.3. Channel Strategy 22.3.16. Snyder Industries, Inc 22.3.16.1. Overview 22.3.16.2. Product Portfolio 22.3.16.3. Profitability by Market Segments 22.3.16.4. Sales Footprint 22.3.16.5. Strategy Overview 22.3.16.5.1. Marketing Strategy 22.3.16.5.2. Product Strategy 22.3.16.5.3. Channel Strategy 22.3.17. Schuetz GmbH & Co. KGaA 22.3.17.1. Overview 22.3.17.2. Product Portfolio 22.3.17.3. Profitability by Market Segments 22.3.17.4. Sales Footprint 22.3.17.5. Strategy Overview 22.3.17.5.1. Marketing Strategy 22.3.17.5.2. Product Strategy 22.3.17.5.3. Channel Strategy 22.3.18. Büscherhoff Spezialverpackung GmbH & Co. KG 22.3.18.1. Overview 22.3.18.2. Product Portfolio 22.3.18.3. Profitability by Market Segments 22.3.18.4. Sales Footprint 22.3.18.5. Strategy Overview 22.3.18.5.1. Marketing Strategy 22.3.18.5.2. Product Strategy 22.3.18.5.3. Channel Strategy 22.3.19. Bulk Lift International, Inc 22.3.19.1. Overview 22.3.19.2. Product Portfolio 22.3.19.3. Profitability by Market Segments 22.3.19.4. Sales Footprint 22.3.19.5. Strategy Overview 22.3.19.5.1. Marketing Strategy 22.3.19.5.2. Product Strategy 22.3.19.5.3. Channel Strategy 22.3.20. Shandong Anthente New Materials Technology Co. Ltd 22.3.20.1. Overview 22.3.20.2. Product Portfolio 22.3.20.3. Profitability by Market Segments 22.3.20.4. Sales Footprint 22.3.20.5. Strategy Overview 22.3.20.5.1. Marketing Strategy 22.3.20.5.2. Product Strategy 22.3.20.5.3. Channel Strategy 23. Assumptions and Acronyms Used 24. Research Methodology
Don't pay for what you don't need
Customize your report by selecting specific countries or regions and save 30%!
Table 01: Global Market Value (US$ Million) by Product, 2015H to 2031F Table 02: Global Market Volume (‘000 Units) by Product, 2015H to 2031F Table 03: Global Market Value (US$ Million) by Material, 2015H to 2031F Table 04: Global Market Volume (‘000 Units) by Material, 2015H to 2031F Table 05: Global Market Value (US$ Million) by End Use, 2015H to 2031F Table 06: Global Market Volume (‘000 Units) by End Use, 2015H to 2031F Table 07: Global Market Value (US$ Million) by Region, 2015H to 2031F Table 08: Global Market Volume (‘000 Units) by Region, 2015H to 2031F Table 09: North America Market Value (US$ Million) by Product, 2015H to 2031F Table 10: North America Market Volume (‘000 Units) by Product, 2015H to 2031F Table 11: North America Market Value (US$ Million) by Material, 2015H to 2031F Table 12: North America Market Volume (‘000 Units) by Material, 2015H to 2031F Table 13: North America Market Value (US$ Million) by End Use, 2015H to 2031F Table 14: North America Market Volume (‘000 Units) by End Use, 2015H to 2031F Table 15: North America Market Value (US$ Million) by Country, 2015H to 2031F Table 16: North America Market Volume (‘000 Units) by Country, 2015H to 2031F Table 17: Latin America Market Value (US$ Million) by Product, 2015H to 2031F Table 18: Latin America Market Volume (‘000 Units) by Product, 2015H to 2031F Table 19: Latin America Market Value (US$ Million) by Material, 2015H to 2031F Table 20: Latin America Market Volume (‘000 Units) by Material, 2015H to 2031F Table 21: Latin America Market Value (US$ Million) by End Use, 2015H to 2031F Table 22: Latin America Market Volume ((‘000 Units) by End Use, 2015H to 2031F Table 23: Latin America Market Value (US$ Million) by Country, 2015H to 2031F Table 24: Latin America Market Volume ((‘000 Units) by Country, 2015H to 2031F Table 25: Western Europe Market Value (US$ Million) by Product, 2015H to 2031F Table 26: Western Europe Market Volume (‘000 Units) by Product, 2015H to 2031F Table 27: Western Europe Market Value (US$ Million) by Material, 2015H to 2031F Table 28: Western Europe Market Volume (‘000 Units) by Material, 2015H to 2031F Table 29: Western Europe Market Value (US$ Million) by End Use, 2015H to 2031F Table 30: Western Europe Market Volume (‘000 Units) by End Use, 2015H to 2031F Table 31: Western Europe Market Value (US$ Million) by Country, 2015H to 2031F Table 32: Western Europe Market Volume (‘000 Units) by Country, 2015H to 2031F Table 33: Eastern Europe Market Value (US$ Million) by Product, 2015H to 2031F Table 34: Eastern Europe Market Volume (‘000 Units) by Product, 2015H to 2031F Table 35: Eastern Europe Market Value (US$ Million) by Material, 2015H to 2031F Table 36: Eastern Europe Market Volume (‘000 Units) by Material, 2015H to 2031F Table 37: Eastern Europe Market Value (US$ Million) by End Use, 2015H to 2031F Table 38: Eastern Europe Market Volume (‘000 Units) by End Use, 2015H to 2031F Table 39: Eastern Europe Market Value (US$ Million) by Country, 2015H to 2031F Table 40: Eastern Europe Market Volume (‘000 Units) by Country, 2015H to 2031F Table 41: APEJ Market Value (US$ Million) by Product, 2015H to 2031F Table 42: APEJ Market Volume (‘000 Units) by Product, 2015H to 2031F Table 43: APEJ Market Value (US$ Million) by Material, 2015H to 2031F Table 44: APEJ Market Volume (‘000 Units) by Material, 2015H to 2031F Table 45: APEJ Market Value (US$ Million) by End Use, 2015H to 2031F Table 46: APEJ Market Volume (‘000 Units) by End Use, 2015H to 2031F Table 47: APEJ Market Value (US$ Million) by Country, 2015H to 2031F Table 48: APEJ Market Volume (‘000 Units) by Country, 2015H to 2031F Table 49: Middle East & Africa (MEA) Market Value (US$ Million) by Product, 2015H to 2031F Table 50: Middle East & Africa (MEA) Market Volume (‘000 Units) by Product, 2015H to 2031F Table 51: Middle East & Africa (MEA) Market Value (US$ Million) by Material, 2015H to 2031F Table 52: Middle East & Africa (MEA) Market Volume (‘000 Units) by Material, 2015H to 2031F Table 53: Middle East & Africa (MEA) Market Value (US$ Million) by End Use, 2015H to 2031F Table 54: Middle East & Africa (MEA) Market Volume (‘000 Units) by End Use, 2015H to 2031F Table 55: Middle East & Africa (MEA) Market Value (US$ Million) by Country, 2015H to 2031F Table 56: Middle East & Africa (MEA) Market Volume (‘000 Units) by Country, 2015H to 2031F Table 57: Japan Market Value (US$ Million) by Product, 2015H to 2031F Table 58: Japan Market Volume (‘000 Units) by Product, 2015H to 2031F Table 59: Japan Market Value (US$ Million) by Material, 2015H to 2031F Table 60: Japan Market Volume (‘000 Units) by Material, 2015H to 2031F Table 61: Japan Market Value (US$ Million) by End Use, 2015H to 2031F Table 62: Japan Market Volume (‘000 Units) by End Use, 2015H to 2031F
Figure 01: Global Market Value (US$ Million) and Volume (‘000 Units) Analysis, 2015(H) to 2021(A) Figure 02: Global Market Value (US$ Million) and Volume (‘000 Units) Forecast, 2022(E) to 2031(F) Figure 03: Global Market Absolute Opportunity (US$ Million) (2015H, 2021(A) to 2031(F)) Figure 04: Global Market Value (US$ Million) Scenario Forecast, 2022(E) Figure 05: Global Market Share by Product (2022E to 2031F) Figure 06: Global Market Attractiveness Analysis by Product, 2022E to 2031F Figure 07: Global Market Share by Material (2022E to 2031F) Figure 08: Global Market Attractiveness Analysis by Material, 2022E to 2031F Figure 09: Global Market Share by End Use (2022E to 2031F) Figure 10: Global Market Attractiveness Analysis by End Use 2022E to 2031F Figure 11: Global Market Share by Region (2022E to 2031F) Figure 12: Global Market Attractiveness Analysis by Region, 2022E to 2031F Figure 13: North America Market Share by Product (2022E to 2031F) Figure 14: North America Market Attractiveness Analysis by Product, 2022E to 2031F Figure 15: North America Market Share by Material (2022E to 2031F) Figure 16: North America Market Attractiveness Analysis by Material, 2022E to 2031F Figure 17: North America Market Share by End Use (2022E to 2031F) Figure 18: North America Market Attractiveness Analysis by End Use, 2022E to 2031F Figure 19: North America Market Share by Country (2022E to 2031F) Figure 20: North America Market Attractiveness Analysis by Country, 2022E to 2031F Figure 21: Latin America Market Share by Product (2022E to 2031F) Figure 22: Latin America Market Attractiveness Analysis by Product, 2022E to 2031F Figure 23: Latin America Market Share by Material (2022E to 2031F) Figure 24: Latin America Market Attractiveness Analysis by Material, 2022E to 2031F Figure 25: Latin America Market Share by End Use (2022E to 2031F) Figure 26: Latin America Market Attractiveness Analysis by End Use, 2022E to 2031F Figure 27: Latin America Market Share by Country (2022E to 2031F) Figure 28: Latin America Market Attractiveness Analysis by Country, 2022E to 2031F Figure 29: Western Europe Market Share by Product (2022E to 2031F) Figure 30: Western Europe Market Attractiveness Analysis by Product, 2022E to 2031F Figure 31: Western Europe Market Share by Material (2022E to 2031F) Figure 32: Western Europe Market Attractiveness Analysis by Material, 2022E to 2031F Figure 33: Western Europe Market Share by End Use (2022E to 2031F) Figure 34: Western Europe Market Attractiveness Analysis by End Use, 2022E to 2031F Figure 35: Western Europe Market Share by Country (2022E to 2031F) Figure 36: Western Europe Market Attractiveness Analysis by Country, 2022E to 2031F Figure 37: Eastern Europe Market Share by Product (2022E to 2031F) Figure 38: Eastern Europe Market Attractiveness Analysis by Product, 2022E to 2031F Figure 39: Eastern Europe Market Share by Material (2022E to 2031F) Figure 40: Eastern Europe Market Attractiveness Analysis by Material, 2022E to 2031F Figure 41: Eastern Europe Market Share by End Use (2022E to 2031F) Figure 42: Eastern Europe Market Attractiveness Analysis by End Use, 2022E to 2031F Figure 43: Eastern Europe Market Share by Country (2022E to 2031F) Figure 44: Eastern Europe Market Attractiveness Analysis by Country, 2022E to 2031F Figure 45: APEJ Market Share by Product (2022E to 2031F) Figure 46: APEJ Market Attractiveness Analysis by Product, 2022E to 2031F Figure 47: APEJ Market Share by Material (2022E to 2031F) Figure 48: APEJ Market Attractiveness Analysis by Material, 2022E to 2031F Figure 49: APEJ Market Share by End Use (2022E to 2031F) Figure 50: APEJ Market Attractiveness Analysis by End Use, 2022E to 2031F Figure 51: APEJ Market Share by Country (2022E to 2031F) Figure 52: APEJ Market Attractiveness Analysis by Country, 2022E to 2031F Figure 53: Middle East & Africa Market Share by Product (2022E to 2031F) Figure 54: Middle East & Africa Market Attractiveness Analysis by Product, 2022E to 2031F Figure 55: Middle East & Africa Market Share by Material (2022E to 2031F) Figure 56: Middle East & Africa Market Attractiveness Analysis by Material, 2022E to 2031F Figure 57: Middle East & Africa Market Share by End Use (2022E to 2031F) Figure 58: Middle East & Africa Market Attractiveness Analysis by End Use, 2022E to 2031F Figure 59: Middle East & Africa Market Share by Country (2022E to 2031F) Figure 60: Middle East & Africa Market Attractiveness Analysis by Country, 2022E to 2031F Figure 61: Japan Market Share by Product (2022E to 2031F) Figure 62: Japan Market Attractiveness Analysis by Product, 2022E to 2031F Figure 63: Japan Market Share by Material (2022E to 2031F) Figure 64: Japan Market Attractiveness Analysis by Material, 2022E to 2031F Figure 65: Japan Market Share by End Use (2022E to 2031F) Figure 66: Japan Market Attractiveness Analysis by End Use, 2022E to 2031F
Recommendations
Explore Packaging Insights
View Reports