This site uses cookies, including third-party cookies, that help us to provide and improve our services.

Privacy Policy
- Global Locations -
Headquarters
Future Market Insights, Inc.
Christiana Corporate, 200 Continental Drive, Suite 401, Newark, Delaware - 19713, United States
T: +1-845-579-5705
MEA
Market Access DMCC

1602-6 Jumeirah Bay X2 Tower, Plot No: JLT-PH2-X2A,

Jumeirah Lakes Towers, Dubai,

United Arab Emirates

Americas
Future Market Insights
616 Corporate Way, Suite 2-9018,
Valley Cottage, NY 10989,
United States
T: +1-347-918-3531
Europe
Future Market Insights
3rd Floor, 207 Regent Street,
London W1B 3HH
United Kingdom
T: + 44 (0) 20 8123 9659
D: +44 (0) 20 3287 4268
APAC
Future Market Insights
Office No. 401-A, 4th Floor,
VANTAGE 9, S.No. 36/1/1,
Baner, Pune 411045 India

Inner Bulk Liners Market

Market Insights on Inner Bulk Liners covering sales outlook, demand forecast & up-to-date key trends

Inner Bulk Liners Market by Type, Physical State, End User & Region - Forecast 2022 - 2032

Inner Bulk Liners Market Snapshot (2022-2032)

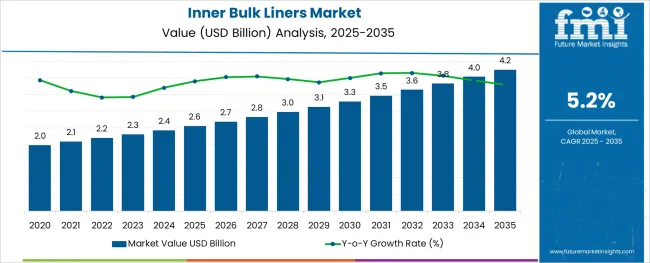
[291 Pages Report] The global Inner bulk liners market is expected to be valued at US$ 2,196.1 Million in 2022, expected to reach US$ 3,645.9 Million by 2032. A CAGR worth 5.2% is expected for the market during the 2022-2032 forecast period.

Inner bulk liners are utilized in large multilayer bags, corrugated boxes, multilayer paper bags, and woven sacks. The inner bulk liners are tightly sealed and leak-free. Inner bulk liners provide a solid barrier against pests, insects, and other external pollutants. Manufacturers can rely on inner bulk liners to keep their food or beverage product fresh and tasty for a long time. These are the primary drivers of this market.

Report Attribute

Details

Expected Market Value (2022)

US$ 2,196.1 Million

Projected Forecast Value (2032)

US$ 3,645.9 Million

Anticipated Growth Rate (2022-2032)

5.2%

Inner bulk liners also promote uniformity, resulting in a more secure stacking. They are also available in a number of sizes, making them appropriate for a wide range of applications. The vast majority of the inner bulk liners are tightly sealed. Inner bulk liners are made from virgin plastic resins and FDA-approved components. The liquid inner bulk liners are made of polypropylene film and polypropylene fabric.

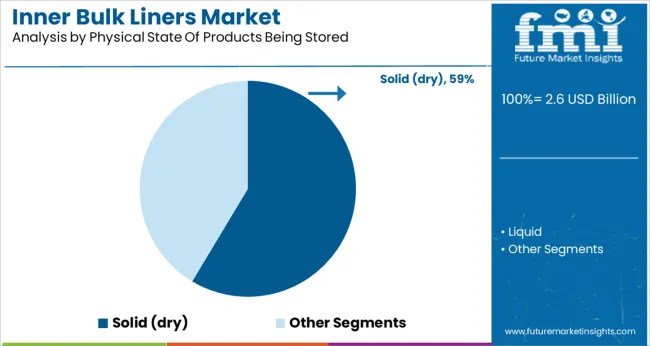
From the aspect of physical state, dry bulk container liners have mostly replaced corrugated boxes as a packing alternative due to their light weight and relatively good durability. Similarly, numerous products are not sent to other countries due to inadequate packaging methods. As a result, dry bulk container liners ensure that the product is sent in its original condition, which is boosting the target market's growth.

Customize this Report

Let us know your requirement to get
100% FREE customization

What are the Major Factors Boosting the Inner Bulk Liners Market?

The global demand for customized packaging solutions is propelling the expansion of the inner bulk liners market. The liberalization of numerous closed economies' international trade laws, together with increased exports and imports of FMCG & FMCD products (fast-moving consumer goods and fast-moving consumer durables), is also contributing to the rapid expansion of the inner bulk liners market.

The proliferation of e-commerce firms around the world necessitates safe and timely logistic services. Inner bulk lines improve product safety in fast-moving vehicles as well as during loading and unloading of goods, increasing market growth. Because of the greater humidity management of the inner bulk liners, it is suitable for water transport of commodities and thereby contributes to global market growth.

Inner bulk liners have been a significant advancement in the business. These liners have been widely utilized in the plastics sector to prevent leakage from drums and other containers. These liners allow hazardous materials to be transported and stored. The liners help minimize spills and leaks while being processed at a plant, creating positive chances for market growth.

What are the Factors Hindering the Inner Bulk Liners Market?

The difficulty in recycling inner bulk liners is limiting the market's expansion. Inner bulk liners are composed of non materials, making it difficult to reduce pollution caused by them.

Inner bulk liners assist both buyers and vendors in lowering overall packaging costs; hence, they have great growth potential; since practically all firms throughout the world strive to reduce costs in order to preserve and enhance profit margins.

Also, because this container may only be used for a particular type of material rather than various contents, the appropriate type of liners must be installed within the container. This issue will limit market expansion and pose further challenges to the inner bulk liners industry.

Ismail Sutaria
Ismail Sutaria
Principal Consultant
LinkedIn
Talk to Analyst

Find your sweet spots for generating winning opportunities in this market.

Talk to Analyst

What is the Outlook of the Dry Inner Bulk Liners Segment?

Liners for dry bulk containers are constructed of polypropylene, polyethylene, and other plastics. Dry bulk container liners are a low-cost option for interim storage and dry freight transit. Dry bulk container liners establish a barrier against any type of contamination between the interior of the container and reduce the risks of product damage, hence avoiding cargo contamination.

Dry bulk container liners reduce packaging waste because they are simple to install and can be reused. These liners are utilized in a variety of industries as a replacement for plastic containers and corrugated boxes. Such advancements are projected to drive the global market for inner bulk liners in the future.
What is the Outlook of the North American Inner Bulk Liners Market?

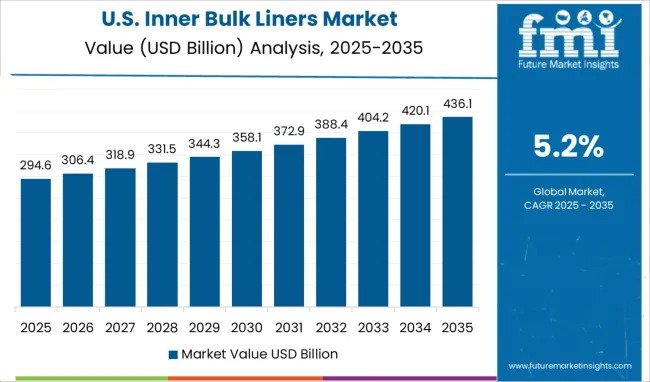
In terms of market share and revenue, the North American market is expected to grow steadily during the projection period of 2022-2032. The analysts at Future Market Insights predict that by 2022, the market of Inner bulk liners in North America is expected to acquire a global market size of 21%.

North America is predicted to grow rapidly in terms of market share and revenue share in the global inner bulk liners market during the forecast period. This is due to the region's increasing demand for inner bulk liners. Because of the increasing demand for automation in the food and beverage industries in this region, this region dominates this market.
MarketNage
Become a MarketNgage Insider

A unified Market Research Subscription Platform, built for today's disparate research needs.

How is the European Market Driving Demand for Inner Bulk Liners?

By 2022, Europe will hold approximately 26% of the global market share. This region is expected to be the fastest growing market in terms of revenue during the forecast period, 2022-2032.

Dry bulk container liners are a low-cost option for interim storage and dry freight transit. Dry bulk container liners establish a barrier against any type of contamination between the interior of the container and reduce the risks of product damage, hence avoiding cargo contamination.

Dry bulk container liners also reduce packaging waste because they are simple to install and can be reused. Such factors are going to boost the overall market demand in the European countries.

What can be Expected from the APAC Region During the Forecast Period?

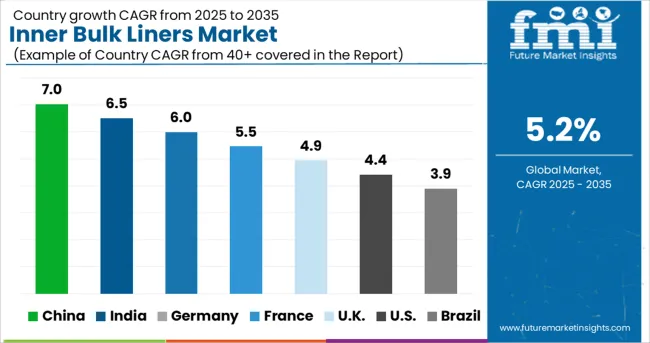
Rising urbanization and industrialization in developing economies such as Asia-Pacific have resulted in the growth of the chemical and food and beverage industries. Countries such as India, Japan, and South Korea are rapidly growing their food and chemical industries.

The use of storage equipment is expanding as the food and beverage industry expands rapidly. Manufacturers have increased their production capacity by implementing automation in their production facilities in response to rising demand. Packaged food is convenient, particularly for the working population, and hence the demand for storage of such food goods has grown over time. The market's producers have invested in the development of inner bulk liners that can be employed in automated lines.
Market Competition

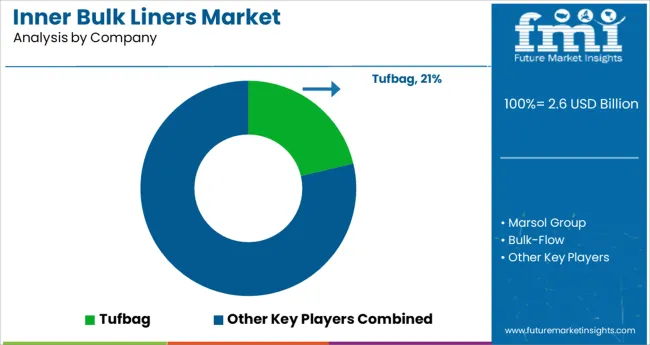
The leading competitors in the global intermediate bulk container (IBC) liners market are now focused on strategies such as product innovations, mergers and acquisitions, new advancements, collaborations, joint ventures, and partnerships to strengthen their market position.

The key players of this market include Tufbag, Marsol Group, Bulk-Flow, Thrace Group, Vishakha PolyFab Pvt. Ltd.

  • In September 2020, Amcor PLC collaborated with Swiss food giant Nestle to launch a breakthrough packaging solution in the recyclable packaging domain. The product in question is a recyclable retort pouch for cat food, expected to accrue an improvement of nearly 60% of the environmental footprint in consumer packaging.
  • In July 2020, CDF Corporation received a UN recertification for its fiberboard box with a plastic bag combination package, providing the highest levels of protection for transporting hazardous products requiring class II and III packaging. The packaging box underwent four rigorous performance tests, including drop, stacking vibration and Cobb water absorption.

Start-up Scenario

The start-up companies all across the world are vying for market share by seizing current opportunities. As a result, the majority of new corporations today choose product supply to promote ongoing industrialization and urbanization in order to get a competitive advantage over other organizations.

  • Vishakha provides a comprehensive selection of all-purpose films for gusseted and non-gusseted bags. These high-quality inner liners are suitable for multilayer paper, woven sacks, corrugated boxes, and large multilayer bags. The PA / EVOH-based barrier liners that can be hermetically sealed set them apart.
  • VISHVACU bags and Inner Bulk Liners have raised the bar in terms of packaging safety and security. They are highly tempered and cannot be resealed once sealed. This not only adds to the safety of the goods, but it also inhibits adulteration. Unlike jute or woven bags that are sewn to seal, VISHVACU has robust leak-proof sealing that cannot be tempered or adulterated during transport or storage.

Report Scope

Report Attribute

Details

Growth Rate

5.2% CAGR

Market value in 2022

US$ 2,196.1 Million

Market value in 2032

US$ 3,645.9 Million

Base Year for Estimation

2021

Historical Data

2016-2021

Forecast Period

2022-2032

Quantitative Units

USD Million for Value

Report Coverage

Revenue Forecast, Volume Forecast, Company Ranking, Competitive Landscape, Growth Factors, Trends, and Pricing Analysis

Segments Covered

  • Type
  • Physical state
  • End-user
  • Region

Regions Covered

  • North America
  • Latin America
  • Europe
  • Asia Pacific
  • Middle East & Africa

Key Countries Profiled

  • U.S.
  • Canada
  • Mexico
  • Brazil
  • Germany
  • Italy
  • France
  • U.K
  • Rest of L.A
  • Nordic countries
  • Belgium
  • Netherlands
  • Luxembourg
  • Poland
  • Russia
  • Rest Of Eastern Europe
  • China
  • India
  • ASEAN
  • Australia
  • New Zealand
  • Japan
  • GCC Countries
  • S. Africa
  • N. Africa
  • Rest of MEA

Key Companies Profiled

Customisation Scope

Available on Request

Key Segments Profiled In The Global Inner Bulk Liners Market

Inner Bulk Liners Market by End-user:

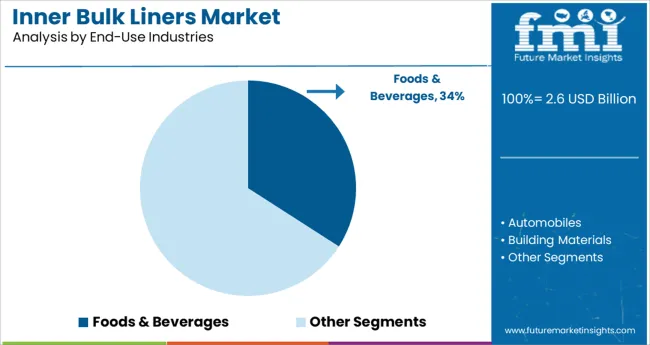
  • Inner bulk liners for foods & beverages
  • Inner bulk liners for automobiles
  • Inner bulk liners for building materials
  • Inner bulk liners for chemicals

Inner Bulk Liners Market by Physical State:

  • Solid (dry) inner bulk liners
  • Liquid inner bulk liners

Inner Bulk Liners Market by Type:

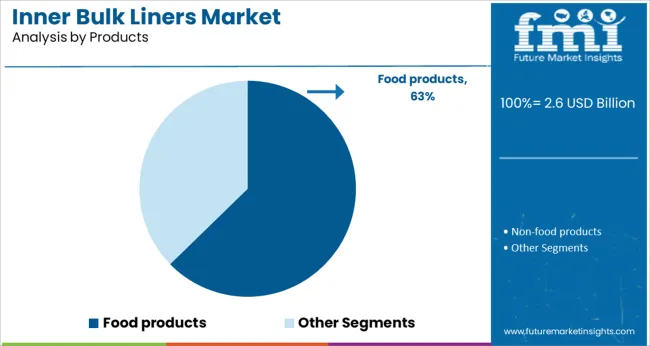
  • Inner bulk liners for food products
  • Inner bulk liners for non-food products

Inner Bulk Liners Market by Region:

  • Inner bulk liners market in North America
  • Inner bulk liners market in Latin America
  • Inner bulk liners market in Europe
  • Inner bulk liners market in Asia Pacific
  • Inner bulk liners market in MEA

Frequently Asked Questions

The global Inner bulk liners market is expected to grow at a 5.2% CAGR and secure US$ 3,645.9 Million by 2032.

Europe is expected to be the fastest growing market for Inner bulk liners during the forecast period and is expected to acquire a market share of 26% in 2022.

Tufbag, Marsol Group, Bulk-Flow, Thrace Group, Vishakha PolyFab Pvt. Ltd. are some of the known players in the Inner bulk liners market.

Table of Content

1. Executive Summary

    1.1. Global Market Outlook

    1.2. Demand-side Trends

    1.3. Supply-side Trends

    1.4. Technology Roadmap Analysis

    1.5. Analysis and Recommendations

2. Market Overview

    2.1. Market Coverage / Taxonomy

    2.2. Market Definition / Scope / Limitations

3. Market Background

    3.1. Market Dynamics

        3.1.1. Drivers

        3.1.2. Restraints

        3.1.3. Opportunity

        3.1.4. Trends

    3.2. Scenario Forecast

        3.2.1. Demand in Optimistic Scenario

        3.2.2. Demand in Likely Scenario

        3.2.3. Demand in Conservative Scenario

    3.3. Opportunity Map Analysis

    3.4. Product Life Cycle Analysis

    3.5. Supply Chain Analysis

        3.5.1. Supply Side Participants and their Roles

            3.5.1.1. Producers

            3.5.1.2. Mid-Level Participants (Traders/ Agents/ Brokers)

            3.5.1.3. Wholesalers and Distributors

        3.5.2. Value Added and Value Created at Node in the Supply Chain

        3.5.3. List of Raw Material Suppliers

        3.5.4. List of Existing and Potential Buyer’s

    3.6. Investment Feasibility Matrix

    3.7. Value Chain Analysis

        3.7.1. Profit Margin Analysis

        3.7.2. Wholesalers and Distributors

        3.7.3. Retailers

    3.8. PESTLE and Porter’s Analysis

    3.9. Regulatory Landscape

        3.9.1. By Key Regions

        3.9.2. By Key Countries

    3.10. Regional Parent Market Outlook

    3.11. Production and Consumption Statistics

    3.12. Import and Export Statistics

4. Global Inner Bulk Liners Market Analysis 2016-2021 and Forecast, 2022-2032

    4.1. Historical Market Size Value (US$ Mn) & Volume (Units) Analysis, 2016-2021

    4.2. Current and Future Market Size Value (US$ Mn) & Volume (Units) Projections, 2022-2032

        4.2.1. Y-o-Y Growth Trend Analysis

        4.2.2. Absolute $ Opportunity Analysis

5. Global Inner Bulk Liners Market Analysis 2016-2021 and Forecast 2022-2032, By End-Use Industries

    5.1. Introduction / Key Findings

    5.2. Historical Market Size Value (US$ Mn) & Volume (Units) Analysis By End-Use Industries, 2016-2021

    5.3. Current and Future Market Size Value (US$ Mn) & Volume (Units) Analysis and Forecast By End-Use Industries, 2022-2032

        5.3.1. Foods & Beverages

        5.3.2. Automobiles

        5.3.3. Building Materials

        5.3.4. Chemicals

    5.4. Y-o-Y Growth Trend Analysis By End-Use Industries, 2016-2021

    5.5. Absolute $ Opportunity Analysis By End-Use Industries, 2022-2032

6. Global Inner Bulk Liners Market Analysis 2016-2021 and Forecast 2022-2032, By Physical State Of Products Being Stored

    6.1. Introduction / Key Findings

    6.2. Historical Market Size Value (US$ Mn) & Volume (Units) Analysis By Physical State Of Products Being Stored, 2016-2021

    6.3. Current and Future Market Size Value (US$ Mn) & Volume (Units) Analysis and Forecast By Physical State Of Products Being Stored, 2022-2032

        6.3.1. Solid (dry)

        6.3.2. Liquid

    6.4. Y-o-Y Growth Trend Analysis By Physical State Of Products Being Stored, 2016-2021

    6.5. Absolute $ Opportunity Analysis By Physical State Of Products Being Stored, 2022-2032

7. Global Inner Bulk Liners Market Analysis 2016-2021 and Forecast 2022-2032, By Products

    7.1. Introduction / Key Findings

    7.2. Historical Market Size Value (US$ Mn) & Volume (Units) Analysis By Products, 2016-2021

    7.3. Current and Future Market Size Value (US$ Mn) & Volume (Units) Analysis and Forecast By Products, 2022-2032

        7.3.1. Food products

        7.3.2. Non-food products

    7.4. Y-o-Y Growth Trend Analysis By Products, 2016-2021

    7.5. Absolute $ Opportunity Analysis By Products, 2022-2032

8. Global Inner Bulk Liners Market Analysis 2016-2021 and Forecast 2022-2032, By Region

    8.1. Introduction

    8.2. Historical Market Size Value (US$ Mn) & Volume (Units) Analysis By Region, 2016-2021

    8.3. Current Market Size Value (US$ Mn) & Volume (Units) Analysis and Forecast By Region, 2022-2032

        8.3.1. North America

        8.3.2. Latin America

        8.3.3. Europe

        8.3.4. Asia Pacific

        8.3.5. MEA

    8.4. Market Attractiveness Analysis By Region

9. North America Inner Bulk Liners Market Analysis 2016-2021 and Forecast 2022-2032, By Country

    9.1. Historical Market Size Value (US$ Mn) & Volume (Units) Trend Analysis By Market Taxonomy, 2016-2021

    9.2. Market Size Value (US$ Mn) & Volume (Units) Forecast By Market Taxonomy, 2022-2032

        9.2.1. By Country

            9.2.1.1. U.S.

            9.2.1.2. Canada

        9.2.2. By End-Use Industries

        9.2.3. By Physical State Of Products Being Stored

        9.2.4. By Products

    9.3. Market Attractiveness Analysis

        9.3.1. By Country

        9.3.2. By End-Use Industries

        9.3.3. By Physical State Of Products Being Stored

        9.3.4. By Products

    9.4. Key Takeaways

10. Latin America Inner Bulk Liners Market Analysis 2016-2021 and Forecast 2022-2032, By Country

    10.1. Historical Market Size Value (US$ Mn) & Volume (Units) Trend Analysis By Market Taxonomy, 2016-2021

    10.2. Market Size Value (US$ Mn) & Volume (Units) Forecast By Market Taxonomy, 2022-2032

        10.2.1. By Country

            10.2.1.1. Brazil

            10.2.1.2. Mexico

            10.2.1.3. Rest of Latin America

        10.2.2. By End-Use Industries

        10.2.3. By Physical State Of Products Being Stored

        10.2.4. By Products

    10.3. Market Attractiveness Analysis

        10.3.1. By Country

        10.3.2. By End-Use Industries

        10.3.3. By Physical State Of Products Being Stored

        10.3.4. By Products

    10.4. Key Takeaways

11. Europe Inner Bulk Liners Market Analysis 2016-2021 and Forecast 2022-2032, By Country

    11.1. Historical Market Size Value (US$ Mn) & Volume (Units) Trend Analysis By Market Taxonomy, 2016-2021

    11.2. Market Size Value (US$ Mn) & Volume (Units) Forecast By Market Taxonomy, 2022-2032

        11.2.1. By Country

            11.2.1.1. Germany

            11.2.1.2. U.K.

            11.2.1.3. France

            11.2.1.4. Spain

            11.2.1.5. Italy

            11.2.1.6. Rest of Europe

        11.2.2. By End-Use Industries

        11.2.3. By Physical State Of Products Being Stored

        11.2.4. By Products

    11.3. Market Attractiveness Analysis

        11.3.1. By Country

        11.3.2. By End-Use Industries

        11.3.3. By Physical State Of Products Being Stored

        11.3.4. By Products

    11.4. Key Takeaways

12. Asia Pacific Inner Bulk Liners Market Analysis 2016-2021 and Forecast 2022-2032, By Country

    12.1. Historical Market Size Value (US$ Mn) & Volume (Units) Trend Analysis By Market Taxonomy, 2016-2021

    12.2. Market Size Value (US$ Mn) & Volume (Units) Forecast By Market Taxonomy, 2022-2032

        12.2.1. By Country

            12.2.1.1. China

            12.2.1.2. Japan

            12.2.1.3. South Korea

            12.2.1.4. Malaysia

            12.2.1.5. Singapore

            12.2.1.6. Australia

            12.2.1.7. New Zealand

            12.2.1.8. Rest of APAC

        12.2.2. By End-Use Industries

        12.2.3. By Physical State Of Products Being Stored

        12.2.4. By Products

    12.3. Market Attractiveness Analysis

        12.3.1. By Country

        12.3.2. By End-Use Industries

        12.3.3. By Physical State Of Products Being Stored

        12.3.4. By Products

    12.4. Key Takeaways

13. MEA Inner Bulk Liners Market Analysis 2016-2021 and Forecast 2022-2032, By Country

    13.1. Historical Market Size Value (US$ Mn) & Volume (Units) Trend Analysis By Market Taxonomy, 2016-2021

    13.2. Market Size Value (US$ Mn) & Volume (Units) Forecast By Market Taxonomy, 2022-2032

        13.2.1. By Country

            13.2.1.1. GCC Countries

            13.2.1.2. South Africa

            13.2.1.3. Israel

            13.2.1.4. Rest of MEA

        13.2.2. By End-Use Industries

        13.2.3. By Physical State Of Products Being Stored

        13.2.4. By Products

    13.3. Market Attractiveness Analysis

        13.3.1. By Country

        13.3.2. By End-Use Industries

        13.3.3. By Physical State Of Products Being Stored

        13.3.4. By Products

    13.4. Key Takeaways

14. Key Countries Inner Bulk Liners Market Analysis

    14.1. U.S.

        14.1.1. Pricing Analysis

        14.1.2. Market Share Analysis, 2021

            14.1.2.1. By End-Use Industries

            14.1.2.2. By Physical State Of Products Being Stored

            14.1.2.3. By Products

    14.2. Canada

        14.2.1. Pricing Analysis

        14.2.2. Market Share Analysis, 2021

            14.2.2.1. By End-Use Industries

            14.2.2.2. By Physical State Of Products Being Stored

            14.2.2.3. By Products

    14.3. Brazil

        14.3.1. Pricing Analysis

        14.3.2. Market Share Analysis, 2021

            14.3.2.1. By End-Use Industries

            14.3.2.2. By Physical State Of Products Being Stored

            14.3.2.3. By Products

    14.4. Mexico

        14.4.1. Pricing Analysis

        14.4.2. Market Share Analysis, 2021

            14.4.2.1. By End-Use Industries

            14.4.2.2. By Physical State Of Products Being Stored

            14.4.2.3. By Products

    14.5. Germany

        14.5.1. Pricing Analysis

        14.5.2. Market Share Analysis, 2021

            14.5.2.1. By End-Use Industries

            14.5.2.2. By Physical State Of Products Being Stored

            14.5.2.3. By Products

    14.6. U.K.

        14.6.1. Pricing Analysis

        14.6.2. Market Share Analysis, 2021

            14.6.2.1. By End-Use Industries

            14.6.2.2. By Physical State Of Products Being Stored

            14.6.2.3. By Products

    14.7. France

        14.7.1. Pricing Analysis

        14.7.2. Market Share Analysis, 2021

            14.7.2.1. By End-Use Industries

            14.7.2.2. By Physical State Of Products Being Stored

            14.7.2.3. By Products

    14.8. Spain

        14.8.1. Pricing Analysis

        14.8.2. Market Share Analysis, 2021

            14.8.2.1. By End-Use Industries

            14.8.2.2. By Physical State Of Products Being Stored

            14.8.2.3. By Products

    14.9. Italy

        14.9.1. Pricing Analysis

        14.9.2. Market Share Analysis, 2021

            14.9.2.1. By End-Use Industries

            14.9.2.2. By Physical State Of Products Being Stored

            14.9.2.3. By Products

    14.10. China

        14.10.1. Pricing Analysis

        14.10.2. Market Share Analysis, 2021

            14.10.2.1. By End-Use Industries

            14.10.2.2. By Physical State Of Products Being Stored

            14.10.2.3. By Products

    14.11. Japan

        14.11.1. Pricing Analysis

        14.11.2. Market Share Analysis, 2021

            14.11.2.1. By End-Use Industries

            14.11.2.2. By Physical State Of Products Being Stored

            14.11.2.3. By Products

    14.12. South Korea

        14.12.1. Pricing Analysis

        14.12.2. Market Share Analysis, 2021

            14.12.2.1. By End-Use Industries

            14.12.2.2. By Physical State Of Products Being Stored

            14.12.2.3. By Products

    14.13. Malaysia

        14.13.1. Pricing Analysis

        14.13.2. Market Share Analysis, 2021

            14.13.2.1. By End-Use Industries

            14.13.2.2. By Physical State Of Products Being Stored

            14.13.2.3. By Products

    14.14. Singapore

        14.14.1. Pricing Analysis

        14.14.2. Market Share Analysis, 2021

            14.14.2.1. By End-Use Industries

            14.14.2.2. By Physical State Of Products Being Stored

            14.14.2.3. By Products

    14.15. Australia

        14.15.1. Pricing Analysis

        14.15.2. Market Share Analysis, 2021

            14.15.2.1. By End-Use Industries

            14.15.2.2. By Physical State Of Products Being Stored

            14.15.2.3. By Products

    14.16. New Zealand

        14.16.1. Pricing Analysis

        14.16.2. Market Share Analysis, 2021

            14.16.2.1. By End-Use Industries

            14.16.2.2. By Physical State Of Products Being Stored

            14.16.2.3. By Products

    14.17. GCC Countries

        14.17.1. Pricing Analysis

        14.17.2. Market Share Analysis, 2021

            14.17.2.1. By End-Use Industries

            14.17.2.2. By Physical State Of Products Being Stored

            14.17.2.3. By Products

    14.18. South Africa

        14.18.1. Pricing Analysis

        14.18.2. Market Share Analysis, 2021

            14.18.2.1. By End-Use Industries

            14.18.2.2. By Physical State Of Products Being Stored

            14.18.2.3. By Products

    14.19. Israel

        14.19.1. Pricing Analysis

        14.19.2. Market Share Analysis, 2021

            14.19.2.1. By End-Use Industries

            14.19.2.2. By Physical State Of Products Being Stored

            14.19.2.3. By Products

15. Market Structure Analysis

    15.1. Competition Dashboard

    15.2. Competition Benchmarking

    15.3. Market Share Analysis of Top Players

        15.3.1. By Regional

        15.3.2. By End-Use Industries

        15.3.3. By Physical State Of Products Being Stored

        15.3.4. By Products

16. Competition Analysis

    16.1. Competition Deep Dive

        16.1.1. Tufbag

            16.1.1.1. Overview

            16.1.1.2. Product Portfolio

            16.1.1.3. Profitability by Market Segments

            16.1.1.4. Sales Footprint

            16.1.1.5. Strategy Overview

                16.1.1.5.1. Marketing Strategy

                16.1.1.5.2. Product Strategy

                16.1.1.5.3. Channel Strategy

        16.1.2. Marsol Group

            16.1.2.1. Overview

            16.1.2.2. Product Portfolio

            16.1.2.3. Profitability by Market Segments

            16.1.2.4. Sales Footprint

            16.1.2.5. Strategy Overview

                16.1.2.5.1. Marketing Strategy

                16.1.2.5.2. Product Strategy

                16.1.2.5.3. Channel Strategy

        16.1.3. Bulk-Flow

            16.1.3.1. Overview

            16.1.3.2. Product Portfolio

            16.1.3.3. Profitability by Market Segments

            16.1.3.4. Sales Footprint

            16.1.3.5. Strategy Overview

                16.1.3.5.1. Marketing Strategy

                16.1.3.5.2. Product Strategy

                16.1.3.5.3. Channel Strategy

        16.1.4. Thrace Group

            16.1.4.1. Overview

            16.1.4.2. Product Portfolio

            16.1.4.3. Profitability by Market Segments

            16.1.4.4. Sales Footprint

            16.1.4.5. Strategy Overview

                16.1.4.5.1. Marketing Strategy

                16.1.4.5.2. Product Strategy

                16.1.4.5.3. Channel Strategy

        16.1.5. Vishakha PolyFab Pvt. Ltd.

            16.1.5.1. Overview

            16.1.5.2. Product Portfolio

            16.1.5.3. Profitability by Market Segments

            16.1.5.4. Sales Footprint

            16.1.5.5. Strategy Overview

                16.1.5.5.1. Marketing Strategy

                16.1.5.5.2. Product Strategy

                16.1.5.5.3. Channel Strategy

        16.1.6. Baroda Packaging

            16.1.6.1. Overview

            16.1.6.2. Product Portfolio

            16.1.6.3. Profitability by Market Segments

            16.1.6.4. Sales Footprint

            16.1.6.5. Strategy Overview

                16.1.6.5.1. Marketing Strategy

                16.1.6.5.2. Product Strategy

                16.1.6.5.3. Channel Strategy

        16.1.7. Vibrant Polyplast LLP

            16.1.7.1. Overview

            16.1.7.2. Product Portfolio

            16.1.7.3. Profitability by Market Segments

            16.1.7.4. Sales Footprint

            16.1.7.5. Strategy Overview

                16.1.7.5.1. Marketing Strategy

                16.1.7.5.2. Product Strategy

                16.1.7.5.3. Channel Strategy

        16.1.8. LC Packaging

            16.1.8.1. Overview

            16.1.8.2. Product Portfolio

            16.1.8.3. Profitability by Market Segments

            16.1.8.4. Sales Footprint

            16.1.8.5. Strategy Overview

                16.1.8.5.1. Marketing Strategy

                16.1.8.5.2. Product Strategy

                16.1.8.5.3. Channel Strategy

        16.1.9. Qingdao LAF Packaging

            16.1.9.1. Overview

            16.1.9.2. Product Portfolio

            16.1.9.3. Profitability by Market Segments

            16.1.9.4. Sales Footprint

            16.1.9.5. Strategy Overview

                16.1.9.5.1. Marketing Strategy

                16.1.9.5.2. Product Strategy

                16.1.9.5.3. Channel Strategy

        16.1.10. Peak Packaging

            16.1.10.1. Overview

            16.1.10.2. Product Portfolio

            16.1.10.3. Profitability by Market Segments

            16.1.10.4. Sales Footprint

            16.1.10.5. Strategy Overview

                16.1.10.5.1. Marketing Strategy

                16.1.10.5.2. Product Strategy

                16.1.10.5.3. Channel Strategy

17. Assumptions & Acronyms Used

18. Research Methodology
Customize this Report

Let us know your requirement to get
100% FREE customization

List of Tables

Table 1: Global Inner Bulk Liners Market Value (US$ Mn) Forecast by Region, 2016-2032

Table 2: Global Inner Bulk Liners Market Volume (Units) Forecast by Region, 2016-2032

Table 3: Global Inner Bulk Liners Market Value (US$ Mn) Forecast by End-Use Industries, 2016-2032

Table 4: Global Inner Bulk Liners Market Volume (Units) Forecast by End-Use Industries, 2016-2032

Table 5: Global Inner Bulk Liners Market Value (US$ Mn) Forecast by Physical State Of Products Being Stored, 2016-2032

Table 6: Global Inner Bulk Liners Market Volume (Units) Forecast by Physical State Of Products Being Stored, 2016-2032

Table 7: Global Inner Bulk Liners Market Value (US$ Mn) Forecast by Products, 2016-2032

Table 8: Global Inner Bulk Liners Market Volume (Units) Forecast by Products, 2016-2032

Table 9: North America Inner Bulk Liners Market Value (US$ Mn) Forecast by Country, 2016-2032

Table 10: North America Inner Bulk Liners Market Volume (Units) Forecast by Country, 2016-2032

Table 11: North America Inner Bulk Liners Market Value (US$ Mn) Forecast by End-Use Industries, 2016-2032

Table 12: North America Inner Bulk Liners Market Volume (Units) Forecast by End-Use Industries, 2016-2032

Table 13: North America Inner Bulk Liners Market Value (US$ Mn) Forecast by Physical State Of Products Being Stored, 2016-2032

Table 14: North America Inner Bulk Liners Market Volume (Units) Forecast by Physical State Of Products Being Stored, 2016-2032

Table 15: North America Inner Bulk Liners Market Value (US$ Mn) Forecast by Products, 2016-2032

Table 16: North America Inner Bulk Liners Market Volume (Units) Forecast by Products, 2016-2032

Table 17: Latin America Inner Bulk Liners Market Value (US$ Mn) Forecast by Country, 2016-2032

Table 18: Latin America Inner Bulk Liners Market Volume (Units) Forecast by Country, 2016-2032

Table 19: Latin America Inner Bulk Liners Market Value (US$ Mn) Forecast by End-Use Industries, 2016-2032

Table 20: Latin America Inner Bulk Liners Market Volume (Units) Forecast by End-Use Industries, 2016-2032

Table 21: Latin America Inner Bulk Liners Market Value (US$ Mn) Forecast by Physical State Of Products Being Stored, 2016-2032

Table 22: Latin America Inner Bulk Liners Market Volume (Units) Forecast by Physical State Of Products Being Stored, 2016-2032

Table 23: Latin America Inner Bulk Liners Market Value (US$ Mn) Forecast by Products, 2016-2032

Table 24: Latin America Inner Bulk Liners Market Volume (Units) Forecast by Products, 2016-2032

Table 25: Europe Inner Bulk Liners Market Value (US$ Mn) Forecast by Country, 2016-2032

Table 26: Europe Inner Bulk Liners Market Volume (Units) Forecast by Country, 2016-2032

Table 27: Europe Inner Bulk Liners Market Value (US$ Mn) Forecast by End-Use Industries, 2016-2032

Table 28: Europe Inner Bulk Liners Market Volume (Units) Forecast by End-Use Industries, 2016-2032

Table 29: Europe Inner Bulk Liners Market Value (US$ Mn) Forecast by Physical State Of Products Being Stored, 2016-2032

Table 30: Europe Inner Bulk Liners Market Volume (Units) Forecast by Physical State Of Products Being Stored, 2016-2032

Table 31: Europe Inner Bulk Liners Market Value (US$ Mn) Forecast by Products, 2016-2032

Table 32: Europe Inner Bulk Liners Market Volume (Units) Forecast by Products, 2016-2032

Table 33: Asia Pacific Inner Bulk Liners Market Value (US$ Mn) Forecast by Country, 2016-2032

Table 34: Asia Pacific Inner Bulk Liners Market Volume (Units) Forecast by Country, 2016-2032

Table 35: Asia Pacific Inner Bulk Liners Market Value (US$ Mn) Forecast by End-Use Industries, 2016-2032

Table 36: Asia Pacific Inner Bulk Liners Market Volume (Units) Forecast by End-Use Industries, 2016-2032

Table 37: Asia Pacific Inner Bulk Liners Market Value (US$ Mn) Forecast by Physical State Of Products Being Stored, 2016-2032

Table 38: Asia Pacific Inner Bulk Liners Market Volume (Units) Forecast by Physical State Of Products Being Stored, 2016-2032

Table 39: Asia Pacific Inner Bulk Liners Market Value (US$ Mn) Forecast by Products, 2016-2032

Table 40: Asia Pacific Inner Bulk Liners Market Volume (Units) Forecast by Products, 2016-2032

Table 41: MEA Inner Bulk Liners Market Value (US$ Mn) Forecast by Country, 2016-2032

Table 42: MEA Inner Bulk Liners Market Volume (Units) Forecast by Country, 2016-2032

Table 43: MEA Inner Bulk Liners Market Value (US$ Mn) Forecast by End-Use Industries, 2016-2032

Table 44: MEA Inner Bulk Liners Market Volume (Units) Forecast by End-Use Industries, 2016-2032

Table 45: MEA Inner Bulk Liners Market Value (US$ Mn) Forecast by Physical State Of Products Being Stored, 2016-2032

Table 46: MEA Inner Bulk Liners Market Volume (Units) Forecast by Physical State Of Products Being Stored, 2016-2032

Table 47: MEA Inner Bulk Liners Market Value (US$ Mn) Forecast by Products, 2016-2032

Table 48: MEA Inner Bulk Liners Market Volume (Units) Forecast by Products, 2016-2032
Ismail Sutaria
Principal Consultant
LinkedIn
Talk to Analyst

Find your sweet spots for generating winning opportunities in this market.

Talk to Analyst

List of Charts

Figure 1: Global Inner Bulk Liners Market Value (US$ Mn) by End-Use Industries, 2022-2032

Figure 2: Global Inner Bulk Liners Market Value (US$ Mn) by Physical State Of Products Being Stored, 2022-2032

Figure 3: Global Inner Bulk Liners Market Value (US$ Mn) by Products, 2022-2032

Figure 4: Global Inner Bulk Liners Market Value (US$ Mn) by Region, 2022-2032

Figure 5: Global Inner Bulk Liners Market Value (US$ Mn) Analysis by Region, 2016-2032

Figure 6: Global Inner Bulk Liners Market Volume (Units) Analysis by Region, 2016-2032

Figure 7: Global Inner Bulk Liners Market Value Share (%) and BPS Analysis by Region, 2022-2032

Figure 8: Global Inner Bulk Liners Market Y-o-Y Growth (%) Projections by Region, 2022-2032

Figure 9: Global Inner Bulk Liners Market Value (US$ Mn) Analysis by End-Use Industries, 2016-2032

Figure 10: Global Inner Bulk Liners Market Volume (Units) Analysis by End-Use Industries, 2016-2032

Figure 11: Global Inner Bulk Liners Market Value Share (%) and BPS Analysis by End-Use Industries, 2022-2032

Figure 12: Global Inner Bulk Liners Market Y-o-Y Growth (%) Projections by End-Use Industries, 2022-2032

Figure 13: Global Inner Bulk Liners Market Value (US$ Mn) Analysis by Physical State Of Products Being Stored, 2016-2032

Figure 14: Global Inner Bulk Liners Market Volume (Units) Analysis by Physical State Of Products Being Stored, 2016-2032

Figure 15: Global Inner Bulk Liners Market Value Share (%) and BPS Analysis by Physical State Of Products Being Stored, 2022-2032

Figure 16: Global Inner Bulk Liners Market Y-o-Y Growth (%) Projections by Physical State Of Products Being Stored, 2022-2032

Figure 17: Global Inner Bulk Liners Market Value (US$ Mn) Analysis by Products, 2016-2032

Figure 18: Global Inner Bulk Liners Market Volume (Units) Analysis by Products, 2016-2032

Figure 19: Global Inner Bulk Liners Market Value Share (%) and BPS Analysis by Products, 2022-2032

Figure 20: Global Inner Bulk Liners Market Y-o-Y Growth (%) Projections by Products, 2022-2032

Figure 21: Global Inner Bulk Liners Market Attractiveness by End-Use Industries, 2022-2032

Figure 22: Global Inner Bulk Liners Market Attractiveness by Physical State Of Products Being Stored, 2022-2032

Figure 23: Global Inner Bulk Liners Market Attractiveness by Products, 2022-2032

Figure 24: Global Inner Bulk Liners Market Attractiveness by Region, 2022-2032

Figure 25: North America Inner Bulk Liners Market Value (US$ Mn) by End-Use Industries, 2022-2032

Figure 26: North America Inner Bulk Liners Market Value (US$ Mn) by Physical State Of Products Being Stored, 2022-2032

Figure 27: North America Inner Bulk Liners Market Value (US$ Mn) by Products, 2022-2032

Figure 28: North America Inner Bulk Liners Market Value (US$ Mn) by Country, 2022-2032

Figure 29: North America Inner Bulk Liners Market Value (US$ Mn) Analysis by Country, 2016-2032

Figure 30: North America Inner Bulk Liners Market Volume (Units) Analysis by Country, 2016-2032

Figure 31: North America Inner Bulk Liners Market Value Share (%) and BPS Analysis by Country, 2022-2032

Figure 32: North America Inner Bulk Liners Market Y-o-Y Growth (%) Projections by Country, 2022-2032

Figure 33: North America Inner Bulk Liners Market Value (US$ Mn) Analysis by End-Use Industries, 2016-2032

Figure 34: North America Inner Bulk Liners Market Volume (Units) Analysis by End-Use Industries, 2016-2032

Figure 35: North America Inner Bulk Liners Market Value Share (%) and BPS Analysis by End-Use Industries, 2022-2032

Figure 36: North America Inner Bulk Liners Market Y-o-Y Growth (%) Projections by End-Use Industries, 2022-2032

Figure 37: North America Inner Bulk Liners Market Value (US$ Mn) Analysis by Physical State Of Products Being Stored, 2016-2032

Figure 38: North America Inner Bulk Liners Market Volume (Units) Analysis by Physical State Of Products Being Stored, 2016-2032

Figure 39: North America Inner Bulk Liners Market Value Share (%) and BPS Analysis by Physical State Of Products Being Stored, 2022-2032

Figure 40: North America Inner Bulk Liners Market Y-o-Y Growth (%) Projections by Physical State Of Products Being Stored, 2022-2032

Figure 41: North America Inner Bulk Liners Market Value (US$ Mn) Analysis by Products, 2016-2032

Figure 42: North America Inner Bulk Liners Market Volume (Units) Analysis by Products, 2016-2032

Figure 43: North America Inner Bulk Liners Market Value Share (%) and BPS Analysis by Products, 2022-2032

Figure 44: North America Inner Bulk Liners Market Y-o-Y Growth (%) Projections by Products, 2022-2032

Figure 45: North America Inner Bulk Liners Market Attractiveness by End-Use Industries, 2022-2032

Figure 46: North America Inner Bulk Liners Market Attractiveness by Physical State Of Products Being Stored, 2022-2032

Figure 47: North America Inner Bulk Liners Market Attractiveness by Products, 2022-2032

Figure 48: North America Inner Bulk Liners Market Attractiveness by Country, 2022-2032

Figure 49: Latin America Inner Bulk Liners Market Value (US$ Mn) by End-Use Industries, 2022-2032

Figure 50: Latin America Inner Bulk Liners Market Value (US$ Mn) by Physical State Of Products Being Stored, 2022-2032

Figure 51: Latin America Inner Bulk Liners Market Value (US$ Mn) by Products, 2022-2032

Figure 52: Latin America Inner Bulk Liners Market Value (US$ Mn) by Country, 2022-2032

Figure 53: Latin America Inner Bulk Liners Market Value (US$ Mn) Analysis by Country, 2016-2032

Figure 54: Latin America Inner Bulk Liners Market Volume (Units) Analysis by Country, 2016-2032

Figure 55: Latin America Inner Bulk Liners Market Value Share (%) and BPS Analysis by Country, 2022-2032

Figure 56: Latin America Inner Bulk Liners Market Y-o-Y Growth (%) Projections by Country, 2022-2032

Figure 57: Latin America Inner Bulk Liners Market Value (US$ Mn) Analysis by End-Use Industries, 2016-2032

Figure 58: Latin America Inner Bulk Liners Market Volume (Units) Analysis by End-Use Industries, 2016-2032

Figure 59: Latin America Inner Bulk Liners Market Value Share (%) and BPS Analysis by End-Use Industries, 2022-2032

Figure 60: Latin America Inner Bulk Liners Market Y-o-Y Growth (%) Projections by End-Use Industries, 2022-2032

Figure 61: Latin America Inner Bulk Liners Market Value (US$ Mn) Analysis by Physical State Of Products Being Stored, 2016-2032

Figure 62: Latin America Inner Bulk Liners Market Volume (Units) Analysis by Physical State Of Products Being Stored, 2016-2032

Figure 63: Latin America Inner Bulk Liners Market Value Share (%) and BPS Analysis by Physical State Of Products Being Stored, 2022-2032

Figure 64: Latin America Inner Bulk Liners Market Y-o-Y Growth (%) Projections by Physical State Of Products Being Stored, 2022-2032

Figure 65: Latin America Inner Bulk Liners Market Value (US$ Mn) Analysis by Products, 2016-2032

Figure 66: Latin America Inner Bulk Liners Market Volume (Units) Analysis by Products, 2016-2032

Figure 67: Latin America Inner Bulk Liners Market Value Share (%) and BPS Analysis by Products, 2022-2032

Figure 68: Latin America Inner Bulk Liners Market Y-o-Y Growth (%) Projections by Products, 2022-2032

Figure 69: Latin America Inner Bulk Liners Market Attractiveness by End-Use Industries, 2022-2032

Figure 70: Latin America Inner Bulk Liners Market Attractiveness by Physical State Of Products Being Stored, 2022-2032

Figure 71: Latin America Inner Bulk Liners Market Attractiveness by Products, 2022-2032

Figure 72: Latin America Inner Bulk Liners Market Attractiveness by Country, 2022-2032

Figure 73: Europe Inner Bulk Liners Market Value (US$ Mn) by End-Use Industries, 2022-2032

Figure 74: Europe Inner Bulk Liners Market Value (US$ Mn) by Physical State Of Products Being Stored, 2022-2032

Figure 75: Europe Inner Bulk Liners Market Value (US$ Mn) by Products, 2022-2032

Figure 76: Europe Inner Bulk Liners Market Value (US$ Mn) by Country, 2022-2032

Figure 77: Europe Inner Bulk Liners Market Value (US$ Mn) Analysis by Country, 2016-2032

Figure 78: Europe Inner Bulk Liners Market Volume (Units) Analysis by Country, 2016-2032

Figure 79: Europe Inner Bulk Liners Market Value Share (%) and BPS Analysis by Country, 2022-2032

Figure 80: Europe Inner Bulk Liners Market Y-o-Y Growth (%) Projections by Country, 2022-2032

Figure 81: Europe Inner Bulk Liners Market Value (US$ Mn) Analysis by End-Use Industries, 2016-2032

Figure 82: Europe Inner Bulk Liners Market Volume (Units) Analysis by End-Use Industries, 2016-2032

Figure 83: Europe Inner Bulk Liners Market Value Share (%) and BPS Analysis by End-Use Industries, 2022-2032

Figure 84: Europe Inner Bulk Liners Market Y-o-Y Growth (%) Projections by End-Use Industries, 2022-2032

Figure 85: Europe Inner Bulk Liners Market Value (US$ Mn) Analysis by Physical State Of Products Being Stored, 2016-2032

Figure 86: Europe Inner Bulk Liners Market Volume (Units) Analysis by Physical State Of Products Being Stored, 2016-2032

Figure 87: Europe Inner Bulk Liners Market Value Share (%) and BPS Analysis by Physical State Of Products Being Stored, 2022-2032

Figure 88: Europe Inner Bulk Liners Market Y-o-Y Growth (%) Projections by Physical State Of Products Being Stored, 2022-2032

Figure 89: Europe Inner Bulk Liners Market Value (US$ Mn) Analysis by Products, 2016-2032

Figure 90: Europe Inner Bulk Liners Market Volume (Units) Analysis by Products, 2016-2032

Figure 91: Europe Inner Bulk Liners Market Value Share (%) and BPS Analysis by Products, 2022-2032

Figure 92: Europe Inner Bulk Liners Market Y-o-Y Growth (%) Projections by Products, 2022-2032

Figure 93: Europe Inner Bulk Liners Market Attractiveness by End-Use Industries, 2022-2032

Figure 94: Europe Inner Bulk Liners Market Attractiveness by Physical State Of Products Being Stored, 2022-2032

Figure 95: Europe Inner Bulk Liners Market Attractiveness by Products, 2022-2032

Figure 96: Europe Inner Bulk Liners Market Attractiveness by Country, 2022-2032

Figure 97: Asia Pacific Inner Bulk Liners Market Value (US$ Mn) by End-Use Industries, 2022-2032

Figure 98: Asia Pacific Inner Bulk Liners Market Value (US$ Mn) by Physical State Of Products Being Stored, 2022-2032

Figure 99: Asia Pacific Inner Bulk Liners Market Value (US$ Mn) by Products, 2022-2032

Figure 100: Asia Pacific Inner Bulk Liners Market Value (US$ Mn) by Country, 2022-2032

Figure 101: Asia Pacific Inner Bulk Liners Market Value (US$ Mn) Analysis by Country, 2016-2032

Figure 102: Asia Pacific Inner Bulk Liners Market Volume (Units) Analysis by Country, 2016-2032

Figure 103: Asia Pacific Inner Bulk Liners Market Value Share (%) and BPS Analysis by Country, 2022-2032

Figure 104: Asia Pacific Inner Bulk Liners Market Y-o-Y Growth (%) Projections by Country, 2022-2032

Figure 105: Asia Pacific Inner Bulk Liners Market Value (US$ Mn) Analysis by End-Use Industries, 2016-2032

Figure 106: Asia Pacific Inner Bulk Liners Market Volume (Units) Analysis by End-Use Industries, 2016-2032

Figure 107: Asia Pacific Inner Bulk Liners Market Value Share (%) and BPS Analysis by End-Use Industries, 2022-2032

Figure 108: Asia Pacific Inner Bulk Liners Market Y-o-Y Growth (%) Projections by End-Use Industries, 2022-2032

Figure 109: Asia Pacific Inner Bulk Liners Market Value (US$ Mn) Analysis by Physical State Of Products Being Stored, 2016-2032

Figure 110: Asia Pacific Inner Bulk Liners Market Volume (Units) Analysis by Physical State Of Products Being Stored, 2016-2032

Figure 111: Asia Pacific Inner Bulk Liners Market Value Share (%) and BPS Analysis by Physical State Of Products Being Stored, 2022-2032

Figure 112: Asia Pacific Inner Bulk Liners Market Y-o-Y Growth (%) Projections by Physical State Of Products Being Stored, 2022-2032

Figure 113: Asia Pacific Inner Bulk Liners Market Value (US$ Mn) Analysis by Products, 2016-2032

Figure 114: Asia Pacific Inner Bulk Liners Market Volume (Units) Analysis by Products, 2016-2032

Figure 115: Asia Pacific Inner Bulk Liners Market Value Share (%) and BPS Analysis by Products, 2022-2032

Figure 116: Asia Pacific Inner Bulk Liners Market Y-o-Y Growth (%) Projections by Products, 2022-2032

Figure 117: Asia Pacific Inner Bulk Liners Market Attractiveness by End-Use Industries, 2022-2032

Figure 118: Asia Pacific Inner Bulk Liners Market Attractiveness by Physical State Of Products Being Stored, 2022-2032

Figure 119: Asia Pacific Inner Bulk Liners Market Attractiveness by Products, 2022-2032

Figure 120: Asia Pacific Inner Bulk Liners Market Attractiveness by Country, 2022-2032

Figure 121: MEA Inner Bulk Liners Market Value (US$ Mn) by End-Use Industries, 2022-2032

Figure 122: MEA Inner Bulk Liners Market Value (US$ Mn) by Physical State Of Products Being Stored, 2022-2032

Figure 123: MEA Inner Bulk Liners Market Value (US$ Mn) by Products, 2022-2032

Figure 124: MEA Inner Bulk Liners Market Value (US$ Mn) by Country, 2022-2032

Figure 125: MEA Inner Bulk Liners Market Value (US$ Mn) Analysis by Country, 2016-2032

Figure 126: MEA Inner Bulk Liners Market Volume (Units) Analysis by Country, 2016-2032

Figure 127: MEA Inner Bulk Liners Market Value Share (%) and BPS Analysis by Country, 2022-2032

Figure 128: MEA Inner Bulk Liners Market Y-o-Y Growth (%) Projections by Country, 2022-2032

Figure 129: MEA Inner Bulk Liners Market Value (US$ Mn) Analysis by End-Use Industries, 2016-2032

Figure 130: MEA Inner Bulk Liners Market Volume (Units) Analysis by End-Use Industries, 2016-2032

Figure 131: MEA Inner Bulk Liners Market Value Share (%) and BPS Analysis by End-Use Industries, 2022-2032

Figure 132: MEA Inner Bulk Liners Market Y-o-Y Growth (%) Projections by End-Use Industries, 2022-2032

Figure 133: MEA Inner Bulk Liners Market Value (US$ Mn) Analysis by Physical State Of Products Being Stored, 2016-2032

Figure 134: MEA Inner Bulk Liners Market Volume (Units) Analysis by Physical State Of Products Being Stored, 2016-2032

Figure 135: MEA Inner Bulk Liners Market Value Share (%) and BPS Analysis by Physical State Of Products Being Stored, 2022-2032

Figure 136: MEA Inner Bulk Liners Market Y-o-Y Growth (%) Projections by Physical State Of Products Being Stored, 2022-2032

Figure 137: MEA Inner Bulk Liners Market Value (US$ Mn) Analysis by Products, 2016-2032

Figure 138: MEA Inner Bulk Liners Market Volume (Units) Analysis by Products, 2016-2032

Figure 139: MEA Inner Bulk Liners Market Value Share (%) and BPS Analysis by Products, 2022-2032

Figure 140: MEA Inner Bulk Liners Market Y-o-Y Growth (%) Projections by Products, 2022-2032

Figure 141: MEA Inner Bulk Liners Market Attractiveness by End-Use Industries, 2022-2032

Figure 142: MEA Inner Bulk Liners Market Attractiveness by Physical State Of Products Being Stored, 2022-2032

Figure 143: MEA Inner Bulk Liners Market Attractiveness by Products, 2022-2032

Figure 144: MEA Inner Bulk Liners Market Attractiveness by Country, 2022-2032

Need specific information?

Request Customization

Explore Packaging Insights

View Reports

Recommendations

Packaging

Europe Bulk Bags Market

Published : March 2021

Packaging

IBC Liner Market

Published : November 2020

Packaging

Drum Liners Market

Published : February 2022

Packaging

Intermediate Bulk Container (IBC) Market

Published : August 2021

Google translate

Inner Bulk Liners Market