Innerspring Mattresses Market Outlook and Forecast 2025 to 2035

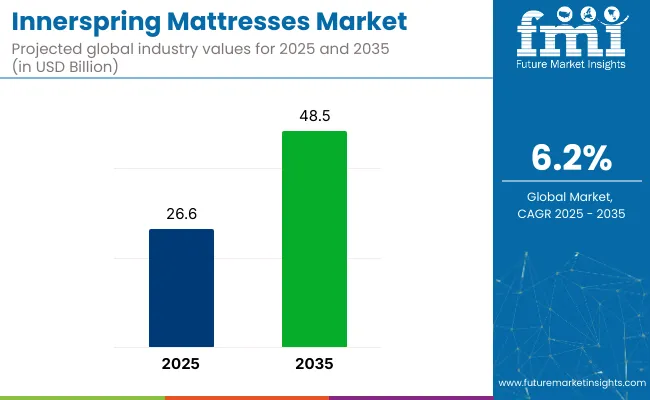
The global innerspring mattresses market is valued at USD 26.6 billion in 2025 and is slated to be worth USD 48.5 billion by 2035, reflecting a steady 6.2% CAGR. Rising demand for affordable, breathable, and durable bedding solutions has been fueling growth across both developed and emerging economies.

Increased focus on spinal alignment and sleep ergonomics, along with a preference for traditional mattress construction, has kept innerspring mattresses relevant despite rising competition from foam and latex variants. This is particularly evident in high-demand countries such as the USA, Germany, and South Korea.

Innovations in the market focus on improving comfort, durability, and sustainability. Advances in coil technology, such as pocketed coils and hybrid systems, are designed to provide better support and motion isolation. Additionally, new materials like memory foam and gel-infused layers are being integrated with traditional innerspring designs to enhance comfort and temperature regulation.

Eco-friendly initiatives are also on the rise, with manufacturers adopting sustainable materials like organic cotton, recycled steel, and plant-based foams. Enhanced durability and longer lifespan are achieved through improved coil systems, while increased customization options, such as adjustable firmness, are also gaining popularity.

Government regulations for the innerspring mattresses market focus on ensuring consumer safety, environmental sustainability, and product quality. In the USA, the Consumer Product Safety Commission (CPSC) sets fire safety standards, particularly for mattress flammability. The Federal Trade Commission (FTC) oversees labeling regulations to ensure accurate product claims. In Europe, the EU imposes strict regulations on the use of chemicals in bedding materials and promotes recycling initiatives.
Quick Stats of Innerspring Mattresses Market

  • Market Value (2025): USD 26.6 billion
  • Forecast Value (2035): USD 48.5 billion
  • Forecast CAGR: 6.2%
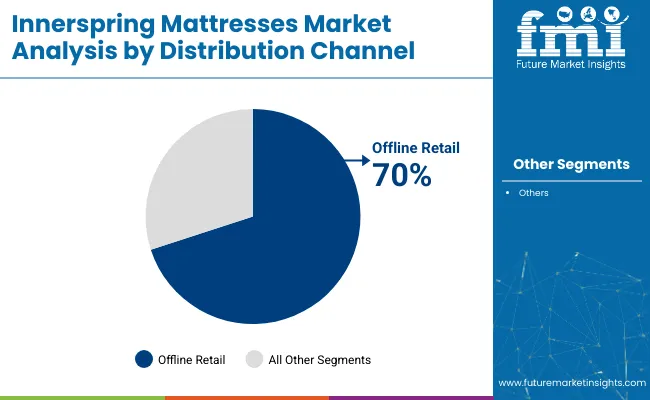
  • Distribution Channel Leader in 2025: Offline Retail (over 70% market share)
  • Top End User Segment: Household (approximately 85% market share)
  • Key Growth Region: East Asia (Japan is the fastest-growing market with 6.3% CAGR)

Innerspring Mattresses Market

Metric Value
Estimated Market Size (2025) USD 26.6 Billion
Projected Market Size (2035) USD 48.5 Billion
CAGR (2025 to 2035) 6.2%

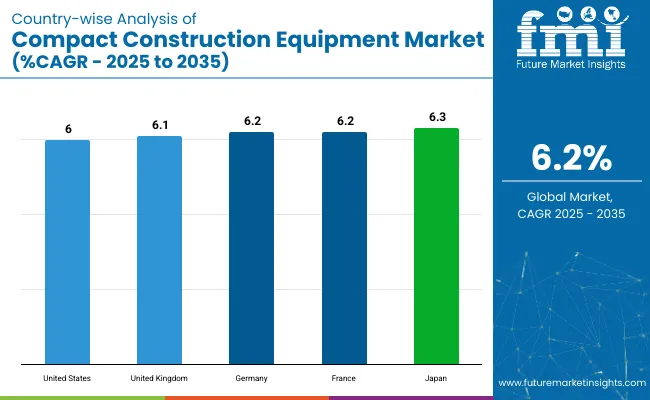
The USA is expected to be the fastest-growing market for innerspring mattresses, with a projected CAGR of 6%. Offline retail will lead the distribution channel segment, accounting for over 70% of the market share in 2025. The household segment will dominate the end-user category with an estimated 85% share. Japan and Germany are anticipated to experience steady growth, with CAGRs of 6.3% and 6.2%, respectively.

Analyzing Innerspring Mattresses Market by Top Investment Segments

The global innerspring mattresses market is segmented by distribution channel, end user, and region. By distribution channel, the market is bifurcated into offline retail and online retail. In terms of end user, the market is divided into household and commercial. Regionally, the market is classified into North America, Latin America, Western Europe, South Asia Pacific, East Asia, Eastern Europe, and Middle East & Africa.

Offline Retail to Lead the Distribution Channel Segment with 70% Market Share

Offline retail is projected to dominate the distribution channel segment, capturing 70% of the global market share in 2025. This dominance has been maintained due to the consumer preference for tactile evaluation and personalized purchase experiences when selecting mattresses.
  • Physical stores have enabled direct assessment of mattress comfort, firmness, and support.
  • Retailers have offered white-glove delivery, bundled pillows or toppers, and extended warranties.
  • High-involvement purchases such as mattresses have continued to favor in-store trust and guidance.
  • Brick-and-mortar locations have remained widespread across both mature and emerging markets.

Innerspring Mattresses Market Analysis By Distribution Channel

Household Segment to Lead the End User Category with 85% Market Share

The household segment is expected to command the largest share of the end-user category, holding approximately 85% of the total market in 2025. Strong consumer emphasis on sleep wellness and ergonomic benefits has sustained demand.

  • Innerspring mattresses have been widely preferred for home use due to affordability and breathability.
  • Growth in disposable incomes and real estate ownership has contributed to higher residential mattress purchases.
  • Home replacement cycles have shortened due to changing sleep preferences and rising comfort expectations.
  • Orthopedic support and motion isolation features have driven demand for multi-layer innerspring systems in homes.

Innerspring Mattresses Market Analysis By End User

Top Innerspring Mattresses Market Dynamics

The global innerspring mattresses market is witnessing steady growth, driven by rising demand for affordable, breathable, and supportive sleep solutions. Increased consumer focus on spinal alignment and hybrid innovations are boosting product appeal. However, the market faces headwinds from strong competition with foam and latex alternatives, fluctuating raw material prices, and slower digital adoption in developing regions.

Recent Trends in the Innerspring Mattresses Market

  • Surge in demand for hybrid models combining innerspring coils with memory foam or latex layers.
  • Rising adoption of eco-friendly materials like organic cotton and recycled steel coils.
  • Increasing consumer interest in smart mattresses with app-controlled firmness and sleep tracking.
  • Growth in demand from emerging markets due to urbanization and rising disposable incomes.

Key Challenges in the Innerspring Mattresses Market
  • Intense competition from memory foam, latex, and all-foam alternatives.
  • Volatile raw material prices, especially steel and synthetic fabrics.
  • Limited innovation in traditional innerspring designs compared to newer technologies.
  • Supply chain disruptions impacting timely manufacturing and delivery.

Analyzing Top Countries Producing and Supplying Innerspring Mattresses

Innerspring Mattresses Market Country Wise Analysis

USA Innerspring Mattresses Market Analysis

The USA innerspring mattresses market is projected to grow at a CAGR of 6% between 2025 and 2035. Strong demand from the residential renovation sector and hotel upgrades continues to drive volume. With consumers placing emphasis on durability and cost-efficiency, traditional innerspring models remain a preferred choice. The rise of hybrid models and sleep-tech integration is further fueling market expansion in both premium and budget categories.

  • Growing consumer preference for affordable, durable sleep solutions.
  • Steady investment from the hospitality and tourism industry.
  • High mattress replacement rates in residential households.

Innerspring Mattresses Sales Analysis in the UK

The UK innerspring mattresses market is expected to grow at a CAGR of 6.1% during the forecast period. Mass-market adoption of innerspring mattresses persists due to their low cost and reliability. Although memory foam models are gaining ground, consumers still value the comfort familiarity of coil-based mattresses. Regulatory support for recycling and sustainability in bedding products is shaping future market strategies.

  • Strong demand from households prioritizing low-cost mattress options.
  • Regulatory shift toward recycling and eco-certification.
  • Preference for traditional mattress types over emerging variants.

Germany Innerspring Mattresses Market Analysis

Germany’s innerspring mattresses market is forecast to register a CAGR of 6.2% between 2025 and 2035. A mature consumer base with strong quality expectations has favored hybrid innerspring models with orthopedic features. Continued investment in sustainable materials and certified eco-labels is influencing purchase decisions, particularly among urban and environmentally conscious buyers.

  • High consumer preference for orthopedic-grade hybrid mattresses.
  • Robust demand in both residential and hospitality sectors.
  • Increased adoption of eco-certified innerspring bedding.

Innerspring Mattresses Demand Analysis in France

The French innerspring mattresses market is anticipated to witness market growth at a CAGR of 6.2% through 2035. A mix of growing sleep health awareness and a flourishing hotel industry is driving demand. Innerspring mattresses are viewed as both durable and cost-effective, making them a staple in budget-conscious households and mid-tier hotel chains. The market is also benefiting from increased online availability and seasonal discounts.

  • Strong hospitality-driven purchases of innerspring models.
  • Rising interest in affordable, breathable sleep products.
  • Growth in online mattress sales and digital retail formats.

Japan Innerspring Mattresses Market Analysis

Japan’s innerspring mattresses market is set to grow at a CAGR of 6.3% from 2025 to 2035. Aging demographics and space-saving home preferences have encouraged the sale of compact innerspring mattresses. Local manufacturers are leveraging advanced coil technologies and breathable designs to appeal to health-conscious consumers. Integration of antimicrobial fabrics and hypoallergenic materials is a growing trend in product development.

  • Demand for space-efficient, supportive bedding in urban homes.
  • Rising preference for breathable and antimicrobial mattresses.
  • Surge in tech-integrated mattress innovation for elderly care.

Leading Innerspring Mattresses Supplier and Manufacturers

The innerspring mattresses market is moderately fragmented, with numerous global players both branded and private-label competing across diversified regions and segments. Leading firms are competing through pricing strategies, innovation in hybrid and smart mattress designs, strategic partnerships with retailers and sustainability-focused initiatives, and by expanding regional manufacturing footprints.

Top companies are emphasizing innovation (e.g., advanced coil configurations, smart sleep integration), value-based pricing for mass-market reach, and partnerships with hospitality chains and online platforms. Expansion strategies include opening DTC stores and entering emerging markets. Sustainability is also a growing focus, with eco-friendly materials and certifications becoming key differentiators.

Recent Innerspring Mattresses Industry News

  • In January 2025, Serta Simmons Bedding (SSB), LLC, a leading global sleep company, announced the launch of its new Beautyrest® and Beautyrest® World Class™ collections.

Innerspring Mattresses Market Report Scope

Report Attributes Details
Current Total Market Size (2025) USD 26.6 billion
Projected Market Size (2035) USD 48.5 billion
CAGR (2025 to 2035) 6.2%
Base Year for Estimation 2024
Historical Period 2020 to 2024
Projections Period 2025 to 2035
Market Analysis Parameters Revenue in USD billion/Volume in million units
By Distribution Channel Offline Retail and Online Retail
By End User Household and Commercial
Regions Covered North America, Latin America, Europe, Middle East and Africa, East Asia, South Asia Pacific
Countries Covered United States, Canada, United Kingdom, Germany, France, China, Japan, South Korea, Brazil, Australia
Key Players Hilding Anders AB, Recticel NV/SA, Silentnight Group Limited, Grupo Pikolin LLC, Simmons Bedding Company, Sealy e-Commerce LLC., Breckle GmbH, Magniflex, Kingsdown Inc., KING KOIL
Additional Attributes Dollar sales growth by product type, regional demand trends, competitive landscape, technological innovations.

Key Segmentation

By Distribution Channel:

  • Offline Retail
  • Online Retail

By End User:

  • Household
  • Commercial

Table of Content

  1. Executive Summary
    • Global Market Outlook
    • Demand-side Trends
    • Supply-side Trends
    • Technology Roadmap Analysis
    • Analysis and Recommendations
  2. Market Overview
    • Market Coverage / Taxonomy
    • Market Definition / Scope / Limitations
  3. Market Background
    • Market Dynamics
      • Drivers
      • Restraints
      • Opportunity
      • Trends
    • Scenario Forecast
      • Demand in Optimistic Scenario
      • Demand in Likely Scenario
      • Demand in Conservative Scenario
    • Opportunity Map Analysis
    • Product Life Cycle Analysis
    • Supply Chain Analysis
      • Supply Side Participants and their Roles
        • Producers
        • Mid-Level Participants (Traders/ Agents/ Brokers)
        • Wholesalers and Distributors
      • Value Added and Value Created at Node in the Supply Chain
      • List of Raw Material Suppliers
      • List of Existing and Potential Buyer’s
    • Investment Feasibility Matrix
    • Value Chain Analysis
      • Profit Margin Analysis
      • Wholesalers and Distributors
      • Retailers
    • PESTLE and Porter’s Analysis
    • Regulatory Landscape
      • By Key Regions
      • By Key Countries
    • Regional Parent Market Outlook
    • Production and Consumption Statistics
    • Import and Export Statistics
  4. Global Analysis 2020 to 2024 and Forecast, 2025 to 2035
    • Historical Market Size Value (USD Billion) & Volume (Million Units) Analysis, 2020 to 2024
    • Current and Future Market Size Value (USD Billion) & Volume (Million Units) Projections, 2025 to 2035
      • Y-o-Y Growth Trend Analysis
      • Absolute USD Opportunity Analysis
  5. Global Pricing Analysis 2020 to 2024 and Forecast 2025 to 2035
  6. Global Analysis 2020 to 2024 and Forecast 2025 to 2035, By Distribution Channel
    • Introduction / Key Findings
    • Historical Market Size Value (USD Billion) & Volume (Million Units) Analysis By Distribution Channel, 2020 to 2024
    • Current and Future Market Size Value (USD Billion) & Volume (Million Units) Analysis and Forecast By Distribution Channel, 2025 to 2035
      • Offline Retail
      • Online Retail
    • Y-o-Y Growth Trend Analysis By Distribution Channel, 2020 to 2024
    • Absolute USD Opportunity Analysis By Distribution Channel, 2025 to 2035
  7. Global Analysis 2020 to 2024 and Forecast 2025 to 2035, By End User
    • Introduction / Key Findings
    • Historical Market Size Value (USD Billion) & Volume (Million Units) Analysis By End User, 2020 to 2024
    • Current and Future Market Size Value (USD Billion) & Volume (Million Units) Analysis and Forecast By End User, 2025 to 2035
      • Household
      • Commercial
    • Y-o-Y Growth Trend Analysis By End User, 2020 to 2024
    • Absolute USD Opportunity Analysis By End User, 2025 to 2035
  8. Global Analysis 2020 to 2024 and Forecast 2025 to 2035, By Region
    • Introduction
    • Historical Market Size Value (USD Billion) & Volume (Million Units) Analysis By Region, 2020 to 2024
    • Current Market Size Value (USD Billion) & Volume (Million Units) Analysis and Forecast By Region, 2025 to 2035
      • North America
      • Latin America
      • Western Europe
      • Eastern Europe
      • East Asia
      • South Asia & Pacific
      • Middle East and Africa
    • Market Attractiveness Analysis By Region
  9. North America Analysis 2020 to 2024 and Forecast 2025 to 2035, By Country
    • Historical Market Size Value (USD Billion) & Volume (Million Units) Trend Analysis By Market Taxonomy, 2020 to 2024
    • Market Size Value (USD Billion) & Volume (Million Units) Forecast By Market Taxonomy, 2025 to 2035
      • By Country
        • USA
        • Canada
        • Mexico
      • By Distribution Channel
      • By End User
    • Market Attractiveness Analysis
      • By Country
      • By Distribution Channel
      • By End User
    • Key Takeaways
  10. Latin America Analysis 2020 to 2024 and Forecast 2025 to 2035, By Country
    • Historical Market Size Value (USD Billion) & Volume (Million Units) Trend Analysis By Market Taxonomy, 2020 to 2024
    • Market Size Value (USD Billion) & Volume (Million Units) Forecast By Market Taxonomy, 2025 to 2035
      • By Country
        • Brazil
        • Argentina
        • Rest of LATAM
      • By Distribution Channel
      • By End User
    • Market Attractiveness Analysis
      • By Country
      • By Distribution Channel
      • By End User
    • Key Takeaways
  11. Western Europe Analysis 2020 to 2024 and Forecast 2025 to 2035, By Country
    • Historical Market Size Value (USD Billion) & Volume (Million Units) Trend Analysis By Market Taxonomy, 2020 to 2024
    • Market Size Value (USD Billion) & Volume (Million Units) Forecast By Market Taxonomy, 2025 to 2035
      • By Country
        • Germany
        • Italy
        • France
        • UK
        • Spain
        • BENELUX
        • Nordic
        • Rest of W.Europe
      • By Distribution Channel
      • By End User
    • Market Attractiveness Analysis
      • By Country
      • By Distribution Channel
      • By End User
    • Key Takeaways
  12. Eastern Europe Analysis 2020 to 2024 and Forecast 2025 to 2035, By Country
    • Historical Market Size Value (USD Billion) & Volume (Million Units) Trend Analysis By Market Taxonomy, 2020 to 2024
    • Market Size Value (USD Billion) & Volume (Million Units) Forecast By Market Taxonomy, 2025 to 2035
      • By Country
        • Russia
        • Hungary
        • Poland
        • Balkan & Baltics
        • Rest of E. Europe
      • By Distribution Channel
      • By End User
    • Market Attractiveness Analysis
      • By Country
      • By Distribution Channel
      • By End User
    • Key Takeaways
  13. East Asia Analysis 2020 to 2024 and Forecast 2025 to 2035, By Country
    • Historical Market Size Value (USD Billion) & Volume (Million Units) Trend Analysis By Market Taxonomy, 2020 to 2024
    • Market Size Value (USD Billion) & Volume (Million Units) Forecast By Market Taxonomy, 2025 to 2035
      • By Country
        • China
        • Japan
        • South Korea
      • By Distribution Channel
      • By End User
    • Market Attractiveness Analysis
      • By Country
      • By Distribution Channel
      • By End User
    • Key Takeaways
  14. South Asia & Pacific Analysis 2020 to 2024 and Forecast 2025 to 2035, By Country
    • Historical Market Size Value (USD Billion) & Volume (Million Units) Trend Analysis By Market Taxonomy, 2020 to 2024
    • Market Size Value (USD Billion) & Volume (Million Units) Forecast By Market Taxonomy, 2025 to 2035
      • By Country
        • India
        • Australia & New Zealand
        • ASEAN
        • Rest of SAP
      • By Distribution Channel
      • By End User
    • Market Attractiveness Analysis
      • By Country
      • By Distribution Channel
      • By End User
    • Key Takeaways
  15. Middle East and Africa Analysis 2020 to 2024 and Forecast 2025 to 2035, By Country
    • Historical Market Size Value (USD Billion) & Volume (Million Units) Trend Analysis By Market Taxonomy, 2020 to 2024
    • Market Size Value (USD Billion) & Volume (Million Units) Forecast By Market Taxonomy, 2025 to 2035
      • By Country
        • GCC Countries
        • Northern Africa
        • South Africa
        • Turkiye
        • Rest of MEA
      • By Distribution Channel
      • By End User
    • Market Attractiveness Analysis
      • By Country
      • By Distribution Channel
      • By End User
    • Key Takeaways
  16. Key Countries Analysis
    • USA
      • Pricing Analysis
      • Market Share Analysis, 2024
        • By Distribution Channel
        • By End User
    • Canada
      • Pricing Analysis
      • Market Share Analysis, 2024
        • By Distribution Channel
        • By End User
    • Brazil
      • Pricing Analysis
      • Market Share Analysis, 2024
        • By Distribution Channel
        • By End User
    • Mexico
      • Pricing Analysis
      • Market Share Analysis, 2024
        • By Distribution Channel
        • By End User
    • Argentina
      • Pricing Analysis
      • Market Share Analysis, 2024
        • By Distribution Channel
        • By End User
  17. Market Structure Analysis
    • Competition Dashboard
    • Competition Benchmarking
    • Market Share Analysis of Top Players
      • By Regional
      • By Distribution Channel
      • By End User
  18. Competition Analysis
    • Competition Deep Dive
      • Hilding Anders AB
        • Overview
        • Product Portfolio
        • Profitability by Market Segments (Product/Age /Sales Channel/Region)
        • Sales Footprint
        • Strategy Overview
          • Marketing Strategy
          • Product Strategy
          • Channel Strategy
      • Recticel NV/SA
        • Overview
        • Product Portfolio
        • Profitability by Market Segments (Product/Age /Sales Channel/Region)
        • Sales Footprint
        • Strategy Overview
          • Marketing Strategy
          • Product Strategy
          • Channel Strategy
      • Silentnight Group Limited
        • Overview
        • Product Portfolio
        • Profitability by Market Segments (Product/Age /Sales Channel/Region)
        • Sales Footprint
        • Strategy Overview
          • Marketing Strategy
          • Product Strategy
          • Channel Strategy
      • Grupo Pikolin LLC
        • Overview
        • Product Portfolio
        • Profitability by Market Segments (Product/Age /Sales Channel/Region)
        • Sales Footprint
        • Strategy Overview
          • Marketing Strategy
          • Product Strategy
          • Channel Strategy
      • Simmons Bedding Company
        • Overview
        • Product Portfolio
        • Profitability by Market Segments (Product/Age /Sales Channel/Region)
        • Sales Footprint
        • Strategy Overview
          • Marketing Strategy
          • Product Strategy
          • Channel Strategy
      • Sealy e-Commerce LLC.
        • Overview
        • Product Portfolio
        • Profitability by Market Segments (Product/Age /Sales Channel/Region)
        • Sales Footprint
        • Strategy Overview
          • Marketing Strategy
          • Product Strategy
          • Channel Strategy
      • Breckle GmbH
        • Overview
        • Product Portfolio
        • Profitability by Market Segments (Product/Age /Sales Channel/Region)
        • Sales Footprint
        • Strategy Overview
          • Marketing Strategy
          • Product Strategy
          • Channel Strategy
      • Magniflex
        • Overview
        • Product Portfolio
        • Profitability by Market Segments (Product/Age /Sales Channel/Region)
        • Sales Footprint
        • Strategy Overview
          • Marketing Strategy
          • Product Strategy
          • Channel Strategy
      • Kingsdown Inc.
        • Overview
        • Product Portfolio
        • Profitability by Market Segments (Product/Age /Sales Channel/Region)
        • Sales Footprint
        • Strategy Overview
          • Marketing Strategy
          • Product Strategy
          • Channel Strategy
      • KING KOIL
        • Overview
        • Product Portfolio
        • Profitability by Market Segments (Product/Age /Sales Channel/Region)
        • Sales Footprint
        • Strategy Overview
          • Marketing Strategy
          • Product Strategy
          • Channel Strategy
  19. Assumptions & Acronyms Used
  20. Research Methodology

List of Tables

  • Table 1: Global Value (USD Billion) Forecast by Region, 2020-2035
  • Table 2: Global Volume (Million Units) Forecast by Region, 2020-2035
  • Table 3: Global Value (USD Billion) Forecast by Distribution Channel, 2020-2035
  • Table 4: Global Volume (Million Units) Forecast by Distribution Channel, 2020-2035
  • Table 5: Global Value (USD Billion) Forecast by End User, 2020-2035
  • Table 6: Global Volume (Million Units) Forecast by End User, 2020-2035
  • Table 7: North America Value (USD Billion) Forecast by Country, 2020-2035
  • Table 8: North America Volume (Million Units) Forecast by Country, 2020-2035
  • Table 9: North America Value (USD Billion) Forecast by Distribution Channel, 2020-2035
  • Table 10: North America Volume (Million Units) Forecast by Distribution Channel, 2020-2035
  • Table 11: North America Value (USD Billion) Forecast by End User, 2020-2035
  • Table 12: North America Volume (Million Units) Forecast by End User, 2020-2035
  • Table 13: Latin America Value (USD Billion) Forecast by Country, 2020-2035
  • Table 14: Latin America Volume (Million Units) Forecast by Country, 2020-2035
  • Table 15: Latin America Value (USD Billion) Forecast by Distribution Channel, 2020-2035
  • Table 16: Latin America Volume (Million Units) Forecast by Distribution Channel, 2020-2035
  • Table 17: Latin America Value (USD Billion) Forecast by End User, 2020-2035
  • Table 18: Latin America Volume (Million Units) Forecast by End User, 2020-2035
  • Table 19: Western Europe Value (USD Billion) Forecast by Country, 2020-2035
  • Table 20: Western Europe Volume (Million Units) Forecast by Country, 2020-2035
  • Table 21: Western Europe Value (USD Billion) Forecast by Distribution Channel, 2020-2035
  • Table 22: Western Europe Volume (Million Units) Forecast by Distribution Channel, 2020-2035
  • Table 23: Western Europe Value (USD Billion) Forecast by End User, 2020-2035
  • Table 24: Western Europe Volume (Million Units) Forecast by End User, 2020-2035
  • Table 25: Eastern Europe Value (USD Billion) Forecast by Country, 2020-2035
  • Table 26: Eastern Europe Volume (Million Units) Forecast by Country, 2020-2035
  • Table 27: Eastern Europe Value (USD Billion) Forecast by Distribution Channel, 2020-2035
  • Table 28: Eastern Europe Volume (Million Units) Forecast by Distribution Channel, 2020-2035
  • Table 29: Eastern Europe Value (USD Billion) Forecast by End User, 2020-2035
  • Table 30: Eastern Europe Volume (Million Units) Forecast by End User, 2020-2035
  • Table 31: East Asia Value (USD Billion) Forecast by Country, 2020-2035
  • Table 32: East Asia Volume (Million Units) Forecast by Country, 2020-2035
  • Table 33: East Asia Value (USD Billion) Forecast by Distribution Channel, 2020-2035
  • Table 34: East Asia Volume (Million Units) Forecast by Distribution Channel, 2020-2035
  • Table 35: East Asia Value (USD Billion) Forecast by End User, 2020-2035
  • Table 36: East Asia Volume (Million Units) Forecast by End User, 2020-2035
  • Table 37: South Asia & Pacific Value (USD Billion) Forecast by Country, 2020-2035
  • Table 38: South Asia & Pacific Volume (Million Units) Forecast by Country, 2020-2035
  • Table 39: South Asia & Pacific Value (USD Billion) Forecast by Distribution Channel, 2020-2035
  • Table 40: South Asia & Pacific Volume (Million Units) Forecast by Distribution Channel, 2020-2035
  • Table 41: South Asia & Pacific Value (USD Billion) Forecast by End User, 2020-2035
  • Table 42: South Asia & Pacific Volume (Million Units) Forecast by End User, 2020-2035
  • Table 43: Middle East and Africa Value (USD Billion) Forecast by Country, 2020-2035
  • Table 44: Middle East and Africa Volume (Million Units) Forecast by Country, 2020-2035
  • Table 45: Middle East and Africa Value (USD Billion) Forecast by Distribution Channel, 2020-2035
  • Table 46: Middle East and Africa Volume (Million Units) Forecast by Distribution Channel, 2020-2035
  • Table 47: Middle East and Africa Value (USD Billion) Forecast by End User, 2020-2035
  • Table 48: Middle East and Africa Volume (Million Units) Forecast by End User, 2020-2035

List of Figures

  • Figure 1: Global Volume (Million Units) Forecast 2020-2035
  • Figure 2: Global Pricing Analysis
  • Figure 3: Global Value (USD Billion) Forecast 2020-2035
  • Figure 4: Global Value Share and BPS Analysis by Distribution Channel, 2025 and 2035
  • Figure 5: Global Y-o-Y Growth Comparison by Distribution Channel, 2025-2035
  • Figure 6: Global Attractiveness Analysis by Distribution Channel
  • Figure 7: Global Value Share and BPS Analysis by End User, 2025 and 2035
  • Figure 8: Global Y-o-Y Growth Comparison by End User, 2025-2035
  • Figure 9: Global Attractiveness Analysis by End User
  • Figure 10: Global Value (USD Billion) Share and BPS Analysis by Region, 2025 and 2035
  • Figure 11: Global Y-o-Y Growth Comparison by Region, 2025-2035
  • Figure 12: Global Attractiveness Analysis by Region
  • Figure 13: North America Incremental USD Opportunity, 2025-2035
  • Figure 14: Latin America Incremental USD Opportunity, 2025-2035
  • Figure 15: Western Europe Incremental USD Opportunity, 2025-2035
  • Figure 16: Eastern Europe Incremental USD Opportunity, 2025-2035
  • Figure 17: East Asia Incremental USD Opportunity, 2025-2035
  • Figure 18: South Asia & Pacific Incremental USD Opportunity, 2025-2035
  • Figure 19: Middle East and Africa Incremental USD Opportunity, 2025-2035
  • Figure 20: North America Value Share and BPS Analysis by Country, 2025 and 2035
  • Figure 21: North America Value Share and BPS Analysis by Distribution Channel, 2025 and 2035
  • Figure 22: North America Y-o-Y Growth Comparison by Distribution Channel, 2025-2035
  • Figure 23: North America Attractiveness Analysis by Distribution Channel
  • Figure 24: North America Value Share and BPS Analysis by End User, 2025 and 2035
  • Figure 25: North America Y-o-Y Growth Comparison by End User, 2025-2035
  • Figure 26: North America Attractiveness Analysis by End User
  • Figure 27: Latin America Value Share and BPS Analysis by Country, 2025 and 2035
  • Figure 28: Latin America Value Share and BPS Analysis by Distribution Channel, 2025 and 2035
  • Figure 29: Latin America Y-o-Y Growth Comparison by Distribution Channel, 2025-2035
  • Figure 30: Latin America Attractiveness Analysis by Distribution Channel
  • Figure 31: Latin America Value Share and BPS Analysis by End User, 2025 and 2035
  • Figure 32: Latin America Y-o-Y Growth Comparison by End User, 2025-2035
  • Figure 33: Latin America Attractiveness Analysis by End User
  • Figure 34: Western Europe Value Share and BPS Analysis by Country, 2025 and 2035
  • Figure 35: Western Europe Value Share and BPS Analysis by Distribution Channel, 2025 and 2035
  • Figure 36: Western Europe Y-o-Y Growth Comparison by Distribution Channel, 2025-2035
  • Figure 37: Western Europe Attractiveness Analysis by Distribution Channel
  • Figure 38: Western Europe Value Share and BPS Analysis by End User, 2025 and 2035
  • Figure 39: Western Europe Y-o-Y Growth Comparison by End User, 2025-2035
  • Figure 40: Western Europe Attractiveness Analysis by End User
  • Figure 41: Eastern Europe Value Share and BPS Analysis by Country, 2025 and 2035
  • Figure 42: Eastern Europe Value Share and BPS Analysis by Distribution Channel, 2025 and 2035
  • Figure 43: Eastern Europe Y-o-Y Growth Comparison by Distribution Channel, 2025-2035
  • Figure 44: Eastern Europe Attractiveness Analysis by Distribution Channel
  • Figure 45: Eastern Europe Value Share and BPS Analysis by End User, 2025 and 2035
  • Figure 46: Eastern Europe Y-o-Y Growth Comparison by End User, 2025-2035
  • Figure 47: Eastern Europe Attractiveness Analysis by End User
  • Figure 48: East Asia Value Share and BPS Analysis by Country, 2025 and 2035
  • Figure 49: East Asia Value Share and BPS Analysis by Distribution Channel, 2025 and 2035
  • Figure 50: East Asia Y-o-Y Growth Comparison by Distribution Channel, 2025-2035
  • Figure 51: East Asia Attractiveness Analysis by Distribution Channel
  • Figure 52: East Asia Value Share and BPS Analysis by End User, 2025 and 2035
  • Figure 53: East Asia Y-o-Y Growth Comparison by End User, 2025-2035
  • Figure 54: East Asia Attractiveness Analysis by End User
  • Figure 55: South Asia & Pacific Value Share and BPS Analysis by Country, 2025 and 2035
  • Figure 56: South Asia & Pacific Value Share and BPS Analysis by Distribution Channel, 2025 and 2035
  • Figure 57: South Asia & Pacific Y-o-Y Growth Comparison by Distribution Channel, 2025-2035
  • Figure 58: South Asia & Pacific Attractiveness Analysis by Distribution Channel
  • Figure 59: South Asia & Pacific Value Share and BPS Analysis by End User, 2025 and 2035
  • Figure 60: South Asia & Pacific Y-o-Y Growth Comparison by End User, 2025-2035
  • Figure 61: South Asia & Pacific Attractiveness Analysis by End User
  • Figure 62: Middle East and Africa Value Share and BPS Analysis by Country, 2025 and 2035
  • Figure 63: Middle East and Africa Value Share and BPS Analysis by Distribution Channel, 2025 and 2035
  • Figure 64: Middle East and Africa Y-o-Y Growth Comparison by Distribution Channel, 2025-2035
  • Figure 65: Middle East and Africa Attractiveness Analysis by Distribution Channel
  • Figure 66: Middle East and Africa Value Share and BPS Analysis by End User, 2025 and 2035
  • Figure 67: Middle East and Africa Y-o-Y Growth Comparison by End User, 2025-2035
  • Figure 68: Middle East and Africa Attractiveness Analysis by End User
  • Figure 69: Global - Tier Structure Analysis
  • Figure 70: Global - Company Share Analysis

Frequently Asked Questions

What is the projected size of the innerspring mattresses market in 2025?

The market is valued at USD 26.6 billion in 2025.

What is the outlook on innerspring mattresses demand by 2035?

The market is forecasted to reach USD 48.5 billion by 2035, reflecting a CAGR of 6.2%.

Which segment leads the innerspring mattresses market by distribution channel in 2025?

Offline retail will lead the market by distribution channel with a 70% market share in 2025.

What is the top end-user segment for the innerspring mattresses market in 2025?

The household segment will dominate the market with an 85% share in 2025.

Which country is projected to have the fastest-growing innerspring mattresses market?

Japan is projected to grow at the fastest rate, with a CAGR of 6.3% from 2025 to 2035.

Explore Fast-Moving Consumer Goods (FMCG) Insights

Future Market Insights

Innerspring Mattresses Market