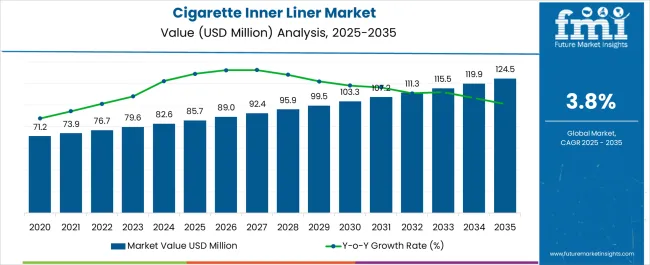
The Cigarette Inner Liner Market is estimated to be valued at USD 85.7 million in 2025 and is projected to reach USD 124.5 million by 2035, registering a compound annual growth rate (CAGR) of 3.8% over the forecast period.
| Metric | Value |
|---|---|
| Cigarette Inner Liner Market Estimated Value in (2025 E) | USD 85.7 million |
| Cigarette Inner Liner Market Forecast Value in (2035 F) | USD 124.5 million |
| Forecast CAGR (2025 to 2035) | 3.8% |
The cigarette inner liner market is experiencing steady expansion. Growth is being driven by sustained demand from the tobacco industry, evolving consumer preferences, and emphasis on product preservation and visual appeal. Current dynamics are shaped by the use of inner liners to maintain product freshness, provide barrier protection, and enhance packaging aesthetics.
Regulatory frameworks addressing material usage and sustainability are influencing manufacturing strategies, with producers focusing on recyclable and cost-efficient solutions. Rising adoption of premium cigarette packaging is reinforcing the need for durable and visually appealing inner liners. The future outlook remains positive, supported by technological improvements in material composition, customization capabilities, and large-scale production efficiencies.
Demand resilience is expected to continue in both developed and emerging markets Growth rationale is based on the continued integration of inner liners as a functional and branding element, the ability of manufacturers to adapt to regulatory and environmental requirements, and investments in capacity expansion to meet global demand, ensuring consistent revenue growth.
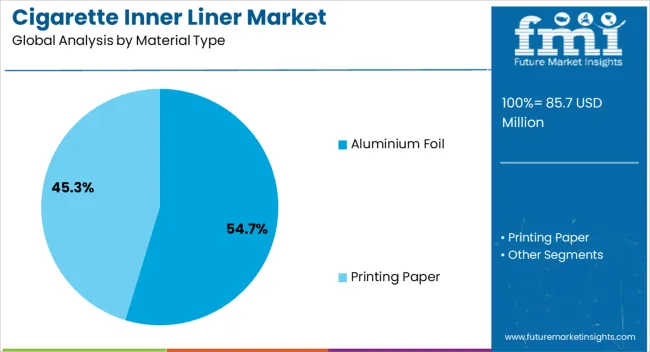
The aluminium foil segment, holding 54.70% of the material type category, has emerged as the leading choice due to its superior barrier properties, durability, and compatibility with high-speed packaging lines. Market adoption has been strengthened by aluminium’s ability to preserve product freshness and protect against external elements such as moisture, light, and air.
The segment’s dominance has been reinforced by its strong contribution to product appeal through metallic finishes that enhance premium positioning. Supply chain integration and established sourcing practices have ensured availability at scale.
Sustainability challenges have been partially addressed through advancements in recyclability and lightweight foil production Continued demand for premium cigarettes is expected to sustain aluminium foil’s leadership in the material type category, supported by ongoing innovations in design and manufacturing.
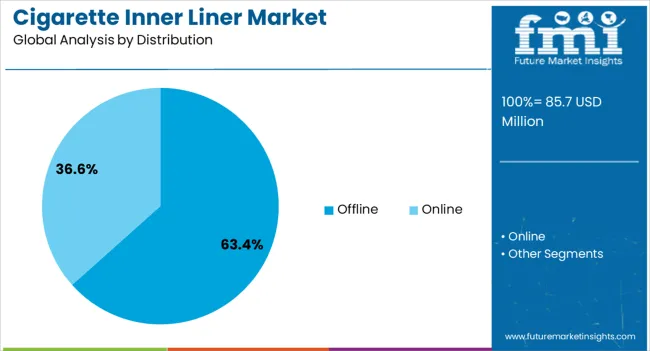
The offline distribution channel, accounting for 63.40% of the distribution category, has maintained its leadership due to entrenched retail networks, consumer buying habits, and strong visibility at point of sale. The channel’s dominance is reinforced by the prevalence of convenience stores, specialty tobacco shops, and large-scale retail outlets.
Consumer preference for physical purchase has supported consistent demand despite the gradual rise of online platforms. Supply chain reliability and established wholesale distribution networks have further secured this segment’s position.
Offline sales are also strengthened by regulatory restrictions on online tobacco trade in several regions Continued market share is expected to be supported by retail expansion in emerging economies and enhanced in-store branding initiatives that reinforce consumer engagement and product placement.
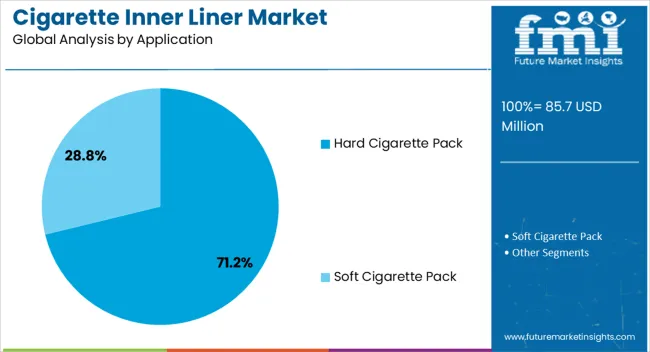
The hard cigarette pack segment, representing 71.20% of the application category, has established its dominance through its durability, premium appearance, and ability to maintain product integrity during handling and storage. Adoption has been reinforced by strong consumer preference for hard packs, which offer a perception of higher quality and convenience.
Manufacturers have prioritized inner liner compatibility with hard packs to maximize protection and enhance the unboxing experience. The segment’s sustained market share is being driven by widespread use in both mass-market and premium cigarette categories.
Regulatory compliance, packaging standardization, and consistent supply have further supported adoption Growth is expected to be reinforced by design innovations, premium branding initiatives, and continued consumer inclination toward durable packaging formats, ensuring the hard cigarette pack segment remains the cornerstone of application demand within the cigarette inner liner market.
Growing Health Concerns: The rising demand for soft cigarette packs is stimulating the adoption of cigarette inner liners to reduce health risks. Manufacturers are increasing the adoption of cigarette foil paper to reduce carbon footprints and limit health-related problems.
Government Regulations: Government-imposed strict rules, policies, and guidelines on tobacco products are surging the demand for cigarette inner liners. Manufacturers are enhancing labeling packaging solutions to maintain these regulations to control environmental impacts.
Anti-smoking Campaigns: Several initiatives and campaigns to reduce smoking are surging the demand for cigarette inner liners. These campaigns are gaining awareness to encourage people to quit smoking.
Emerging Market: Growing population, urbanization, production, and rising disposable incomes are propelling the demand for cigarette inner liners. The tobacco companies are operating new methods to expand the global market, surging the sales of inner liners.
Technological Advancements: Key companies are innovating advanced material packaging to serve cost efficiency and sustainability goals, driving the global market.
Consumer Preferences: Increasing demand for cigarettes such as soft cigarette packs and low-tar cigarettes fuels the consumer preference for cigarette inner liners.
Reduce Smoking Rates: The growing health concerns are limiting the global market growth. The increasing trend of leading a healthy lifestyle is resulting in the decline in demand for cigarette inner liners.
Competition: The increasing demand for alternative options such as electronic cigarettes and smokeless tobacco is also restricting the global market growth. These alternatives do not require inner liner packaging solutions.
Counterfeit and Illicit Trade: Key players face challenges in the tobacco trade due to counterfeit products. This majorly affects the demand for cigarette inner liners.
Environmental Concerns: Increasing consumer awareness of ecological issues promotes sustainable packaging solutions. The rising adoption of hazardous materials for packaging solutions restricts the global market.
Decline Social Acceptance: Smoking is prohibited in several public places; restaurants and hotels may experience reduced demand for cigarette inner liners.
High Costs: The rising prices and taxation on tobacco may decrease its adoption among consumers, reducing consumption of cigarette inner liners.
Packaging Waste Reduction: The Government is focused on implementing regulations on reducing packaging waste, which may limit the adoption of cigarette inner liners.
The global cigarette inner liner market grew steadily, with a valuation of USD 71.2 million in 2020 and USD 85.7 million in 2025. The global market secured a CAGR of 2.80% from 2020 to 2025. Increasing demand for cigarette inner liners for effective packaging solutions in the tobacco sector is influencing the global market revenue. The growing production of tobacco products is bolstering the vast adoption of packaging materials.
| Historical Market Value (2020) | USD 71.2 million |
|---|---|
| Historical Market Value (2025) | USD 85.7 million |
| CAGR (2020 to 2025) | 2.80% |
Manufacturers are maintaining clean and eco-friendly solutions for packaging products, raising demand for cigarette inner liners. The rising urbanization, growing disposable income, and sustainability options are increasing the demand for cigarette inner liners.
| Countries | CAGR from 2025 to 2035 |
|---|---|
| United States | 3.0% |
| Germany | 2.40% |
| Japan | 5.10% |
| Australia | 4.0% |
| China | 6.0% |
| India | 6.60% |
| Germany | 2.60% |
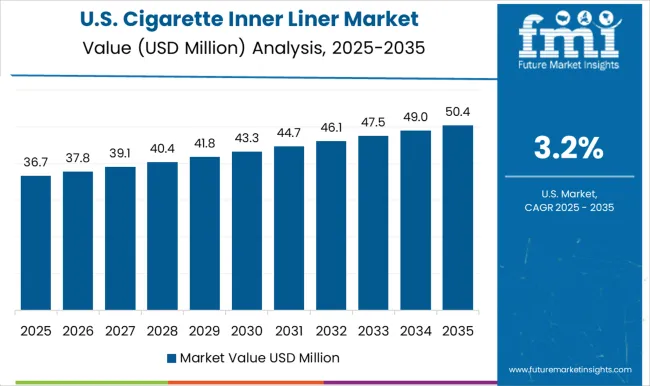
The United States market is estimated to capture a CAGR of 3.0% during the forecast period. The growing production of tobacco products, emerging markets, and rising trends in consumers' preferences are significantly boosting the United States cigarette inner liner market.
Rising essential players and government regulations are innovative, suitable, and advanced packaging solutions to reduce waste. The innovation of intelligent and graphic labels with advanced labeling technologies are raising the adoption of cigarette inner liner.
The rising demand for e-cigarettes due to growing health concerns is surging the adoption of cigarette inner liners in the country. Manufacturers are offering a wide range of products as per consumers' desires, increasing the demand for effective packaging solutions in the country. The growing trends of reducing tobacco product risk are influencing the increase in the adoption of unique packaging in the country.
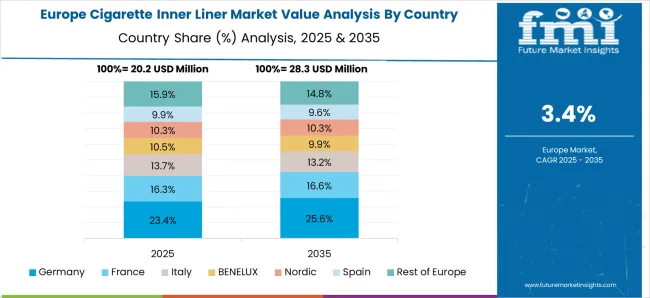
The market in Germany is projected to secure a CAGR of 2.40% during the forecast period. The rising wide range of tobacco products is stimulating the demand for cigarette inner liners in the country.
Growing stringent regulations and health concerns are developing suitable and standardized packaging solutions with innovative technologies to gain consumers' attention.
The government regulations imposed stringent rules on innovating better packaging material to reduce carbon footprints are uplifting the German cigarette inner liner market. Manufacturers in the country are heavily investing in developing innovative and high-quality packaging solutions to reduce hazards and toxicity and are raising the adoption of inner liners.
The market in China is anticipated to secure a CAGR of 6% during the forecast period. Increasing the demand for cigarette inner liner for luxury packaging solutions are gaining vast popularity in the country. China is producing and consuming an enormous quantity of tobacco products due to the growing population and consumer trends.
The increasing risk of several lung diseases is raising the demand for cigarette inner liners among end users for better packaging. The rising printing techniques and excellent materials are increasing the demand for cost-effective packaging in the country. The rising retail shops, online shopping, and manufacturing industries are propelling China's inner liner market.
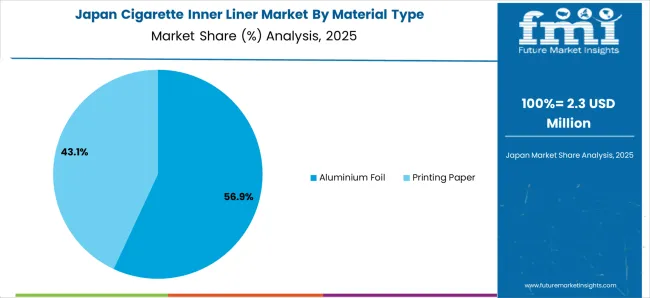
The market in Japan is anticipated to secure a CAGR of 5.10% during the forecast period. The rising smoking population, trends, and the tobacco sector is significantly increasing the adoption of cigarette inner liners in Japan. The growing advanced packaging requirements for healthy surroundings are driving Japan's cigarette inner liner market.
Increasing demand for strict regulations and graphic health are offering packaging requirements to fuel Japan's revenue. Japan is known for technology, innovation, and advanced products, which are developing enhanced packaging materials and increasing the demand for cigarette inner liners.
The market in India is expected to grow at a CAGR of 6.60% over the forecast period. Growing distinct cultures, packaging design, and rising chain smokers are increasing the adoption of cigarette inner liners. The rising demand for non-toxic packaging materials, low-tobacco products, and growing awareness are expanding India's cigarette inner liner market.
Consumers are increasing the adoption of affordable and cost-effective solutions, raising the demand for cigarette inner liners in the country. The growing trends among consumers for less harmful and low-tar cigarettes are increasing the adoption of inner liners in the country.
| Top Material Type | Aluminium Foil |
|---|---|
| Market Share | 75.10% |
Based on material type, aluminium foil leads the global market by securing a share of 75.10% in 2025. Increasing demand for sustainable and barrier properties is surging the adoption of aluminium foil. These foils preserve high-quality packaging solutions with heat resistance for tobacco products, which drive the global market.
Manufacturers are adopting aluminium foil during manufacturing processes to maintain product integrity and are gaining vast popularity in the global market. The rising printing technologies are ensuring safety with different branding designs, which are playing a crucial role in marketing.
The manufacturers promote recyclability to reduce wastage and enhance environmental protection, preferring sustainable choices and increasing the adoption of aluminium foil.
| Top Distribution Channel | Offline |
|---|---|
| Market Share in 2025 | 80% |
Based on the distribution channel, offline is likely to lead the global market by capturing a share of 80% during the forecast period. Increasing demand for cigarette inner liners is pivotal in ensuring safe packaging among retailers and wholesalers.
Consumers prefer face-to-face interaction among distributors, and manufacturers are increasingly adopting cigarette inner liners.
Key companies are expanding their sales through offline distribution channels to handle their inventory and are gaining vast quality products. Consumers find it easy to find out the quality of products through offline channels with transparency, which are gaining vast popularity in the global market.
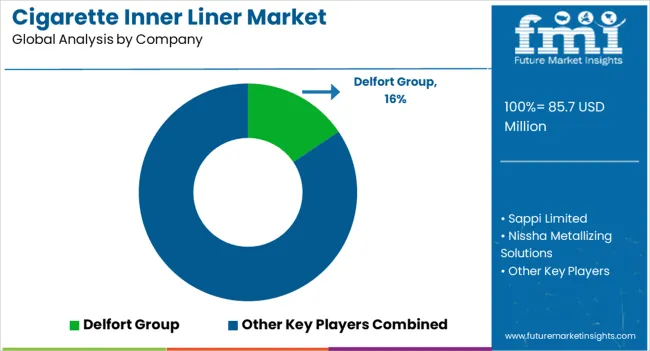
The global cigarette inner liner marketis highly consolidated by the essential players that develop high-quality and versatile products to attract consumers' requirements. They offer sustainable packaging solutions to gain consumers' trust and boost sales.
Key players are enhancing their brand reputation at various events, such as trade shows, exhibitions, and online platforms, to meet genuine audiences, driving market growth. These players heavily invest in research and development to upsurge the global market revenue.
Recent Developments in the Cigarette Inner Liner Market
The global cigarette inner liner market is estimated to be valued at USD 85.7 million in 2025.
The market size for the cigarette inner liner market is projected to reach USD 124.5 million by 2035.
The cigarette inner liner market is expected to grow at a 3.8% CAGR between 2025 and 2035.
The key product types in cigarette inner liner market are aluminium foil and printing paper.
In terms of distribution, offline segment to command 63.4% share in the cigarette inner liner market in 2025.


Full Research Suite comprises of:
Market outlook & trends analysis
Interviews & case studies
Strategic recommendations
Vendor profiles & capabilities analysis
5-year forecasts
8 regions and 60+ country-level data splits
Market segment data splits
12 months of continuous data updates
DELIVERED AS:
PDF EXCEL ONLINE
Cigarette Butt Market Size and Share Forecast Outlook 2025 to 2035
Cigarette Filters Market Size and Share Forecast Outlook 2025 to 2035
Cigarette Packaging Material Market Size and Share Forecast Outlook 2025 to 2035
Cigarette Making Equipment Market Size and Share Forecast Outlook 2025 to 2035
Cigarette Packaging Machine Market Size and Share Forecast Outlook 2025 to 2035
Market Share Breakdown of Cigarette Packaging Machine Manufacturers
Global Cigarette Paper Market Analysis – Growth & Forecast 2024-2034
Premium Cigarette Market Growth – Demand & Industry Outlook to 2035
Smokeless Cigarettes Market Trends – Growth & Outlook 2025 to 2035
Automotive Cigarette Lighters Market
Disposable E-Cigarettes Market Size and Share Forecast Outlook 2025 to 2035
Flavor Capsule Cigarette Market Analysis - Size, Share, and Forecast 2025 to 2035
Flavor Capsule Cigarettes Market
Demand For Flavor Capsule Cigarette Products in EU Size and Share Forecast Outlook 2025 to 2035
Innerspring Mattresses Market Analysis - Size, Share, and Forecast Outlook 2025 to 2035
Inner Bulk Liners Market Size and Share Forecast Outlook 2025 to 2035
Dinner Ready-to-Eat (RTE) Food Market - Trends & Consumer Insights 2025 to 2035
Spinner Flask Market Size and Share Forecast Outlook 2025 to 2035
Takeout Dinner Market Trends - Convenience & Gourmet Expansion 2025 to 2035
Maternity Innerwear Market Analysis by Growth, Trends and Forecast from 2025 to 2035

Thank you!
You will receive an email from our Business Development Manager. Please be sure to check your SPAM/JUNK folder too.
Chat With
MaRIA