The aluminum foil packaging market is projected to grow from USD 28.5 billion in 2025 to USD 48.7 billion by 2035, registering a CAGR of 5.5%. Growth is closely linked to increasing demand for high-performance barrier packaging solutions in food, pharmaceutical, and consumer goods sectors. The food & beverage industry continues to represent the largest end-use segment at 64% in 2025, driven by rising consumer preference for convenient and fresh food packaging formats. Rigid aluminum foil containers account for 58% of the market, primarily due to their exceptional heat conductivity, strength, and versatility in food service applications, where temperature retention and packaging durability are critical.
Technological advancements in coating systems, barrier properties, and seal integrity are driving innovation in this sector, improving shelf life and enhancing consumer convenience. The increasing adoption of advanced coatings and easy-peel features is fueling demand for specialty aluminum foil products, which provide better moisture resistance, thermal properties, and tamper-evident features. Regionally, North America, Europe, and Asia Pacific lead growth, with China (6.8% CAGR) and Germany (5.6% CAGR) showing strong demand driven by expanding food processing industries, increasing adoption of ready-to-eat meals, and sophisticated food packaging technologies.
Technological advancements in aluminum foil production are also playing a crucial role in driving market growth. Innovations such as thinner foils, enhanced strength, and multi-layered foils are improving packaging efficiency and functionality. These advancements not only reduce material usage and costs but also enhance the protective properties of aluminum foil packaging. The development of high-performance coatings and finishes for aluminum foil is further expanding its applications in the packaging industry, particularly in products that require extended shelf life and high resistance to environmental factors.
The growing preference for convenience and ready-to-serve packaging formats is contributing to the increasing demand for aluminum foil packaging. With busy lifestyles and a preference for quick, on-the-go meals, consumers are increasingly turning to packaged food and beverage options. Aluminum foil packaging, which offers portability, easy-to-serve formats, and the ability to maintain product integrity, is well-positioned to meet this demand. Additionally, the rise in e-commerce and online grocery shopping is further driving the need for efficient, secure, and durable packaging solutions, boosting the adoption of aluminum foil packaging across various sectors.
The competitive landscape of the aluminum foil packaging market is another factor influencing market dynamics. As the demand for aluminum packaging increases, several players are competing to offer innovative and cost-effective solutions. Manufacturers are investing in new technologies, partnerships, and acquisitions to enhance their product offerings and expand their market reach. The ability to offer customizable, high-quality aluminum packaging that meets specific customer needs, such as barrier properties, sustainability, and design, will be crucial for companies looking to capture market share.
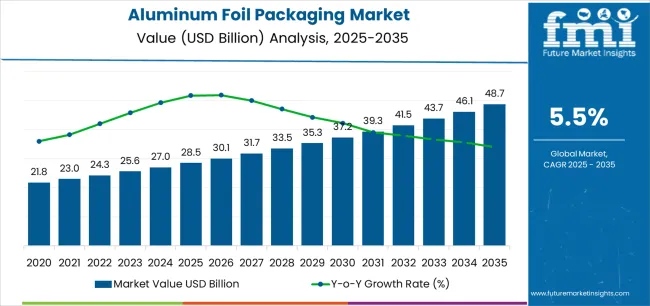
| Metric | Value |
|---|---|
| Estimated Value in (2025E) | USD 28.5 billion |
| Forecast Value in (2035F) | USD 48.7 billion |
| Forecast CAGR (2025 to 2035) | 5.5% |
Market expansion is being supported by the increasing global demand for food preservation packaging and the corresponding shift toward barrier materials that can provide superior protection characteristics while meeting brand requirements for cost efficiency and material-effective production processes. Modern food companies are increasingly focused on incorporating packaging formats that can enhance product freshness while satisfying demands for consistent, reliably performing containers and optimized content protection practices. Aluminum foil packaging's proven ability to deliver moisture resistance, light blocking properties, and diverse application possibilities makes it essential packaging for food processors and quality-conscious consumer goods manufacturers.
The growing emphasis on convenience food consumption and ready-meal preparation is driving demand for high-performance aluminum foil packaging systems that can support distinctive product requirements and comprehensive functionality across food service companies, pharmaceutical manufacturers, and specialty consumer categories. Consumer preference for packaging that combines practical convenience appeal with effective barrier protection is creating opportunities for innovative implementations in both traditional and emerging packaging applications. The rising influence of takeaway food culture and meal delivery service priorities is also contributing to increased adoption of aluminum foil packaging that can provide authentic heat retention benefits and reliable product safety characteristics.
The market is segmented by product type, thickness, application, end-use industry, and region. By product type, the market is divided into rigid aluminum foil containers, flexible aluminum foil packaging, aluminum foil lids, and specialty aluminum foil products. Based on thickness, the market is categorized into standard gauge, heavy duty, and extra heavy duty. By application, the market includes food packaging, pharmaceutical packaging, insulation, and industrial applications. By end-use industry, the market encompasses food & beverage, pharmaceutical & healthcare, personal care, and other industries. Regionally, the market is divided into North America, Europe, Asia Pacific, Latin America, Middle East & Africa, and other regions.
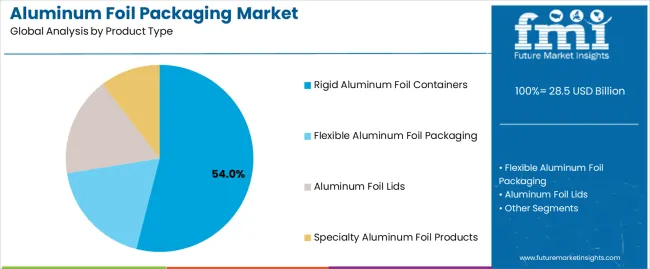
The rigid aluminum foil containers segment is projected to account for 54% of the aluminum foil packaging market in 2025, reaffirming its position as the leading product category. Food service operators and packaging facilities increasingly utilize rigid aluminum foil containers for their superior heat conductivity characteristics, established structural strength, and essential functionality in diverse food preparation applications across multiple commercial categories. Rigid aluminum foil containers' proven manufacturing reliability and established versatility directly address operator requirements for dependable food service packaging production and optimal protection value in commercial applications.
This product segment forms the foundation of modern food service packaging patterns, as it represents the format with the greatest commercial scalability potential and established compatibility across multiple heating and cooling operations. Operator investments in portion control standardization and operational efficiency continue to strengthen adoption among cost-conscious food providers. With users prioritizing food safety and temperature retention, rigid aluminum foil containers align with both quality objectives and performance requirements, making them the central component of comprehensive food service packaging strategies.
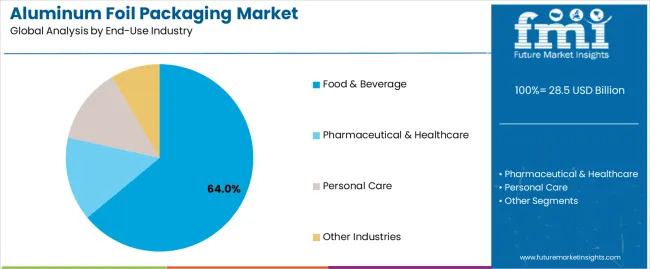
Food & beverage is projected to represent 64% of the aluminum foil packaging market in 2025, underscoring its critical role as the primary industry for quality-focused brands seeking superior freshness protection benefits and enhanced product preservation credentials. Food processors and beverage companies prefer aluminum foil packaging applications for their established moisture barrier patterns, proven shelf life extension, and ability to maintain exceptional product quality profiles while supporting versatile distribution offerings during diverse retail experiences. Positioned as essential packaging for discerning food providers, food & beverage offerings provide both market penetration excellence and product protection advantages.
The segment is supported by continuous improvement in sealing technology and the widespread availability of established barrier protection frameworks that enable freshness integrity and extended storage at the distribution level. Additionally, food companies are optimizing packaging designs to support brand differentiation and consumer convenience strategies. As food packaging technology continues to advance and consumers seek effective preservation formats, food & beverage applications will continue to drive market growth while supporting product quality and consumer satisfaction strategies.
The aluminum foil packaging market is advancing rapidly due to increasing food preservation consciousness and growing need for barrier packaging choices that emphasize superior moisture protection outcomes across food service segments and pharmaceutical applications. However, the market faces challenges, including competition from alternative flexible packaging materials, cost considerations for raw aluminum procurement, and processing complexity affecting production economics. Innovation in lightweight foil formulations and advanced coating systems continues to influence market development and expansion patterns.
The growing adoption of aluminum foil packaging in convenience food and ready-meal segments is enabling brands to develop packaging strategies that provide distinctive heat retention benefits while commanding practical positioning and enhanced consumer convenience characteristics. Food service applications provide superior temperature management while allowing more sophisticated distribution features across various product categories. Brands are increasingly recognizing the competitive advantages of aluminum foil packaging positioning for product freshness protection and quality-conscious consumer engagement.
Modern aluminum foil packaging manufacturers are incorporating advanced coating techniques, multi-layer lamination applications, and enhanced sealing systems to enhance barrier protection credentials, improve puncture resistance outcomes, and meet commercial demands for versatile packaging solutions. These systems improve shelf life effectiveness while enabling new applications, including retort processing compatibility and microwave-safe programs. Advanced coating integration also allows manufacturers to support food safety positioning and functional differentiation beyond traditional packaging operations.
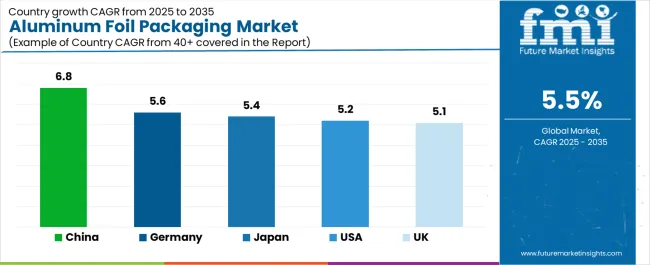
| Country | CAGR (2025-2035) |
|---|---|
| China | 6.8% |
| Germany | 5.6% |
| Japan | 5.4% |
| USA | 5.2% |
| UK | 5.1% |
The aluminum foil packaging market is experiencing robust growth globally, with China leading at a 6.8% CAGR through 2035, driven by the expanding food processing industry, growing middle-class consumption, and increasing adoption of convenient packaging formats. The USA follows at 5.2%, supported by rising ready-meal trends, expanding food delivery infrastructure, and growing acceptance of disposable food containers. Germany shows growth at 5.6%, emphasizing established manufacturing capabilities and comprehensive packaging development. The UK records 5.1%, focusing on food service packaging and convenience innovation expansion. Japan demonstrates 5.4% growth, prioritizing quality food packaging solutions and technological advancement.
The report covers an in-depth analysis of 40+ countries top-performing countries are highlighted below.
Revenue from aluminum foil packaging consumption and sales in the USA is projected to exhibit exceptional growth with a CAGR of 5.2% through 2035, driven by the country's rapidly expanding food service sector, favorable consumer attitudes toward convenient packaging solutions, and initiatives promoting ready-to-eat meal consumption across major metropolitan regions. The USA's position as a leading takeaway food market and increasing focus on meal delivery services are creating substantial demand for high-quality aluminum foil packaging in both commercial and retail markets. Major food processors and restaurant chains are establishing comprehensive packaging capabilities to serve growing demand and emerging market opportunities.
Revenue from aluminum foil packaging products in Germany is expanding at a CAGR of 5.6%, supported by rising food packaging sophistication, growing convenience food requirements, and expanding manufacturing infrastructure. The country's developing aluminum processing capabilities and increasing commercial investment in advanced packaging are driving demand for aluminum foil packaging across both imported and domestically produced applications. International packaging companies and domestic manufacturers are establishing comprehensive operational networks to address growing market demand for quality aluminum foil packaging and efficient food protection solutions.
Revenue from aluminum foil packaging products in the UK is projected to grow at a CAGR of 5.1% through 2035, supported by the country's mature food service market, established takeaway food culture, and leadership in packaging innovation standards. Britain's sophisticated distribution infrastructure and strong support for convenient food formats are creating steady demand for both traditional and innovative aluminum foil packaging varieties. Leading restaurant chains and specialty food providers are establishing comprehensive operational strategies to serve both domestic markets and growing export opportunities.
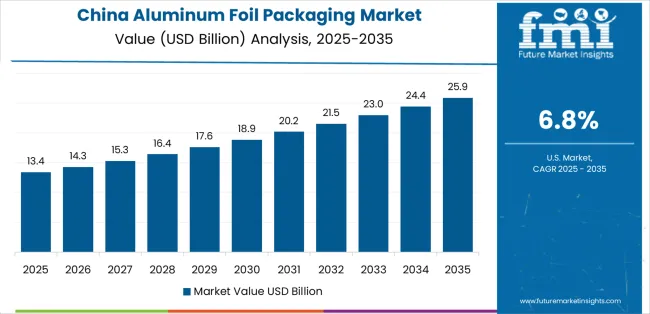
Revenue from aluminum foil packaging products in China is projected to grow at a CAGR of 6.8% through 2035, driven by the country's emphasis on food industry expansion, manufacturing leadership, and sophisticated production capabilities for packaging requiring specialized aluminum varieties. Chinese manufacturers and distributors consistently seek commercial-grade food packaging that enhances product protection and supports food operations for both traditional and innovative product applications. The country's position as an Asian manufacturing leader continues to drive innovation in specialty aluminum foil packaging applications and commercial production standards.
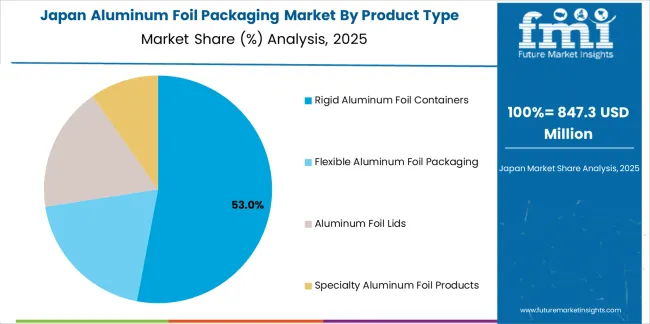
Revenue from aluminum foil packaging products in Japan is projected to grow at a CAGR of 5.4% through 2035, supported by the country's emphasis on quality manufacturing, food safety standards, and advanced technology integration requiring efficient packaging solutions. Japanese businesses and food brands prioritize material performance and manufacturing precision, making aluminum foil packaging essential solutions for both traditional and modern food service applications. The country's comprehensive quality excellence and advancing food packaging patterns support continued market expansion.
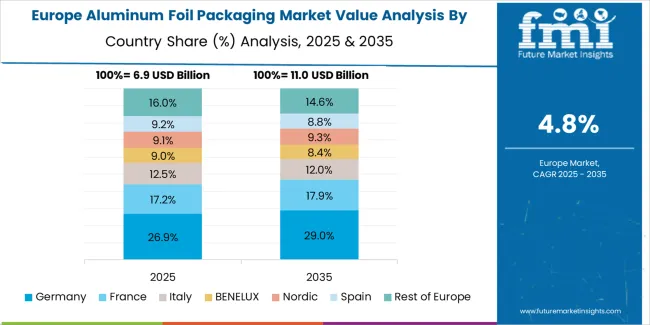
The Europe aluminum foil packaging market is projected to grow from USD 8.6 billion in 2025 to USD 15.1 billion by 2035, recording a CAGR of 5.8% over the forecast period. Germany leads the region with a 35.0% share in 2025, moderating slightly to 34.5% by 2035, supported by its strong aluminum manufacturing base and demand for technically advanced food packaging products. France follows with 22.0% in 2025, maintaining 22.5% by 2035, driven by its sophisticated food service industry and emphasis on convenient packaging standards. The United Kingdom accounts for 16.5% in 2025, easing to 16.0% by 2035, reflecting steady adoption of food service packaging solutions and operational efficiency optimization. Italy holds 14.0% in 2025, expanding to 14.5% by 2035 as food processing innovation and specialty container applications grow. Spain contributes 6.5% in 2025, growing to 7.0% by 2035, supported by expanding food manufacturing sector and convenience product handling. The Nordic countries rise from 4.0% in 2025 to 4.2% by 2035 on the back of strong food safety adoption and advanced material technologies. BENELUX remains at 2.0% share across both 2025 and 2035, reflecting mature, efficiency-focused markets.
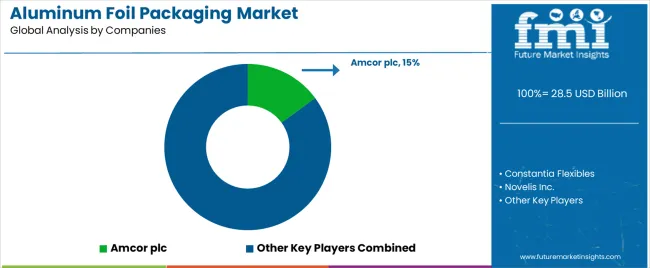
The aluminum foil packaging market features 10–15 players with moderate concentration, where the top three companies collectively hold around 50–55% of global market share, driven by their advanced production technologies, strong sustainability initiatives, and deep relationships with industries such as food and beverage, pharmaceuticals, and consumer goods. The leading company, Amcor plc, commands 15% of the market share, supported by its diverse portfolio of aluminum foil packaging solutions and global distribution network. Competition focuses on material strength, barrier properties, recyclability, and customization options rather than price competition alone.
Market leaders such as Amcor plc, Constantia Flexibles, and Novelis Inc. maintain their dominant positions by offering high-quality, lightweight, and versatile aluminum foil packaging solutions that meet the increasing demand for eco-friendly, sustainable packaging. These companies differentiate by providing specialized solutions for high-barrier packaging, including those for food preservation, pharmaceuticals, and personal care products.
Challenger companies like Hindalco Industries Limited, Hydro Aluminum, and Aleris Corporation focus on large-scale aluminum foil production and offering cost-effective packaging options that cater to industrial applications and regional markets.
Additional competitive pressure comes from regional players such as ACM Carcano S.p.A., Penny Plate LLC, Hulamin Limited, and Alibérico Packaging, which strengthen their market presence through specialized foil products, fast delivery, and flexible production capabilities for various packaging formats.
The success of aluminum foil packaging in meeting food protection demands, consumer-driven convenience requirements, and performance integration will not only enhance product preservation outcomes but also strengthen global food packaging manufacturing capabilities. It will consolidate emerging regions' positions as hubs for efficient packaging production and align advanced economies with commercial food service systems. This calls for a concerted effort by all stakeholders - governments, industry bodies, manufacturers, distributors, and investors. Each can be a crucial enabler in preparing the market for its next phase of growth.
| Items | Values |
|---|---|
| Quantitative Units (2025) | USD 28.5 billion |
| Product Type | Rigid Aluminum Foil Containers, Flexible Aluminum Foil Packaging, Aluminum Foil Lids, Specialty Aluminum Foil Products |
| Thickness | Standard Gauge, Heavy Duty, Extra Heavy Duty |
| Application | Food Packaging, Pharmaceutical Packaging, Insulation, Industrial Applications |
| End-Use Industry | Food & Beverage, Pharmaceutical & Healthcare, Personal Care, Other Industries |
| Regions Covered | North America, Europe, Asia Pacific, Latin America, Middle East & Africa, Other Regions |
| Countries Covered | United States, Germany, United Kingdom, China, Japan, and 40+ countries |
| Key Companies Profiled | Amcor plc, Constantia Flexibles, Novelis Inc., Hindalco Industries Limited, Hydro Aluminum, Aleris Corporation, ACM Carcano S.p.A., Penny Plate LLC, Hulamin Limited, Alibérico Packaging |
| Additional Attributes | Dollar sales by product type, thickness, application, end-use industry, and region; regional demand trends, competitive landscape, technological advancements in precision rolling engineering, lightweight foil formulation initiatives, coating technology enhancement programs, and premium product development strategies |
The global aluminum foil packaging market is estimated to be valued at USD 28.5 billion in 2025.
The market size for the aluminum foil packaging market is projected to reach USD 48.7 billion by 2035.
The aluminum foil packaging market is expected to grow at a 5.5% CAGR between 2025 and 2035.
The key product types in aluminum foil packaging market are rigid aluminum foil containers, flexible aluminum foil packaging, aluminum foil lids and specialty aluminum foil products.
In terms of end-use industry, food & beverage segment to command 64.0% share in the aluminum foil packaging market in 2025.


Our Research Products

The "Full Research Suite" delivers actionable market intel, deep dives on markets or technologies, so clients act faster, cut risk, and unlock growth.

The Leaderboard benchmarks and ranks top vendors, classifying them as Established Leaders, Leading Challengers, or Disruptors & Challengers.

Locates where complements amplify value and substitutes erode it, forecasting net impact by horizon

We deliver granular, decision-grade intel: market sizing, 5-year forecasts, pricing, adoption, usage, revenue, and operational KPIs—plus competitor tracking, regulation, and value chains—across 60 countries broadly.

Spot the shifts before they hit your P&L. We track inflection points, adoption curves, pricing moves, and ecosystem plays to show where demand is heading, why it is changing, and what to do next across high-growth markets and disruptive tech

Real-time reads of user behavior. We track shifting priorities, perceptions of today’s and next-gen services, and provider experience, then pace how fast tech moves from trial to adoption, blending buyer, consumer, and channel inputs with social signals (#WhySwitch, #UX).

Partner with our analyst team to build a custom report designed around your business priorities. From analysing market trends to assessing competitors or crafting bespoke datasets, we tailor insights to your needs.
Supplier Intelligence
Discovery & Profiling
Capacity & Footprint
Performance & Risk
Compliance & Governance
Commercial Readiness
Who Supplies Whom
Scorecards & Shortlists
Playbooks & Docs
Category Intelligence
Definition & Scope
Demand & Use Cases
Cost Drivers
Market Structure
Supply Chain Map
Trade & Policy
Operating Norms
Deliverables
Buyer Intelligence
Account Basics
Spend & Scope
Procurement Model
Vendor Requirements
Terms & Policies
Entry Strategy
Pain Points & Triggers
Outputs
Pricing Analysis
Benchmarks
Trends
Should-Cost
Indexation
Landed Cost
Commercial Terms
Deliverables
Brand Analysis
Positioning & Value Prop
Share & Presence
Customer Evidence
Go-to-Market
Digital & Reputation
Compliance & Trust
KPIs & Gaps
Outputs
Full Research Suite comprises of:
Market outlook & trends analysis
Interviews & case studies
Strategic recommendations
Vendor profiles & capabilities analysis
5-year forecasts
8 regions and 60+ country-level data splits
Market segment data splits
12 months of continuous data updates
DELIVERED AS:
PDF EXCEL ONLINE
Aluminum Foil Peel-Off Ends Maker Market Size and Share Forecast Outlook 2025 to 2035
Aluminum Foil Tape Market Size and Share Forecast Outlook 2025 to 2035
Aluminum Foil Containers Market Size and Share Forecast Outlook 2025 to 2035
Market Share Insights of Leading Aluminum Foil Providers
Aluminum Foil Lids Market from 2023 to 2033
Aluminum Foil Laminated Paper Market
Foil Pouch Packaging Market Size and Share Forecast Outlook 2025 to 2035
Recycled Aluminum Packaging Market Trends & Growth Forecast 2024-2034
Honeycomb Aluminum Foil Market Size and Share Forecast Outlook 2025 to 2035
Converter Aluminum Foil Market Size and Share Forecast Outlook 2025 to 2035
Market Share Insights of Converter Aluminum Foil Manufacturers
Household Aluminum Foil Market
Child-Resistant Foil Packaging Market Size and Share Forecast Outlook 2025 to 2035
Leading Providers & Market Share in Child-Resistant Foil Packaging
Printed Aluminium Foil Packaging Market Size and Share Forecast Outlook 2025 to 2035
Industry Share & Competitive Positioning in Printed Aluminium Foil Packaging
Antibacterial Hydrophilic Aluminum Foil Market Forecast and Outlook 2025 to 2035
Aluminum Alloy Sacrificial Anode Market Size and Share Forecast Outlook 2025 to 2035
Packaging Supply Market Size and Share Forecast Outlook 2025 to 2035
Packaging Testing Services Market Size and Share Forecast Outlook 2025 to 2035

Thank you!
You will receive an email from our Business Development Manager. Please be sure to check your SPAM/JUNK folder too.
Chat With
MaRIA