Aluminum Aerosol Cans Market
Market Insights on Aluminum Aerosol Cans covering sales outlook, demand forecast & up-to-date key trends
Aluminum Aerosol Cans Market By Capacity Type (Less Than 100 ml, 100-250 ml, 251-500 ml and More Than 500 ml), Product Type (Necked in, Shaped Wall and Straight Wall), End User Industry (Cosmetics & Personal Care, Household Products, Automotive/Industrial), and Region for 2022 and 2027
Aluminum Aerosol Cans Market Outlook – 2022-2027
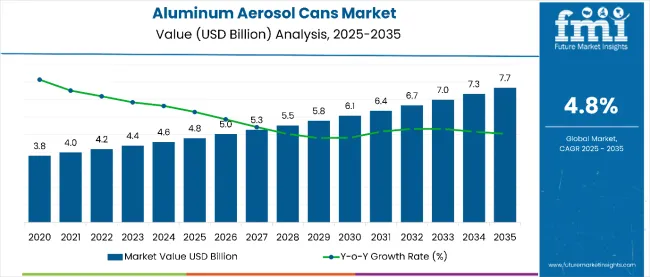
[141 Pages Report] The global aluminum aerosol cans market is estimated to reach a valuation of around US$ 4.2 Bn in 2022. With surging demand from various industries, the overall sales of aluminum aerosol cans are projected to rise at 5.3% CAGR between 2022 and 2027, surpassing a valuation of US$ 5.5 Bn by the end of 2027.
Attribute |
Details |
Aluminum Aerosol Cans Market Estimated Size in 2022 |
US$ 4.2 Bn |
Aluminum Aerosol Cans Market Value-Based CAGR (2022-2027) |
5.3% |
Aluminum Aerosol Cans Market Projected Size in 2027 |
US$ 5.5 Bn |
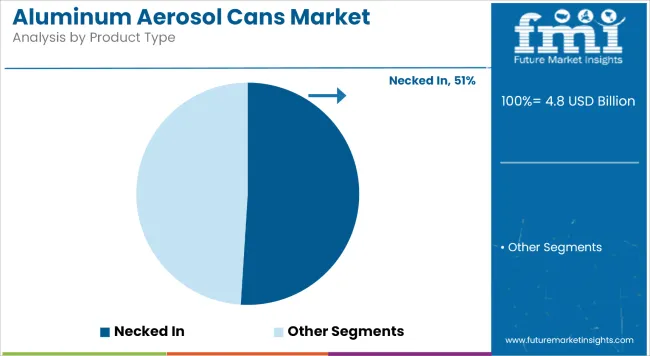
Necked in aluminum aerosol cans will continue to remain the top selling product, accounting for a major share of around 58.8% by 2022. Increasing adoption of necked in cans for the packaging of cosmetics and automotive paint sprays is driving their sales.
Let us know your requirement to get
100% FREE customization
How The Market Progressed Till June 2022?
Particulars |
Details |
H1 2021 |
5.5% |
H1 2022 Projected |
5.7% |
H1 2022 Expected |
6.0% |
BPS Change - H1, 2022 (O) – H1, 2022 (P) |
(+) 30 ↑ |
BPS Change – H1, 2022 (O) – H1, 2021 |
(+) 50 ↑ |
Future Market Insights predict a comparison and review analysis of the dynamics of the aluminum aerosol cans market, which is principally subjected to an array of industry factors along with a few definite influences regarding costly material used to manufacture aerosol cans in comparison to other alternatives.
Some new advances that have taken place in the market include 360° custom-shaped aerosol cans which offer innovative shapes at each angle of the can and attracts customers from the shelves itself. In May 2022, Crown Holdings launched a recycling initiative to increase access to aerosol recycling and on-pack recyclability messaging.
The market for aluminum aerosol cans is expected to increase by 50 basis share points (BPS) in H1-2022 (O) against comparison with H1-2021, according to an FMI analysis.
However, when comparing the H1-2022 projected and H1-2022 outlook period, a rise in BPS change by 30 BPS has been noticed. The key reason for this change in growth rate is due to its characteristics like light weight, more hygienic and is safer than most of the other packaging materials.
Despite these prospects, growing demand for cosmetics and several personal care products like deodorants, hair sprays and others and the rising demand for good aesthetics with glossy surfaces in the automotive industry are some factors likely to enhance the market growth of aluminum aerosol cans.
2013-2021 Aluminum Aerosol Cans Market Outlook Compared to 2022-2027 Forecast
The aluminum aerosol cans market is set to register a CAGR of 5.3% between 2022 and 2027 in comparison to 4.5% CAGR registered from 2013 to 2021.
According to FMI, the global aluminum aerosol cans market is driven by surging demand for personal care & cosmetic products, increasing penetration of online shopping platforms and rising adoption of aluminum aerosol cans across various industries such as automotive, agriculture and cosmetics.
Aluminum remains one of the most ideal materials for the packaging due to its various properties. It is lightweight, recyclable, and offers an unmatched combination of high strength and corrosion resistance.
Aluminum aerosol cans have become standard packaging solutions for volatile substances in the contemporary world. They offer safe, cost effective and impermeable features which makes them ideal for the storage of various day to day life products such as sanitizers and fragrances.
Rising disposable income along with changing lifestyle is creating high demand for personal care & cosmetic products. Globally, billions of dollars are being spent by consumers on purchasing personal care & cosmetic products such as deodorants, hair sprays and skin moisturizers. Rapid expansion of personal care & cosmetics industry will continue to spur the growth of aluminum aerosol cans market.
Similarly, flourishing automotive industry across the world is pushing the sales of aluminum aerosol cans and the trend is likely to continue in the future. Aluminum aerosol cans are being increasing utilized for packaging automotive spray paints and polishing creams.
Increasing consumer inclination towards hygienic, convenient and ecofriendly packaging solutions is creating lucrative growth opportunity for the aluminum aerosol cans. Aluminum cans are 100% recyclable and can be recycled without any loss of quality.
Innovations in shape and design of aluminum aerosol cans is adding to the aesthetic features of these products. Manufacturers are increasingly employing various technologies to develop lighter and cost-effective products. This will help them to penetrate the developing markets.
Rising trend of selling agricultural products such as fertilizers, insecticides and pesticides in aluminum aerosol cans is gaining traction. These cans do not easily react with the product insides. Hence, they improve the lifespan of these products as well as protect them from leakage.
Spurred by the aforementioned factors, the global aluminum aerosol cans market is set to expand 1.3X through 2027.
Will Rising Focus on Sustainability Continue to Drive the Aluminum Aerosol Cans Market?
Aluminum has become one of the most widely adopted materials for rigid packaging due to its sustainable and renewable nature. Over the last few decades, it has gained huge traction in the personal care & cosmetics industry.
Various industries such as personal care and automotive are showing a keen interest in utilizing ecofriendly materials for packaging. As a result, sales of aluminum aerosol cans are rising rapidly and the trend is likely to continue in the future.
Leading market players are leveraging latest technologies for the recycling of aluminum aerosol cans. New aluminum recycling initiatives and facilities are being developed across attractive regions. For instance, in February 2021, Trivium Packaging, a global leader in sustainable metal packaging announced a groundbreaking recycling initiative in Argentina to substantially increase the recollection and reuse of aluminum aerosol cans.
Producing recycled aluminum is more energy-efficient than new aluminum. So, aerosol can manufacturers are inclined towards using the recycled aluminum.
Find your sweet spots for generating winning opportunities in this market.
Talk to AnalystHow will the Penetration of E-Commerce Affect the Growth of Aluminum Aerosols Market?
Owing to the increasing penetration of the internet and digital devices, online shopping platforms have risen to prominence throughout the world. Today people are opting for purchasing majority of the things online through e-commerce platforms to save their time as well as money.
Large amounts are being spend on personal care, cosmetics and other daily use products. This in turn is accelerating the growth of aluminum aerosol cans market.
Moreover, leading players are utilizing these e-commerce platforms for reaching more widespread consumers. Growth strategies such as product branding and heavy advertisements are being employed.
Even during the outbreak of COVID-19 pandemic, sales of aluminum aerosol cans witnessed steady growth, especially across healthcare sector where they were employed for packaging of sanitizers and other sprays.
According to the International Organization of Aluminum Aerosol Container Manufacturers (AEROBAL), the global shipments of its members fell by 3.9% to around 2.9 billion units in the first half of 2021. The decline was rather moderate as compared to other industries.
Country-wise Insights
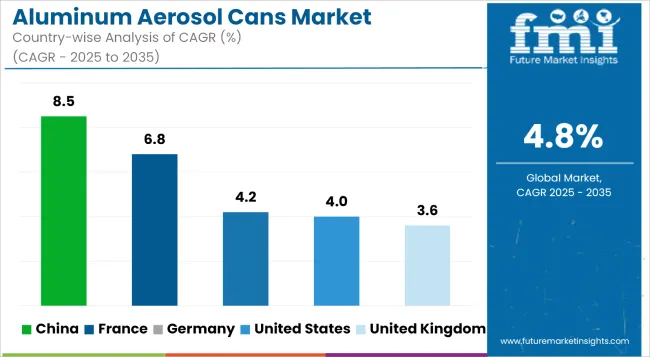
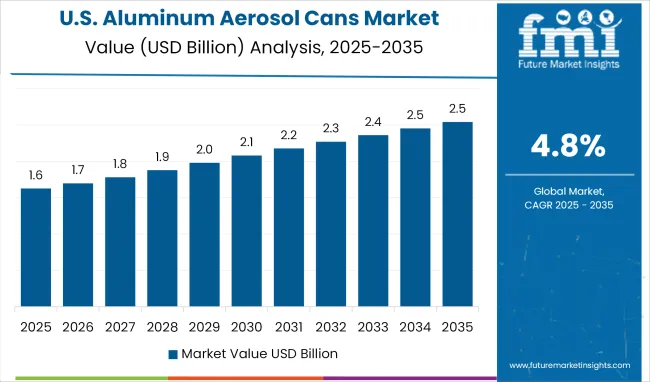
What Makes the U.S. a Lucrative Market for Aluminum Aerosol Cans?
The U.S. is emerging as one of the largest markets for aluminum aerosol cans owing to the increasing penetration of global brands, rising consumer spending on personal care & cosmetic products, expanding automotive industry and presence of leading market players such as Ball Corporation.
Aluminum aerosol cans have become one of the most convenient packaging solutions for majority of personal care, automotive paint sprays and healthcare products.
Rising consumer inclination towards using ecofriendly products will continue to fuel the demand for aluminum aerosol cans across the country. People are utilizing enormous personal care and cosmetic products to cope with the changing trends.
Growing support from government and other regulatory organizations is positively impacting the growth of aluminum aerosol cans market in the U.S. New recycling initiatives and laws are being framed to promote recycling of aluminum.
For instance, in 2019 the U.S. Environmental Protection Agency (EPA) launched the Aerosol Cans as Universal Waste Rule which allows aerosol can waste to be managed as universal waste under the federal Resource Conservation and Recovery Act (RCRA) hazardous waste rules (40 CFR 273). The aim of this rule is to promote recycling of aerosol cans for minimizing the landfill waste levels.
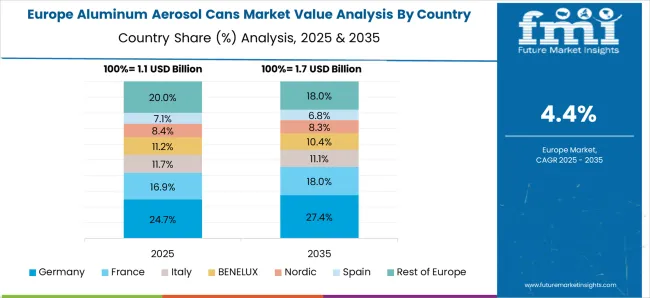
How Will the Growth Unfold for U.K. Aluminum Aerosol Cans Market?
As per FMI, the U.K. is slated to experience strong growth on account of rising consumer spending, increasing penetration of online shopping platforms and presence of leading market players.
The expanding cosmetic industry across the U.K is creating sales prospects for aluminum aerosol cans. Implementation of strict recycling laws in the country is encouraging companies to adopt aluminum aerosol cans over other metals.
Why is Demand for Aluminum Aerosol Cans Surging in France?
France is one of the leading exporters of cosmetic products in the world. The heavy presence of some of the leading personal care and cosmetic companies is augmenting the demand for better packaging solutions.
As aluminum aerosol cans are ecofriendly, cost effective, and prevent the volatile substances from escaping, companies are showing a keen interest in using them for the packaging of their products. Moreover, aluminum aerosol cans are ideal for long transportation chains due to their impermeable and lightweight features.
Rising focus on sustainability has put aluminum aerosol cans under the spotlight. Majority of the leading companies based in France are utilizing aluminum-based cans for the packaging of products.
How is the Growth Projection for China Aluminum Aerosol Cans Market?
China is home to some of the leading automotive and personal care companies. The country exports large amount of personal care and cosmetic products to various regions. It is gradually becoming the hub of automotive and cosmetic products.
Owing to the expansion of automotive and cosmetic industries along with rise of export business, China is witnessing strong demand for advanced packaging solutions such as aluminum aerosol cans. Additionally, the increasing adoption of aluminum aerosols cans for packaging insecticides and pesticides is supporting the growth of the market.
A healthy market share has been predicted for China aluminum market by FMI over the assessment period.

An unified Market Research Subscription Platform, built for today’s disparate research needs.
Category-wise Insights
Why are 100-250 ml Capacity Aluminum Aerosol Cans More Preferred Over Others?
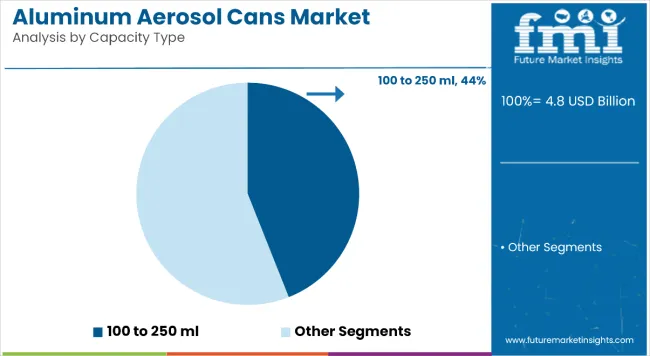
Based on capacity type, the aluminum aerosol cans market is segmented into 100 ml, 100-250 ml, 251-500 ml and more than 500 ml. Among these, the 100-250 ml segment accounts for the largest market share.
Sales of 100-250 ml aluminum aerosol cans are rising significantly as most of the personal care and automotive paint sprays are being sold in these cans. They are more convenient for packaging of these products.
Which Product Type Dominates the Aluminum Aerosol Cans Market?
On the basis of product type, the aluminum aerosol cans market is segmented into necked in, shaped wall and straight wall. Among these, necked in aluminum aerosol cans segment is projected to grow at a significant rate over the forecast period of 2022 and 2027.
Necked in aluminum aerosol cans are being used packaging of various products ranging from deodorant and insecticides to automotive products. They are extremely durable and convenient than their counterparts.
A major revenue share of 58.8% has been predicted for necked in aluminum aerosol cans by FMI through 2022.
Which is the Leading End User of Surgical Generators?
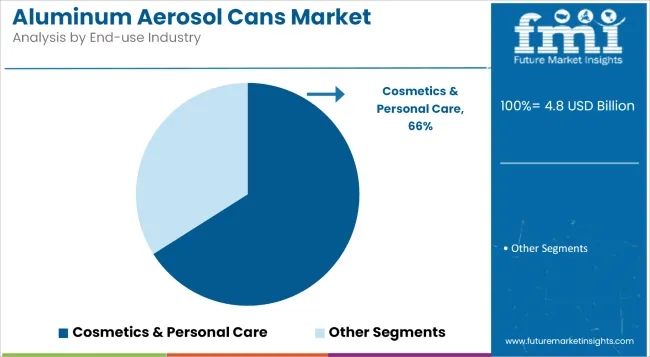
In terms of end user industry, the aluminum aerosol cans market has been segmented into cosmetics & personal care, household products, automotive or industrial and others.
As per FMI, cosmetics & personal care industry will continue to remain the most lucrative end uses for aluminum aerosol cans. Majority of the personal care and cosmetic products such as deodorants, sanitizers and shaving creams are being sold in aluminum aerosol cans, due to their various features.
Competitive Landscape
The global aluminum aerosol cans market is highly competitive with top 5 players cumulatively accounting for 26% share in 2021.
Leading players operating in the aluminum aerosol cans market are focusing on developing lightweight products at affordable prices. They are leveraging numerous strategies such as mergers, partnerships, new product launches, acquisitions and establishment of recycling facilities to dominate the market.
- In May 2021, Beiersdorf and Nussbaum, the Swiss packaging specialist announced the launch of aerosol cans made entirely from recycled aluminum. The new 100% recycled aerosol cans will hit the market at the end of 2021 announced the companies.
- In January 2019, Ball Corporation, the leader in aluminum aerosol packaging, introduced its new 360° aerosol can at the ADF & PCD exhibition in Paris. The new product expanded the company’s rigid packaging offerings across key regions.
- In March 2021 Damm, a leading beverage company and a major player in the food, hospitality, logistics and distribution industries in Spain, achieved ASI (Aluminum Stewardship Initiative) Performance Standard and Chain of Custody Standard certification for its cans.
Scope of the Report
Attribute |
Details |
Forecast Period |
2013-2021 |
Historical Data Available for |
2022-2027 |
Market Analysis |
Units for Volume and US$ Mn for Value |
Key Regions Covered |
North America, Latin America, Europe, APEJ, Japan, and the Middle East & Africa |
Key Countries Covered |
US, Canada, Mexico, Brazil, Germany, U.K., France, Italy, Spain, Russia, Poland, China, Japan, South Korea, India, ASEAN, Turkey and South Africa |
Key Segments Covered |
Modality, End-User and Region |
Key Companies Profiled |
|
Report Coverage |
Market Forecast, Company Share Analysis, Competition Intelligence, DROT Analysis, Market Dynamics and Challenges, and Strategic Growth Initiatives |
Customization & Pricing |
Available upon Request |
Aluminum Aerosol Cans Market by Category
By Capacity Type:
- Less than 100 ml
- 100-250ml
- 251-500 ml
- More than 500 ml
By Product Type:
- Necked In
- Shaped Wall
- Straight Wall
By End Use Industry:
- Cosmetics & Personal Care
- Household Products
- Automotive/Industrial
- Others
By Region:
- North America
- U.S.
- Canada
- Latin America
- Brazil
- Mexico
- Rest of Latin America
- Europe
- Germany
- U.K.
- France
- Spain
- Italy
- Rest of Europe
- APEJ
- China
- India
- Malaysia
- Singapore
- Australia
- Rest of APEJ
- Japan
- MEA
- GCC Countries
- Israel
- South Africa
- Rest of MEA
Frequently Asked Questions
The aluminum aerosol cans market is estimated to be worth around US$ 4.2 Bn in 2022.
As per FMI, the aluminum aerosol cans market is forecast to register a CAGR of 5.3% between 2022 and 2027.
The aluminum aerosol cans market grew at a CAGR of 4.5% between 2017 and 2021.
Rising adoption of necked in cans, increasing consumer spending on personal care products, establishment of new recycling plants and new product launches with innovative designs, and affordable rates are some of the key trends shaping the market growth.
The North American aluminum aerosol cans market is anticipated to experience strong growth through 2027.
Europe leads the global aluminum aerosol cans market with the largest share in 2022.
Ball Corporation, Crown Holdings, Inc., Alucon PCL, CPMC Holdings Ltd, Kian Joo Can Factory Bhd., CCL Industries Inc., Nampak Limited, China Aluminum Cans Holdings Ltd., TUBEX GmbH, and Bharat Containers, Exal Corporation, BWAY Corporation, Toyo Seikan Group Holdings Ltd, Linhardt GmbH & Co KG, Montebello Packaging Inc, Euro Asia Packaging (Guangdong) Co., Ltd, Shanghai Sunhome (Group) Co., Ltd., Alltub SAS are some of the leading players operating in the aluminum aerosol cans market.
Table of Content
1. Global Economic Outlook
2. Global Packaging Sector Outlook
3. Global Aluminum Aerosol Cans Market - Executive Summary
4. Global Aluminum Aerosol Cans Market Overview
4.1. Introduction
4.1.1. Global Aluminum Aerosol Cans Market Taxonomy
4.1.2. Global Aluminum Aerosol Cans Market Definition
4.2. Global Aluminum Aerosol Cans Market Size (US$ Mn & Volume) and Forecast, 2013-2021
4.2.1. Global Aluminum Aerosol Cans Market Y-o-Y Growth
4.3. Global Packaging Industry Overview
4.4. Global Flexible Packaging Industry Overview
4.5. Global Aluminum Aerosol Cans Market Dynamics
4.6. Supply Chain
4.7. Cost Structure
4.8. Pricing Analysis
4.9. Porter's Five Force Analysis
4.10. Forecast Factors: Relevance & Impact
4.11. Key Participants Market Presence (Intensity Map) By Region
5. Global Aluminum Aerosol Cans Market Analysis and Forecast 2013-2021
5.1. Global Aluminum Aerosol Cans Market Size and Forecast By Capacity Type, 2013-2021
5.1.1. Less Than 100 ml Market Size and Forecast, 2013-2021
5.1.1.1. Revenue (US$ Mn) & Volume Comparison, By Region
5.1.1.2. Market Share Comparison, By Region
5.1.1.3. Y-o-Y growth Comparison, By Region
5.1.2. 100-250 ml Market Size and Forecast, 2013-2021
5.1.2.1. Revenue (US$ Mn) & Volume Comparison, By Region
5.1.2.2. Market Share Comparison, By Region
5.1.2.3. Y-o-Y growth Comparison, By Region
5.1.3. 251-500 ml Market Size and Forecast, 2013-2021
5.1.3.1. Revenue (US$ Mn) & Volume Comparison, By Region
5.1.3.2. Market Share Comparison, By Region
5.1.3.3. Y-o-Y growth Comparison, By Region
5.1.4. More than 500 ml Market Size and Forecast, 2013-2021
5.1.4.1. Revenue (US$ Mn) & Volume Comparison, By Region
5.1.4.2. Market Share Comparison, By Region
5.1.4.3. Y-o-Y growth Comparison, By Region
5.2. Global Aluminum Aerosol Cans Market Size and Forecast By Product Type, 2013-2021
5.2.1. Necked In Market Size and Forecast, 2013-2021
5.2.1.1. Revenue (US$ Mn) & Volume Comparison, By Region
5.2.1.2. Market Share Comparison, By Region
5.2.1.3. Y-o-Y growth Comparison, By Region
5.2.2. Shaped Wall Market Size and Forecast, 2013-2021
5.2.2.1. Revenue (US$ Mn) & Volume Comparison, By Region
5.2.2.2. Market Share Comparison, By Region
5.2.2.3. Y-o-Y growth Comparison, By Region
5.2.3. Straight Wall Market Size and Forecast, 2013-2021
5.2.3.1. Revenue (US$ Mn) & Volume Comparison, By Region
5.2.3.2. Market Share Comparison, By Region
5.2.3.3. Y-o-Y growth Comparison, By Region
5.3. Global Aluminum Aerosol Cans Market Size and Forecast By Applications, 2013-2021
5.3.1. Cosmetic & Personal Care Market Size and Forecast, 2013-2021
5.3.1.1. Revenue (US$ Mn) & Volume Comparison, By Region
5.3.1.2. Market Share Comparison, By Region
5.3.1.3. Y-o-Y growth Comparison, By Region
5.3.2. Household Products Market Size and Forecast, 2013-2021
5.3.2.1. Revenue (US$ Mn) & Volume Comparison, By Region
5.3.2.2. Market Share Comparison, By Region
5.3.2.3. Y-o-Y growth Comparison, By Region
5.3.3. Others Market Size and Forecast, 2013-2021
5.3.3.1. Revenue (US$ Mn) & Volume Comparison, By Region
5.3.3.2. Market Share Comparison, By Region
5.3.3.3. Y-o-Y growth Comparison, By Region
6. North America Aluminum Aerosol Cans Market Size and Forecast, 2013-2021
6.1. North America Market Outlook
6.2. North America Packaging Sector Outlook
6.3. Revenue (US$ Mn) & Volume Comparison, By Country
6.3.1. US
6.3.2. Canada
6.4. Revenue (US$ Mn) & Volume Comparison, By Capacity Type
6.5. Revenue (US$ Mn) & Volume Comparison, By Product Type
6.6. Revenue (US$ Mn) & Volume Comparison, By Applications
7. Latin America Aluminum Aerosol Cans Market Size and Forecast, 2013-2021
7.1. Latin America Market Overview
7.2. Latin America Packaging Sector Outlook
7.3. Revenue (US$ Mn) & Volume Comparison, By Country
7.3.1. Brazil
7.3.2. Mexico
7.3.3. Rest of Latin America
7.4. Revenue (US$ Mn) & Volume Comparison, By Capacity Type
7.5. Revenue (US$ Mn) & Volume Comparison, By Product Type
7.6. Revenue (US$ Mn) & Volume Comparison, By Applications
8. Europe Aluminum Aerosol Cans Market Size and Forecast, 2013-2021
8.1. Europe Market Outlook
8.2. Europe Packaging Sector Outlook
8.3. Revenue (US$ Mn) & Volume Comparison, By Country
8.3.1. Germany
8.3.2. U.K.
8.3.3. Spain
8.3.4. France
8.3.5. Italy
8.3.6. Rest Of Europe
8.4. Revenue (US$ Mn) & Volume Comparison, By Capacity Type
8.5. Revenue (US$ Mn) & Volume Comparison, By Product Type
8.6. Revenue (US$ Mn) & Volume Comparison, By Applications
9. Japan Aluminum Aerosol Cans Market Size and Forecast, 2013-2021
9.1. Japan Market Outlook
9.2. Japan Packaging Sector Outlook
9.3. Revenue (US$ Mn) & Volume Comparison, By Country
9.3.1. Japan
9.4. Revenue (US$ Mn) & Volume Comparison, By Capacity Type
9.5. Revenue (US$ Mn) & Volume Comparison, By Product Type
9.6. Revenue (US$ Mn) & Volume Comparison, By Applications
10. APEJ Aluminum Aerosol Cans Market Size and Forecast, 2013-2021
10.1. APEJ Market Outlook
10.2. APEJ Packaging Sector Outlook
10.3. Revenue (US$ Mn) & Volume Comparison, By Country
10.3.1. China
10.3.2. India
10.3.3. Malaysia
10.3.4. Singapore
10.3.5. Australia
10.3.6. Rest of APEJ
10.4. Revenue (US$ Mn) & Volume Comparison, By Capacity Type
10.5. Revenue (US$ Mn) & Volume Comparison, By Product Type
10.6. Revenue (US$ Mn) & Volume Comparison, By Applications
11. MEA Aluminum Aerosol Cans Market Size and Forecast, 2013-2021
11.1. MEA Market Outlook
11.2. MEA Packaging Sector Outlook
11.3. Revenue (US$ Mn) & Volume Comparison, By Country
11.3.1. GCC Countries
11.3.2. South Africa
11.3.3. Israel
11.3.4. Rest of MEA
11.4. Revenue (US$ Mn) & Volume Comparison, By Capacity Type
11.5. Revenue (US$ Mn) & Volume Comparison, By Product Type
11.6. Revenue (US$ Mn) & Volume Comparison, By Applications
12. Global Aluminum Aerosol Cans Market Competitive Landscape
12.1. Global Aluminum Aerosol Cans Market Company Share Analysis
12.2. Global Aluminum Aerosol Cans Market Competitive Dashboard
12.3. Global Aluminum Aerosol Cans Market Company Profiles
12.3.1. Ball Corporation
12.3.2. Crown Holdings, Inc.
12.3.3. Ardagh Group S.A.
12.3.4. Alucon PCL
12.3.5. CPMC Holdings Ltd
12.3.6. Kian Joo Can Factory Bhd.
12.3.7. CCL Industries Inc.
12.3.8. Nampak Limited
12.3.9. China Aluminum Cans Holdings Ltd.
12.3.10. Perfektup Ambalaj Sanayi Ve Ticaret Anonim Sirketi
12.3.11. TUBEX Group
12.3.12. Linhardt GmbH & Co KG
12.3.13. Bharat Containers
12.3.14. Toyo Seikan Group Holdings Ltd.
12.3.15. Mauser Packaging Solutions
12.3.16. Exal Corporation
13. FMI Research Methodology
13.1. To Begin With
13.2. How we Develop Base Year Data
13.3. Overall Approach Explained Visually
13.4. To be Noted
13.5. Average Pricing Methodology
13.6. Forecasting Methodology
Let us know your requirement to get
100% FREE customization
List of Tables
Table 01: Global Aluminum Aerosol Cans Market Value (US$ Mn) & Volume, 2013-2021
Table 02: Global Aluminum Aerosol Cans Market Value (US$ Mn) & Volume, 2022-2027
Table 03: Global Aluminum Aerosol Cans Market Value (US$ Mn) & Volume and Y-o-Y, 2018-2027
Table 04: Global Less Than 100 ml Segment Value (US$ Mn) & Volume, By Region 2013-2021
Table 05: Global Less Than 100 ml Segment Value (US$ Mn) & Volume, By Region 2022-2027
Table 06: Global Less Than 100 ml Segment Market Share, By Region 2013-2021
Table 07: Global Less Than 100 ml Segment Market Share, By Region 2022-2027
Table 08: Global Less Than 100 ml Segment Y-o-Y, By Region 2018-2027
Table 09: Global 100-250 ml Segment Value (US$ Mn) & Volume, By Region 2013-2021
Table 10: Global 100-250 ml Segment Value (US$ Mn) & Volume, By Region 2022-2027
Table 11: Global 100-250 ml Segment Market Share, By Region 2013-2021
Table 12: Global 100-250 ml Segment Market Share, By Region 2022-2027
Table 13: Global 100-250 ml Segment Y-o-Y, By Region 2018-2027
Table 14: Global 251-500 ml Segment Value (US$ Mn) & Volume, By Region 2013-2021
Table 15: Global 251-500 ml Segment Value (US$ Mn) & Volume, By Region 2022-2027
Table 16: Global 251-500 ml Segment Market Share, By Region 2013-2021
Table 17: Global 251-500 ml Segment Market Share, By Region 2022-2027
Table 18: Global 251-500 ml Segment Y-o-Y, By Region 2018-2027
Table 19: Global More than 500 ml Segment Value (US$ Mn) & Volume, By Region 2013-2021
Table 20: Global More than 500 ml Segment Value (US$ Mn) & Volume, By Region 2022-2027
Table 21: Global More than 500 ml Segment Market Share, By Region 2013-2021
Table 22: Global More than 500 ml Segment Market Share, By Region 2022-2027
Table 23: Global More than 500 ml Segment Y-o-Y, By Region 2018-2027
Table 24: Global Necked In Segment Value (US$ Mn) & Volume, By Region 2013-2021
Table 25: Global Necked In Segment Value (US$ Mn) & Volume, By Region 2022-2027
Table 26: Global Necked In Segment Market Share, By Region 2013-2021
Table 27: Global Necked In Segment Market Share, By Region 2022-2027
Table 28: Global Necked In Segment Y-o-Y, By Region 2018-2027
Table 29: Global Shaped Wall Segment Value (US$ Mn) & Volume, By Region 2013-2021
Table 30: Global Shaped Wall Segment Value (US$ Mn) & Volume, By Region 2022-2027
Table 31: Global Shaped Wall Segment Market Share, By Region 2013-2021
Table 32: Global Shaped Wall Segment Market Share, By Region 2022-2027
Table 33: Global Shaped Wall Segment Y-o-Y, By Region 2018-2027
Table 34: Global Straight Wall Segment Value (US$ Mn) & Volume, By Region 2013-2021
Table 35: Global Straight Wall Segment Value (US$ Mn) & Volume, By Region 2022-2027
Table 36: Global Straight Wall Segment Market Share, By Region 2013-2021
Table 37: Global Straight Wall Segment Market Share, By Region 2022-2027
Table 38: Global Straight Wall Segment Y-o-Y, By Region 2018-2027
Table 39: Global Cosmetic & Personal Care Segment Value (US$ Mn) & Volume, By Region 2013-2021
Table 40: Global Cosmetic & Personal Care Segment Value (US$ Mn) & Volume, By Region 2022-2027
Table 41: Global Cosmetic & Personal Care Segment Market Share, By Region 2013-2021
Table 42: Global Cosmetic & Personal Care Segment Market Share, By Region 2022-2027
Table 43: Global Cosmetic & Personal Care Segment Y-o-Y, By Region 2018-2027
Table 44: Global Household Products Segment Value (US$ Mn) & Volume, By Region 2013-2021
Table 45: Global Household Products Segment Value (US$ Mn) & Volume, By Region 2022-2027
Table 46: Global Household Products Segment Market Share, By Region 2013-2021
Table 47: Global Household Products Segment Market Share, By Region 2022-2027
Table 48: Global Household Products Segment Y-o-Y, By Region 2018-2027
Table 49: Global Automotive/ Industrial Segment Value (US$ Mn) & Volume, By Region 2013-2021
Table 50: Global Automotive/ Industrial Segment Value (US$ Mn) & Volume, By Region 2022-2027
Table 51: Global Automotive/ Industrial Segment Market Share, By Region 2013-2021
Table 52: Global Automotive/ Industrial Segment Market Share, By Region 2022-2027
Table 53: Global Automotive/ Industrial Segment Y-o-Y, By Region 2018-2027
Table 54: Global Others Segment Value (US$ Mn) & Volume, By Region 2013-2021
Table 55: Global Others Segment Value (US$ Mn) & Volume, By Region 2022-2027
Table 56: Global Others Segment Market Share, By Region 2013-2021
Table 57: Global Others Segment Market Share, By Region 2022-2027
Table 58: Global Others Segment Y-o-Y, By Region 2018-2027
Table 59: North America Aluminum Aerosol Cans Market Value (US$ Mn) & Volume, By Country 2013-2021
Table 60: North America Aluminum Aerosol Cans Market Value (US$ Mn) & Volume, By Country 2022-2027
Table 61: North America Aluminum Aerosol Cans Market Value (US$ Mn) & Volume, By Capacity Type 2013-2021
Table 62: North America Aluminum Aerosol Cans Market Value (US$ Mn) & Volume, By Capacity Type 2022-2027
Table 63: North America Aluminum Aerosol Cans Market Value (US$ Mn) & Volume, By Product Type 2013-2021
Table 64: North America Aluminum Aerosol Cans Market Value (US$ Mn) & Volume, By Product Type 2022-2027
Table 65: North America Aluminum Aerosol Cans Market Value (US$ Mn) & Volume, By Applications 2013-2021
Table 66: North America Aluminum Aerosol Cans Market Value (US$ Mn) & Volume, By Applications 2022-2027
Table 67: Latin America Aluminum Aerosol Cans Market Value (US$ Mn) & Volume, By Country 2013-2021
Table 68: Latin America Aluminum Aerosol Cans Market Value (US$ Mn) & Volume, By Country 2022-2027
Table 69: Latin America Aluminum Aerosol Cans Market Value (US$ Mn) & Volume, By Capacity Type 2013-2021
Table 70: Latin America Aluminum Aerosol Cans Market Value (US$ Mn) & Volume, By Capacity Type 2022-2027
Table 71: Latin America Aluminum Aerosol Cans Market Value (US$ Mn) & Volume, By Product Type 2013-2021
Table 72: Latin America Aluminum Aerosol Cans Market Value (US$ Mn) & Volume, By Product Type 2022-2027
Table 73: Latin America Aluminum Aerosol Cans Market Value (US$ Mn) & Volume, By Applications 2013-2021
Table 74: Latin America Aluminum Aerosol Cans Market Value (US$ Mn) & Volume, By Applications 2022-2027
Table 75: Europe Aluminum Aerosol Cans Market Value (US$ Mn) & Volume, By Country 2013-2021
Table 76: Europe Aluminum Aerosol Cans Market Value (US$ Mn) & Volume, By Country 2022-2027
Table 77: Europe Aluminum Aerosol Cans Market Value (US$ Mn) & Volume, By Capacity Type 2013-2021
Table 78: Europe Aluminum Aerosol Cans Market Value (US$ Mn) & Volume, By Capacity Type 2022-2027
Table 79: Europe Aluminum Aerosol Cans Market Value (US$ Mn) & Volume, By Product Type 2013-2021
Table 80: Europe Aluminum Aerosol Cans Market Value (US$ Mn) & Volume, By Product Type 2022-2027
Table 81: Europe Aluminum Aerosol Cans Market Value (US$ Mn) & Volume, By Applications 2013-2021
Table 82: Europe Aluminum Aerosol Cans Market Value (US$ Mn) & Volume, By Applications 2022-2027
Table 83: Japan Aluminum Aerosol Cans Market Value (US$ Mn) & Volume, By Country 2013-2021
Table 84: Japan Aluminum Aerosol Cans Market Value (US$ Mn) & Volume, By Country 2022-2027
Table 85: Japan Aluminum Aerosol Cans Market Value (US$ Mn) & Volume, By Capacity Type 2013-2021
Table 86: Japan Aluminum Aerosol Cans Market Value (US$ Mn) & Volume, By Capacity Type 2022-2027
Table 87: Japan Aluminum Aerosol Cans Market Value (US$ Mn) & Volume, By Product Type 2013-2021
Table 88: Japan Aluminum Aerosol Cans Market Value (US$ Mn) & Volume, By Product Type 2022-2027
Table 89: Japan Aluminum Aerosol Cans Market Value (US$ Mn) & Volume, By Applications 2013-2021
Table 90: Japan Aluminum Aerosol Cans Market Value (US$ Mn) & Volume, By Applications 2022-2027
Table 91: APEJ Aluminum Aerosol Cans Market Value (US$ Mn) & Volume, By Country 2013-2021
Table 92: APEJ Aluminum Aerosol Cans Market Value (US$ Mn) & Volume, By Country 2022-2027
Table 93: APEJ Aluminum Aerosol Cans Market Value (US$ Mn) & Volume, By Capacity Type 2013-2021
Table 94: APEJ Aluminum Aerosol Cans Market Value (US$ Mn) & Volume, By Capacity Type 2022-2027
Table 95: APEJ Aluminum Aerosol Cans Market Value (US$ Mn) & Volume, By Product Type 2013-2021
Table 96: APEJ Aluminum Aerosol Cans Market Value (US$ Mn) & Volume, By Product Type 2022-2027
Table 97: APEJ Aluminum Aerosol Cans Market Value (US$ Mn) & Volume, By Applications 2013-2021
Table 98: APEJ Aluminum Aerosol Cans Market Value (US$ Mn) & Volume, By Applications 2022-2027
Table 99: MEA Aluminum Aerosol Cans Market Value (US$ Mn) & Volume, By Country 2013-2021
Table 100:MEA Aluminum Aerosol Cans Market Value (US$ Mn) & Volume, By Country 2022-2027
Table 101:MEA Aluminum Aerosol Cans Market Value (US$ Mn) & Volume, By Capacity Type 2013-2021
Table 102:MEA Aluminum Aerosol Cans Market Value (US$ Mn) & Volume, By Capacity Type 2022-2027
Table 103:MEA Aluminum Aerosol Cans Market Value (US$ Mn) & Volume, By Product Type 2013-2021
Table 104:MEA Aluminum Aerosol Cans Market Value (US$ Mn) & Volume, By Product Type 2022-2027
Table 105:MEA Aluminum Aerosol Cans Market Value (US$ Mn) & Volume, By Applications 2013-2021
Table 106:MEA Aluminum Aerosol Cans Market Value (US$ Mn) & Volume, By Applications 2022-2027
Find your sweet spots for generating winning opportunities in this market.
Talk to AnalystList of Charts
Figure 01: Global Aluminum Aerosol Cans Market Value (US$ Mn), 2013-2021
Figure 02: Global Aluminum Aerosol Cans Market Value (US$ Mn) Forecast, 2019-2027
Figure 03: Global Aluminum Aerosol Cans Market Value (US$ Mn) and Y-o-Y, 2022-2027
Figure 04: Global Less Than 100 ml Segment Market Value (US$ Mn) By Region, 2013-2021
Figure 05: Global Less Than 100 ml Segment Market Value (US$ Mn) By Region, 2019-2027
Figure 06: Global Less Than 100 ml Segment Y-o-Y Growth Rate, By Region, 2022-2027
Figure 07: Global 100-250 ml Segment Market Value (US$ Mn) By Region, 2013-2021
Figure 08: Global 100-250 ml Segment Market Value (US$ Mn) By Region, 2019-2027
Figure 09: Global 100-250 ml Segment Y-o-Y Growth Rate, By Region, 2022-2027
Figure 10: Global 251-500 ml Segment Market Value (US$ Mn) By Region, 2013-2021
Figure 11: Global 251-500 ml Segment Market Value (US$ Mn) By Region, 2019-2027
Figure 12: Global 251-500 ml Segment Y-o-Y Growth Rate, By Region, 2022-2027
Figure 13: Global More than 500 ml Segment Market Value (US$ Mn) By Region, 2013-2021
Figure 14: Global More than 500 ml Segment Market Value (US$ Mn) By Region, 2019-2027
Figure 15: Global More than 500 ml Segment Y-o-Y Growth Rate, By Region, 2022-2027
Figure 16: Global Necked In Segment Market Value (US$ Mn) By Region, 2013-2021
Figure 17: Global Necked In Segment Market Value (US$ Mn) By Region, 2019-2027
Figure 18: Global Necked In Segment Y-o-Y Growth Rate, By Region, 2022-2027
Figure 19: Global Shaped Wall Segment Market Value (US$ Mn) By Region, 2013-2021
Figure 20: Global Shaped Wall Segment Market Value (US$ Mn) By Region, 2019-2027
Figure 21: Global Shaped Wall Segment Y-o-Y Growth Rate, By Region, 2022-2027
Figure 22: Global Straight Wall Segment Market Value (US$ Mn) By Region, 2013-2021
Figure 23: Global Straight Wall Segment Market Value (US$ Mn) By Region, 2019-2027
Figure 24: Global Straight Wall Segment Y-o-Y Growth Rate, By Region, 2022-2027
Figure 25: Global Cosmetic & Personal Care Segment Market Value (US$ Mn) By Region, 2013-2021
Figure 26: Global Cosmetic & Personal Care Segment Market Value (US$ Mn) By Region, 2019-2027
Figure 27: Global Cosmetic & Personal Care Segment Y-o-Y Growth Rate, By Region, 2022-2027
Figure 28: Global Household Products Segment Market Value (US$ Mn) By Region, 2013-2021
Figure 29: Global Household Products Segment Market Value (US$ Mn) By Region, 2019-2027
Figure 30: Global Household Products Segment Y-o-Y Growth Rate, By Region, 2022-2027
Figure 31: Global Automotive/ Industrial Segment Market Value (US$ Mn) By Region, 2013-2021
Figure 32: Global Automotive/ Industrial Segment Market Value (US$ Mn) By Region, 2019-2027
Figure 33: Global Automotive/ Industrial Segment Y-o-Y Growth Rate, By Region, 2022-2027
Figure 34: Global Others Segment Market Value (US$ Mn) By Region, 2013-2021
Figure 35: Global Others Segment Market Value (US$ Mn) By Region, 2019-2027
Figure 36: Global Others Segment Y-o-Y Growth Rate, By Region, 2022-2027
Figure 37: North America Aluminum Aerosol Cans Market Value (US$ Mn), By Country 2013-2021
Figure 38: North America Aluminum Aerosol Cans Market Value (US$ Mn), By Country 2019-2027
Figure 39: North America Aluminum Aerosol Cans Market Value (US$ Mn), By Capacity Type 2013-2021
Figure 40: North America Aluminum Aerosol Cans Market Value (US$ Mn), By Capacity Type 2019-2027
Figure 41: North America Aluminum Aerosol Cans Market Value (US$ Mn), By Product Type 2013-2021
Figure 42: North America Aluminum Aerosol Cans Market Value (US$ Mn), By Product Type 2019-2027
Figure 43: North America Aluminum Aerosol Cans Market Value (US$ Mn), By Applications 2013-2021
Figure 44: North America Aluminum Aerosol Cans Market Value (US$ Mn), By Applications 2019-2027
Figure 45: Latin America Aluminum Aerosol Cans Market Value (US$ Mn), By Country 2013-2021
Figure 46: Latin America Aluminum Aerosol Cans Market Value (US$ Mn), By Country 2019-2027
Figure 47: Latin America Aluminum Aerosol Cans Market Value (US$ Mn), By Capacity Type 2013-2021
Figure 48: Latin America Aluminum Aerosol Cans Market Value (US$ Mn), By Capacity Type 2019-2027
Figure 49: Latin America Aluminum Aerosol Cans Market Value (US$ Mn), By Product Type 2013-2021
Figure 50: Latin America Aluminum Aerosol Cans Market Value (US$ Mn), By Product Type 2019-2027
Figure 51: Latin America Aluminum Aerosol Cans Market Value (US$ Mn), By Applications 2013-2021
Figure 52: Latin America Aluminum Aerosol Cans Market Value (US$ Mn), By Applications 2019-2027
Figure 53: Europe Aluminum Aerosol Cans Market Value (US$ Mn), By Country 2013-2021
Figure 54: Europe Aluminum Aerosol Cans Market Value (US$ Mn), By Country 2019-2027
Figure 55: Europe Aluminum Aerosol Cans Market Value (US$ Mn), By Capacity Type 2013-2021
Figure 56: Europe Aluminum Aerosol Cans Market Value (US$ Mn), By Capacity Type 2019-2027
Figure 57: Europe Aluminum Aerosol Cans Market Value (US$ Mn), By Product Type 2013-2021
Figure 58: Europe Aluminum Aerosol Cans Market Value (US$ Mn), By Product Type 2019-2027
Figure 59: Europe Aluminum Aerosol Cans Market Value (US$ Mn), By Applications 2013-2021
Figure 60: Europe Aluminum Aerosol Cans Market Value (US$ Mn), By Applications 2019-2027
Figure 61: Japan Aluminum Aerosol Cans Market Value (US$ Mn), By Country 2013-2021
Figure 62: Japan Aluminum Aerosol Cans Market Value (US$ Mn), By Country 2019-2027
Figure 63: Japan Aluminum Aerosol Cans Market Value (US$ Mn), By Capacity Type 2013-2021
Figure 64: Japan Aluminum Aerosol Cans Market Value (US$ Mn), By Capacity Type 2019-2027
Figure 65: Japan Aluminum Aerosol Cans Market Value (US$ Mn), By Applications 2013-2021
Figure 66: Japan Aluminum Aerosol Cans Market Value (US$ Mn), By Product Type 2019-2027
Figure 67: Japan Aluminum Aerosol Cans Market Value (US$ Mn), By Applications 2013-2021
Figure 68: Japan Aluminum Aerosol Cans Market Value (US$ Mn), By Applications 2019-2027
Figure 69: APEJ Aluminum Aerosol Cans Market Value (US$ Mn), By Country 2013-2021
Figure 70: APEJ Aluminum Aerosol Cans Market Value (US$ Mn), By Country 2019-2027
Figure 71: APEJ Aluminum Aerosol Cans Market Value (US$ Mn), By Capacity Type 2013-2021
Figure 72: APEJ Aluminum Aerosol Cans Market Value (US$ Mn), By Capacity Type 2019-2027
Figure 73: APEJ Aluminum Aerosol Cans Market Value (US$ Mn), By Product Type 2013-2021
Figure 74: APEJ Aluminum Aerosol Cans Market Value (US$ Mn), By Product Type 2019-2027
Figure 75: APEJ Aluminum Aerosol Cans Market Value (US$ Mn), By Applications 2013-2021
Figure 76: APEJ Aluminum Aerosol Cans Market Value (US$ Mn), By Applications 2019-2027
Figure 77: MEA Aluminum Aerosol Cans Market Value (US$ Mn), By Country 2013-2021
Figure 78: MEA Aluminum Aerosol Cans Market Value (US$ Mn), By Country 2019-2027
Figure 79: MEA Aluminum Aerosol Cans Market Value (US$ Mn), By Capacity Type 2013-2021
Figure 80: MEA Aluminum Aerosol Cans Market Value (US$ Mn), By Capacity Type 2019-2027
Figure 81: MEA Aluminum Aerosol Cans Market Value (US$ Mn), By Product Type 2013-2021
Figure 82: MEA Aluminum Aerosol Cans Market Value (US$ Mn), By Product Type 2019-2027
Figure 83: MEA Aluminum Aerosol Cans Market Value (US$ Mn), By Applications 2013-2021
Figure 84: MEA Aluminum Aerosol Cans Market Value (US$ Mn), By Applications 2019-2027
Need specific information?
Request CustomizationExplore Packaging Insights
View Reports