Reports
- Global Locations -
Headquarters
Future Market Insights, Inc.
Christiana Corporate, 200
Continental Drive, Suite 401,
Newark, Delaware - 19713,
United States
Americas
Future Market Insights, Inc.
616 Corporate Way, Suite 2-9018,
Valley Cottage, NY 10989, United States
MEA
Future Market Insights
1602-6 Jumeirah Bay X2 Tower, Plot No: JLT-PH2-X2A,
Jumeirah Lakes Towers, Dubai,
United Arab Emirates
Europe
Future Market Insights
3rd Floor, 207 Regent Street,
W1B 3HH London
United Kingdom
Asia Pacific
Future Market Insights
Office No. 401-A, 4th Floor,
VANTAGE 9, S.No. 36/1/1,
Baner, Pune 411045, India
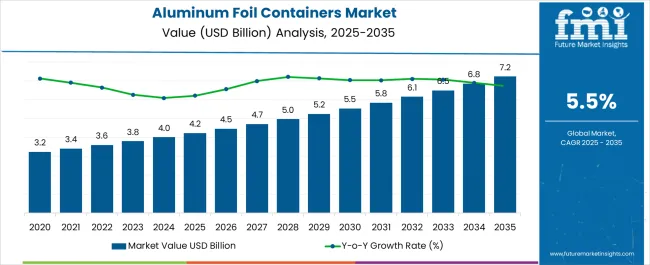
The aluminum foil containers market is expected to reach a valuation of US$ 3.8 billion in 2023 and record a CAGR of 5.5%. The valuation is projected to reach US$ 6.5 billion over the forecast period.
According to Future Market Insights, the growing demand for cost-effective, lightweight, and single-serve packaging solutions is likely to propel the growth of the aluminum foil containers market during the forecast period.
Globally, the revenue generated by the aluminum foil containers market was worth US$ 3.6 billion in 2022 and is expected to witness a CAGR of 5.5% in terms of value throughout the forecast period.
Future Market Insights predict a comparison and analysis of the dynamics of the aluminum foil containers market, which is principally subjected to an array of industry factors along with a few definite influences regarding the dearth of proper recycling procedures, which is further projected to hinder the growth of the aluminum foil containers market.
Some new advances that have taken place in the market include the use of disposable aluminum container. In February 2022, Novelis Inc. launched a net zero lab to develop carbon-neutral solutions for aluminum manufacturing.
Despite these prospects, increasing demand for lightweight and durable packaging solutions in the food and food service industry is expected to surge the demand for aluminum foil containers. Further, cost-effectiveness is the primary aspect of the popularity of aluminum foil containers which has boosted their demand in the food & Beverage industry. This is also the reason for these foils being readily made available in supermarkets. Households are increasingly using these foils for their ease-of-use quality, and they are readily available across supermarkets too. These factors are boosting the market for aluminum foil containers.
Attributes | Details |
---|---|
Aluminum Foil Containers Market Value (2022) | US$ 3.6 billion |
Aluminum Foil Containers Market Expected Value (2023) | US$ 3.8 billion |
Aluminum Foil Containers Market Forecast Value (2033) | US$ 6.5 billion |
Aluminum Foil Containers Market Expected CAGR (2023 to 2033) | 5.5% |
Don't pay for what you don't need
Customize your report by selecting specific countries or regions and save 30%!
There has been a dynamic shift in the consumers’ consumption patterns in the food and beverages sector. Consumer inclination towards takeaway or ready-to-eat food is increasing, owing to changing lifestyles and growing disposable incomes, especially in emerging economies across the globe.
Food service operators offer various services such as ‘takeaway and drive-through’ to cater to the growing number of on-the-go consumers. With the growing working population and increasing urbanization, these food formats are expected to gain popularity among millennials. Increasing usage of aluminum foil containers for packaging in the food service industry, in turn, is expected to drive the demand for the aluminum foil containers market during the forecast period.
Short-term (2022 to 2025): Global demand for convenience and hygienic packaging solutions is increasing exponentially, especially in food packaging. Aluminum foil containers are gaining popularity in the food service industry due to their recyclable, lightweight, and cost-effective nature. Aluminum foil containers are also proven to reduce food contamination, thereby making them a hygienic packaging solution. These factors are expected to propel the market in the short-term period.
Mid-term (2025 to 2027): The rising acceptance of aluminum foil containers in food service and other end-uses is due to their easy storage, on-the-go use feature, and lightweight nature. Further, the growing e-commerce industry is making the availability of these containers easy, which is boosting their demand from households. These factors are likely to push the global aluminum foil container market growth during this period.
Long-term (2028 to 2033): A significant amount of food items are spoiled due to exposure to moisture and air, thereby increasing the need for packaging solutions that protect food items from these elements. Aluminum foil containers can withstand extreme temperature changes and hence can be used in microwave ovens and are very easy to clean. Moreover, aluminum foil containers are good when it comes to the storage of food and avoiding exposure to extreme temperatures, and they are also affordable. These factors are expected to fuel the growth of the global aluminum foil containers market during the forecast period.
Aluminum Foil Containers Market:
Attributes | Aluminum Foil Containers Market |
---|---|
Anticipated CAGR (2023 to 2033) | 5.5% |
Market Value (2023) | US$ 3.8 billion |
Growth Factor | Increasing packaging industry to propel growth |
Future Opportunities | The rising demand from the Food & Beverage industry |
Market Trends | Sustainable packaging solutions. |
Printed Aluminum Foil Packaging Market:
Attributes | Printed Aluminum Foil Packaging Market |
---|---|
Anticipated CAGR (2023 to 2033) | 4.5% |
Market Value (2023) | US$ 25 billion |
Growth Factor | Ready to use confectionary and medicinal supplies |
Future Opportunities | Manufacturing effective and affordable packaging solutions. |
Market Trends | Government initiatives regarding quality standards and food safety |
Glass Container Market:
Attributes | Glass Container Market |
---|---|
Anticipated CAGR (2023 to 2033) | 5.2% |
Market Value (2023) | US$ 61.5 billion |
Growth Factor | Rising disposable incomes and changing preferences of consumers |
Future Opportunities | Rising awareness about luxury home décor. |
Market Trends | Adoption of glass containers to provide transparency of food items. |
Volatility in Pricing of Raw Materials to hamper the Market
Maintaining a long-term relationship with raw material suppliers, distributors, and retailers is essential in any business. Thus, manufacturers need to channel their efforts toward it.
The increasing number of domestic players in the aluminum foil containers market and the capacity expansion of existing players lead to a reduction in pricing, which ultimately shrinks the net profit of aluminum foil container manufacturers. These factors are likely to hinder the growth of the global aluminum foil containers market during the forecast period.
The global aluminum foil containers market, by capacity, spans up to 50 ml, 50 ml to 200 ml, 200 ml to 400 ml, and 400 ml & above. By type of product, it’s non-compartmental and compartmental. By type of aluminum foil, it’s heavy-duty foil and standard-duty foil.
By end-use, it’s food services, bakery & confectionery, food packers/processors, retail and supermarkets, and others (electronics, medical, etc.). Out of these, the compartmental product type holds the largest market share. The segment is expected to register a CAGR of 5.5% by the end of the forecast period. By end-use, food services are dominating the market. This scenario is expected to continue even in the forecast period.
There is expected to be a rising demand for aluminum food foil containers as these ensure the safety of food products. The Food industry especially uses aluminum foil containers with lid so that there is no spillage of food items. With the rising e-commerce sector, the food delivery vendors too are increasing in numbers. People prefer ordering food online these days due to health concerns associated with eating out. This is giving rise to the adoption of aluminum foil takeaway containers.
Get the data you need at a Fraction of the cost
Personalize your report by choosing insights you need
and save 40%!
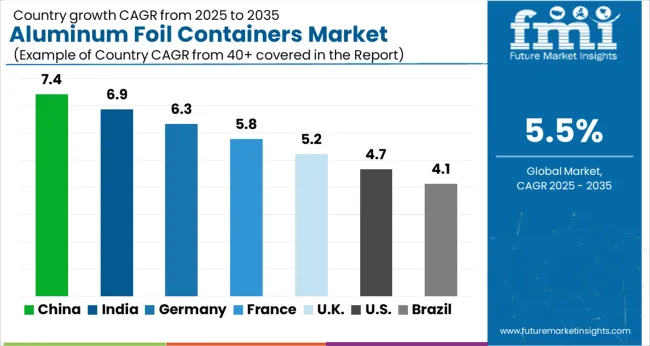
North America holds a significant market share, followed by Europe and the Asia-Pacific. This could be credited to an extensive demand for aluminum foil containers throughout, especially in the post-COVID era. With hygiene being the topmost priority, the foodservice vertical is unimaginable without aluminum foil containers.
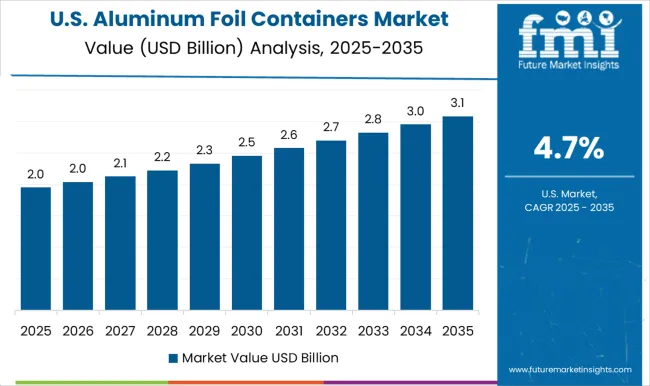
The United States is expected to be the dominant region during the forecast period. Increasing use of EV batteries has risen production and is thereby boosting the demand for aluminum foil. Further, the growing acceptance of fast food chains and ordering via e-commerce websites has risen the demand for aluminum foil containers in the United States. The United States market is expected to reach a valuation of US$ 1.2 billion and register a CAGR of 5.3% during the forecast period.
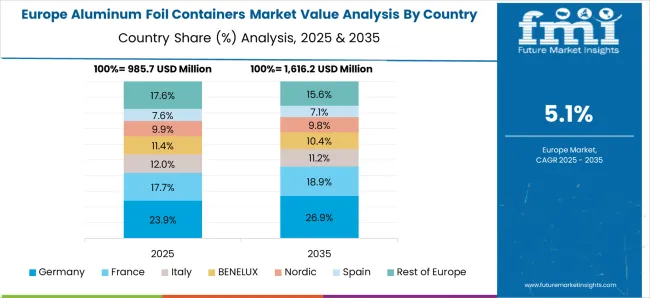
Various factors, like initiatives taken by the government for the promotion of food exports and efforts taken towards decarbonization, are driving the demand for aluminum foil containers. This rising need is correspondingly increasing vendors for making aluminum foil containers in Europe. The United States market is expected to register a CAGR of 3.6% during the forecast period.
The packaging industry in the Asia Pacific is growing exponentially. For example, the board of SRF Ltd., India, gave approval for setting up a manufacturing plant for aluminum foils in Indore in the year 2022 with a huge investment. The plant is expected to address packaging requirements from domestic vendors as well as export needs from the food industry. The Indian market is anticipated to register a CAGR of 7.5% during the forecast period.
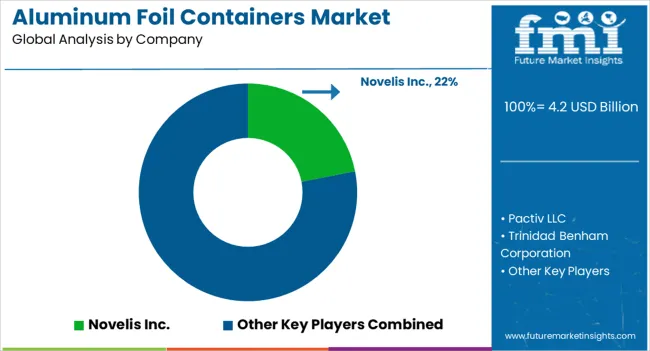
The market for aluminum foil containers is fragmented due to the presence of numerous vendors globally. Key players have to compete with some other market substitutes like glass, plastic, and paper containers. Further, communication with consumers is an aspect that the key players have to look into.
The increasing demand for aluminum foil containers is leading to huge investments from the key players, which is propelling the market further.
A few of the developments observed among the key players in aluminum foil containers market are:
Attribute | Details |
---|---|
Forecast Period | 2023 to 2033 |
Historical Data Available for | 2018 to 2022 |
Market Analysis | US$ million/billion for Value |
Key Regions Covered | North America, Latin America, Europe, South Asia, East Asia, Oceania, and the Middle East & Africa |
Key Countries Covered | USA, Canada, Brazil, Mexico, Germany, United Kingdom, France, Italy, Spain, Benelux, Russia, China, Japan, South Korea, India, Thailand, Indonesia, Malaysia, Singapore, China, Japan, South Korea, Australia, New Zealand, Turkiye, Egypt, North Africa, South Africa, and GCC Countries |
Key Market Segments Covered | Capacity, Product Type, Aluminum Foil Type, End-use, and Region |
Key Companies Profiled |
|
Pricing | Available upon Request |
1. Executive Summary | Aluminum Foil Containers Market 1.1. Global Market Outlook 1.2. Demand-side Trends 1.3. Supply-side Trends 1.4. Technology Roadmap Analysis 1.5. Analysis and Recommendations 2. Market Overview 2.1. Market Coverage / Taxonomy 2.2. Market Definition / Scope / Limitations 3. Market Background 3.1. Market Dynamics 3.1.1. Drivers 3.1.2. Restraints 3.1.3. Opportunity 3.1.4. Trends 3.2. Scenario Forecast 3.2.1. Demand in Optimistic Scenario 3.2.2. Demand in Likely Scenario 3.2.3. Demand in Conservative Scenario 3.3. Opportunity Map Analysis 3.4. Product Life Cycle Analysis 3.5. Supply Chain Analysis 3.5.1. Supply Side Participants and their Roles 3.5.1.1. Producers 3.5.1.2. Mid-Level Participants (Traders/ Agents/ Brokers) 3.5.1.3. Wholesalers and Distributors 3.5.2. Value Added and Value Created at Node in the Supply Chain 3.5.3. List of Raw Material Suppliers 3.5.4. List of Existing and Potential Buyer’s 3.6. Investment Feasibility Matrix 3.7. Value Chain Analysis 3.7.1. Profit Margin Analysis 3.7.2. Wholesalers and Distributors 3.7.3. Retailers 3.8. PESTLE and Porter’s Analysis 3.9. Regulatory Landscape 3.9.1. By Key Regions 3.9.2. By Key Countries 3.10. Regional Parent Market Outlook 3.11. Production and Consumption Statistics 3.12. Import and Export Statistics 4. Global Market Analysis 2017 to 2022 and Forecast, 2023 to 2033 4.1. Historical Market Size Value (US$ Million) & Volume (Tons) Analysis, 2017 to 2022 4.2. Current and Future Market Size Value (US$ Million) & Volume (Tons) Projections, 2023 to 2033 4.2.1. Y-o-Y Growth Trend Analysis 4.2.2. Absolute $ Opportunity Analysis 5. Global Market Analysis 2017 to 2022 and Forecast 2023 to 2033, By Capacity 5.1. Introduction / Key Findings 5.2. Historical Market Size Value (US$ Million) & Volume (Tons) Analysis By Capacity, 2017 to 2022 5.3. Current and Future Market Size Value (US$ Million) & Volume (Tons) Analysis and Forecast By Capacity, 2023 to 2033 5.3.1. Up to 50 ml 5.3.2. 50 ml to 200 ml 5.3.3. 200 ml to 400 ml 5.3.4. 400 ml & Above 5.4. Y-o-Y Growth Trend Analysis By Capacity, 2017 to 2022 5.5. Absolute $ Opportunity Analysis By Capacity, 2023 to 2033 6. Global Market Analysis 2017 to 2022 and Forecast 2023 to 2033, By Product Type 6.1. Introduction / Key Findings 6.2. Historical Market Size Value (US$ Million) & Volume (Tons) Analysis By Product Type, 2017 to 2022 6.3. Current and Future Market Size Value (US$ Million) & Volume (Tons) Analysis and Forecast By Product Type, 2023 to 2033 6.3.1. Compartmental 6.3.2. Non-compartmental 6.4. Y-o-Y Growth Trend Analysis By Product Type, 2017 to 2022 6.5. Absolute $ Opportunity Analysis By Product Type, 2023 to 2033 7. Global Market Analysis 2017 to 2022 and Forecast 2023 to 2033, By Aluminum Foil Type 7.1. Introduction / Key Findings 7.2. Historical Market Size Value (US$ Million) & Volume (Tons) Analysis By Aluminum Foil Type, 2017 to 2022 7.3. Current and Future Market Size Value (US$ Million) & Volume (Tons) Analysis and Forecast By Aluminum Foil Type, 2023 to 2033 7.3.1. Standard Duty Foil 7.3.2. Heavy Duty Foil 7.4. Y-o-Y Growth Trend Analysis By Aluminum Foil Type, 2017 to 2022 7.5. Absolute $ Opportunity Analysis By Aluminum Foil Type, 2023 to 2033 8. Global Market Analysis 2017 to 2022 and Forecast 2023 to 2033, By End Use 8.1. Introduction / Key Findings 8.2. Historical Market Size Value (US$ Million) & Volume (Tons) Analysis By End Use, 2017 to 2022 8.3. Current and Future Market Size Value (US$ Million) & Volume (Tons) Analysis and Forecast By End Use, 2023 to 2033 8.3.1. Foodservice 8.3.2. Bakery & Confectionery 8.3.3. Food Packer/Processor 8.3.4. Retail & Supermarket 8.3.5. Others 8.4. Y-o-Y Growth Trend Analysis By End Use, 2017 to 2022 8.5. Absolute $ Opportunity Analysis By End Use, 2023 to 2033 9. Global Market Analysis 2017 to 2022 and Forecast 2023 to 2033, By Region 9.1. Introduction 9.2. Historical Market Size Value (US$ Million) & Volume (Tons) Analysis By Region, 2017 to 2022 9.3. Current Market Size Value (US$ Million) & Volume (Tons) Analysis and Forecast By Region, 2023 to 2033 9.3.1. North America 9.3.2. Latin America 9.3.3. Europe 9.3.4. Asia Pacific Excluding Japan 9.3.5. Japan 9.3.6. Middle East and Africa 9.4. Market Attractiveness Analysis By Region 10. North America Market Analysis 2017 to 2022 and Forecast 2023 to 2033, By Country 10.1. Historical Market Size Value (US$ Million) & Volume (Tons) Trend Analysis By Market Taxonomy, 2017 to 2022 10.2. Market Size Value (US$ Million) & Volume (Tons) Forecast By Market Taxonomy, 2023 to 2033 10.2.1. By Country 10.2.1.1. The USA 10.2.1.2. Canada 10.2.2. By Capacity 10.2.3. By Product Type 10.2.4. By Aluminum Foil Type 10.2.5. By End Use 10.3. Market Attractiveness Analysis 10.3.1. By Country 10.3.2. By Capacity 10.3.3. By Product Type 10.3.4. By Aluminum Foil Type 10.3.5. By End Use 10.4. Key Takeaways 11. Latin America Market Analysis 2017 to 2022 and Forecast 2023 to 2033, By Country 11.1. Historical Market Size Value (US$ Million) & Volume (Tons) Trend Analysis By Market Taxonomy, 2017 to 2022 11.2. Market Size Value (US$ Million) & Volume (Tons) Forecast By Market Taxonomy, 2023 to 2033 11.2.1. By Country 11.2.1.1. Brazil 11.2.1.2. Mexico 11.2.1.3. Rest of Latin America 11.2.2. By Capacity 11.2.3. By Product Type 11.2.4. By Aluminum Foil Type 11.2.5. By End Use 11.3. Market Attractiveness Analysis 11.3.1. By Country 11.3.2. By Capacity 11.3.3. By Product Type 11.3.4. By Aluminum Foil Type 11.3.5. By End Use 11.4. Key Takeaways 12. Europe Market Analysis 2017 to 2022 and Forecast 2023 to 2033, By Country 12.1. Historical Market Size Value (US$ Million) & Volume (Tons) Trend Analysis By Market Taxonomy, 2017 to 2022 12.2. Market Size Value (US$ Million) & Volume (Tons) Forecast By Market Taxonomy, 2023 to 2033 12.2.1. By Country 12.2.1.1. Germany 12.2.1.2. United Kingdom 12.2.1.3. Spain 12.2.1.4. France 12.2.1.5. Russia 12.2.1.6. Rest Of Europe 12.2.2. By Capacity 12.2.3. By Product Type 12.2.4. By Aluminum Foil Type 12.2.5. By End Use 12.3. Market Attractiveness Analysis 12.3.1. By Country 12.3.2. By Capacity 12.3.3. By Product Type 12.3.4. By Aluminum Foil Type 12.3.5. By End Use 12.4. Key Takeaways 13. Asia Pacific Excluding Japan Market Analysis 2017 to 2022 and Forecast 2023 to 2033, By Country 13.1. Historical Market Size Value (US$ Million) & Volume (Tons) Trend Analysis By Market Taxonomy, 2017 to 2022 13.2. Market Size Value (US$ Million) & Volume (Tons) Forecast By Market Taxonomy, 2023 to 2033 13.2.1. By Country 13.2.1.1. China 13.2.1.2. India 13.2.1.3. ASEAN Countries 13.2.1.4. Australia & New Zealand 13.2.1.5. Rest of Asia Pacific Excluding Japan 13.2.2. By Capacity 13.2.3. By Product Type 13.2.4. By Aluminum Foil Type 13.2.5. By End Use 13.3. Market Attractiveness Analysis 13.3.1. By Country 13.3.2. By Capacity 13.3.3. By Product Type 13.3.4. By Aluminum Foil Type 13.3.5. By End Use 13.4. Key Takeaways 14. Japan Market Analysis 2017 to 2022 and Forecast 2023 to 2033, By Country 14.1. Historical Market Size Value (US$ Million) & Volume (Tons) Trend Analysis By Market Taxonomy, 2017 to 2022 14.2. Market Size Value (US$ Million) & Volume (Tons) Forecast By Market Taxonomy, 2023 to 2033 14.2.1. By Country 14.2.2. By Capacity 14.2.3. By Product Type 14.2.4. By Aluminum Foil Type 14.2.5. By End Use 14.3. Market Attractiveness Analysis 14.3.1. By Country 14.3.2. By Capacity 14.3.3. By Product Type 14.3.4. By Aluminum Foil Type 14.3.5. By End Use 14.4. Key Takeaways 15. Middle East and Africa Market Analysis 2017 to 2022 and Forecast 2023 to 2033, By Country 15.1. Historical Market Size Value (US$ Million) & Volume (Tons) Trend Analysis By Market Taxonomy, 2017 to 2022 15.2. Market Size Value (US$ Million) & Volume (Tons) Forecast By Market Taxonomy, 2023 to 2033 15.2.1. By Country 15.2.1.1. GCC Countries 15.2.1.2. Northern Africa 15.2.1.3. South Africa 15.2.1.4. Rest of Middle East and Africa 15.2.2. By Capacity 15.2.3. By Product Type 15.2.4. By Aluminum Foil Type 15.2.5. By End Use 15.3. Market Attractiveness Analysis 15.3.1. By Country 15.3.2. By Capacity 15.3.3. By Product Type 15.3.4. By Aluminum Foil Type 15.3.5. By End Use 15.4. Key Takeaways 16. Key Countries Market Analysis 16.1. USA 16.1.1. Pricing Analysis 16.1.2. Market Share Analysis, 2022 16.1.2.1. By Capacity 16.1.2.2. By Product Type 16.1.2.3. By Aluminum Foil Type 16.1.2.4. By End Use 16.2. Canada 16.2.1. Pricing Analysis 16.2.2. Market Share Analysis, 2022 16.2.2.1. By Capacity 16.2.2.2. By Product Type 16.2.2.3. By Aluminum Foil Type 16.2.2.4. By End Use 16.3. Brazil 16.3.1. Pricing Analysis 16.3.2. Market Share Analysis, 2022 16.3.2.1. By Capacity 16.3.2.2. By Product Type 16.3.2.3. By Aluminum Foil Type 16.3.2.4. By End Use 16.4. Mexico 16.4.1. Pricing Analysis 16.4.2. Market Share Analysis, 2022 16.4.2.1. By Capacity 16.4.2.2. By Product Type 16.4.2.3. By Aluminum Foil Type 16.4.2.4. By End Use 16.5. Germany 16.5.1. Pricing Analysis 16.5.2. Market Share Analysis, 2022 16.5.2.1. By Capacity 16.5.2.2. By Product Type 16.5.2.3. By Aluminum Foil Type 16.5.2.4. By End Use 16.6. United Kingdom 16.6.1. Pricing Analysis 16.6.2. Market Share Analysis, 2022 16.6.2.1. By Capacity 16.6.2.2. By Product Type 16.6.2.3. By Aluminum Foil Type 16.6.2.4. By End Use 16.7. Spain 16.7.1. Pricing Analysis 16.7.2. Market Share Analysis, 2022 16.7.2.1. By Capacity 16.7.2.2. By Product Type 16.7.2.3. By Aluminum Foil Type 16.7.2.4. By End Use 16.8. France 16.8.1. Pricing Analysis 16.8.2. Market Share Analysis, 2022 16.8.2.1. By Capacity 16.8.2.2. By Product Type 16.8.2.3. By Aluminum Foil Type 16.8.2.4. By End Use 16.9. Russia 16.9.1. Pricing Analysis 16.9.2. Market Share Analysis, 2022 16.9.2.1. By Capacity 16.9.2.2. By Product Type 16.9.2.3. By Aluminum Foil Type 16.9.2.4. By End Use 16.10. China 16.10.1. Pricing Analysis 16.10.2. Market Share Analysis, 2022 16.10.2.1. By Capacity 16.10.2.2. By Product Type 16.10.2.3. By Aluminum Foil Type 16.10.2.4. By End Use 16.11. India 16.11.1. Pricing Analysis 16.11.2. Market Share Analysis, 2022 16.11.2.1. By Capacity 16.11.2.2. By Product Type 16.11.2.3. By Aluminum Foil Type 16.11.2.4. By End Use 16.12. ASEAN Countries 16.12.1. Pricing Analysis 16.12.2. Market Share Analysis, 2022 16.12.2.1. By Capacity 16.12.2.2. By Product Type 16.12.2.3. By Aluminum Foil Type 16.12.2.4. By End Use 16.13. Australia & New Zealand 16.13.1. Pricing Analysis 16.13.2. Market Share Analysis, 2022 16.13.2.1. By Capacity 16.13.2.2. By Product Type 16.13.2.3. By Aluminum Foil Type 16.13.2.4. By End Use 16.14. Japan 16.14.1. Pricing Analysis 16.14.2. Market Share Analysis, 2022 16.14.2.1. By Capacity 16.14.2.2. By Product Type 16.14.2.3. By Aluminum Foil Type 16.14.2.4. By End Use 16.15. GCC Countries 16.15.1. Pricing Analysis 16.15.2. Market Share Analysis, 2022 16.15.2.1. By Capacity 16.15.2.2. By Product Type 16.15.2.3. By Aluminum Foil Type 16.15.2.4. By End Use 16.16. Northern Africa 16.16.1. Pricing Analysis 16.16.2. Market Share Analysis, 2022 16.16.2.1. By Capacity 16.16.2.2. By Product Type 16.16.2.3. By Aluminum Foil Type 16.16.2.4. By End Use 16.17. South Africa 16.17.1. Pricing Analysis 16.17.2. Market Share Analysis, 2022 16.17.2.1. By Capacity 16.17.2.2. By Product Type 16.17.2.3. By Aluminum Foil Type 16.17.2.4. By End Use 17. Market Structure Analysis 17.1. Competition Dashboard 17.2. Competition Benchmarking 17.3. Market Share Analysis of Top Players 17.3.1. By Regional 17.3.2. By Capacity 17.3.3. By Product Type 17.3.4. By Aluminum Foil Type 17.3.5. By End Use 18. Competition Analysis 18.1. Competition Deep Dive 18.1.1. Pactiv LLC 18.1.1.1. Overview 18.1.1.2. Product Portfolio 18.1.1.3. Profitability by Market Segments 18.1.1.4. Sales Footprint 18.1.1.5. Strategy Overview 18.1.1.5.1. Marketing Strategy 18.1.1.5.2. Product Strategy 18.1.1.5.3. Channel Strategy 18.1.2. Eurofoil Luxembourg S.A. 18.1.2.1. Overview 18.1.2.2. Product Portfolio 18.1.2.3. Profitability by Market Segments 18.1.2.4. Sales Footprint 18.1.2.5. Strategy Overview 18.1.2.5.1. Marketing Strategy 18.1.2.5.2. Product Strategy 18.1.2.5.3. Channel Strategy 18.1.3. Novelis Inc 18.1.3.1. Overview 18.1.3.2. Product Portfolio 18.1.3.3. Profitability by Market Segments 18.1.3.4. Sales Footprint 18.1.3.5. Strategy Overview 18.1.3.5.1. Marketing Strategy 18.1.3.5.2. Product Strategy 18.1.3.5.3. Channel Strategy 18.1.4. Penny Plate, LLC 18.1.4.1. Overview 18.1.4.2. Product Portfolio 18.1.4.3. Profitability by Market Segments 18.1.4.4. Sales Footprint 18.1.4.5. Strategy Overview 18.1.4.5.1. Marketing Strategy 18.1.4.5.2. Product Strategy 18.1.4.5.3. Channel Strategy 18.1.5. Nicholl Food Packaging Limited 18.1.5.1. Overview 18.1.5.2. Product Portfolio 18.1.5.3. Profitability by Market Segments 18.1.5.4. Sales Footprint 18.1.5.5. Strategy Overview 18.1.5.5.1. Marketing Strategy 18.1.5.5.2. Product Strategy 18.1.5.5.3. Channel Strategy 18.1.6. Alufoil Products Pvt. Ltd 18.1.6.1. Overview 18.1.6.2. Product Portfolio 18.1.6.3. Profitability by Market Segments 18.1.6.4. Sales Footprint 18.1.6.5. Strategy Overview 18.1.6.5.1. Marketing Strategy 18.1.6.5.2. Product Strategy 18.1.6.5.3. Channel Strategy 18.1.7. Trinidad Benham Corporation 18.1.7.1. Overview 18.1.7.2. Product Portfolio 18.1.7.3. Profitability by Market Segments 18.1.7.4. Sales Footprint 18.1.7.5. Strategy Overview 18.1.7.5.1. Marketing Strategy 18.1.7.5.2. Product Strategy 18.1.7.5.3. Channel Strategy 18.1.8. Hulamin Containers Ltd. 18.1.8.1. Overview 18.1.8.2. Product Portfolio 18.1.8.3. Profitability by Market Segments 18.1.8.4. Sales Footprint 18.1.8.5. Strategy Overview 18.1.8.5.1. Marketing Strategy 18.1.8.5.2. Product Strategy 18.1.8.5.3. Channel Strategy 18.1.9. D&W Fine Pack LLC 18.1.9.1. Overview 18.1.9.2. Product Portfolio 18.1.9.3. Profitability by Market Segments 18.1.9.4. Sales Footprint 18.1.9.5. Strategy Overview 18.1.9.5.1. Marketing Strategy 18.1.9.5.2. Product Strategy 18.1.9.5.3. Channel Strategy 18.1.10. Handi-foil of America, Inc 18.1.10.1. Overview 18.1.10.2. Product Portfolio 18.1.10.3. Profitability by Market Segments 18.1.10.4. Sales Footprint 18.1.10.5. Strategy Overview 18.1.10.5.1. Marketing Strategy 18.1.10.5.2. Product Strategy 18.1.10.5.3. Channel Strategy 18.1.11. Revere Packaging, Inc. 18.1.11.1. Overview 18.1.11.2. Product Portfolio 18.1.11.3. Profitability by Market Segments 18.1.11.4. Sales Footprint 18.1.11.5. Strategy Overview 18.1.11.5.1. Marketing Strategy 18.1.11.5.2. Product Strategy 18.1.11.5.3. Channel Strategy 18.1.12. Contital srL 18.1.12.1. Overview 18.1.12.2. Product Portfolio 18.1.12.3. Profitability by Market Segments 18.1.12.4. Sales Footprint 18.1.12.5. Strategy Overview 18.1.12.5.1. Marketing Strategy 18.1.12.5.2. Product Strategy 18.1.12.5.3. Channel Strategy 18.1.13. i2r Packaging Solutions Limited 18.1.13.1. Overview 18.1.13.2. Product Portfolio 18.1.13.3. Profitability by Market Segments 18.1.13.4. Sales Footprint 18.1.13.5. Strategy Overview 18.1.13.5.1. Marketing Strategy 18.1.13.5.2. Product Strategy 18.1.13.5.3. Channel Strategy 18.1.14. Wyda Packaging 18.1.14.1. Overview 18.1.14.2. Product Portfolio 18.1.14.3. Profitability by Market Segments 18.1.14.4. Sales Footprint 18.1.14.5. Strategy Overview 18.1.14.5.1. Marketing Strategy 18.1.14.5.2. Product Strategy 18.1.14.5.3. Channel Strategy 19. Assumptions & Acronyms Used 20. Research Methodology
Don't pay for what you don't need
Customize your report by selecting specific countries or regions and save 30%!
Table 1: Global Market Value (US$ Million) Forecast by Region, 2017 to 2033 Table 2: Global Market Volume (Tons) Forecast by Region, 2017 to 2033 Table 3: Global Market Value (US$ Million) Forecast by Capacity, 2017 to 2033 Table 4: Global Market Volume (Tons) Forecast by Capacity, 2017 to 2033 Table 5: Global Market Value (US$ Million) Forecast by Product Type, 2017 to 2033 Table 6: Global Market Volume (Tons) Forecast by Product Type, 2017 to 2033 Table 7: Global Market Value (US$ Million) Forecast by Aluminum Foil Type, 2017 to 2033 Table 8: Global Market Volume (Tons) Forecast by Aluminum Foil Type, 2017 to 2033 Table 9: Global Market Value (US$ Million) Forecast by End Use, 2017 to 2033 Table 10: Global Market Volume (Tons) Forecast by End Use, 2017 to 2033 Table 11: North America Market Value (US$ Million) Forecast by Country, 2017 to 2033 Table 12: North America Market Volume (Tons) Forecast by Country, 2017 to 2033 Table 13: North America Market Value (US$ Million) Forecast by Capacity, 2017 to 2033 Table 14: North America Market Volume (Tons) Forecast by Capacity, 2017 to 2033 Table 15: North America Market Value (US$ Million) Forecast by Product Type, 2017 to 2033 Table 16: North America Market Volume (Tons) Forecast by Product Type, 2017 to 2033 Table 17: North America Market Value (US$ Million) Forecast by Aluminum Foil Type, 2017 to 2033 Table 18: North America Market Volume (Tons) Forecast by Aluminum Foil Type, 2017 to 2033 Table 19: North America Market Value (US$ Million) Forecast by End Use, 2017 to 2033 Table 20: North America Market Volume (Tons) Forecast by End Use, 2017 to 2033 Table 21: Latin America Market Value (US$ Million) Forecast by Country, 2017 to 2033 Table 22: Latin America Market Volume (Tons) Forecast by Country, 2017 to 2033 Table 23: Latin America Market Value (US$ Million) Forecast by Capacity, 2017 to 2033 Table 24: Latin America Market Volume (Tons) Forecast by Capacity, 2017 to 2033 Table 25: Latin America Market Value (US$ Million) Forecast by Product Type, 2017 to 2033 Table 26: Latin America Market Volume (Tons) Forecast by Product Type, 2017 to 2033 Table 27: Latin America Market Value (US$ Million) Forecast by Aluminum Foil Type, 2017 to 2033 Table 28: Latin America Market Volume (Tons) Forecast by Aluminum Foil Type, 2017 to 2033 Table 29: Latin America Market Value (US$ Million) Forecast by End Use, 2017 to 2033 Table 30: Latin America Market Volume (Tons) Forecast by End Use, 2017 to 2033 Table 31: Europe Market Value (US$ Million) Forecast by Country, 2017 to 2033 Table 32: Europe Market Volume (Tons) Forecast by Country, 2017 to 2033 Table 33: Europe Market Value (US$ Million) Forecast by Capacity, 2017 to 2033 Table 34: Europe Market Volume (Tons) Forecast by Capacity, 2017 to 2033 Table 35: Europe Market Value (US$ Million) Forecast by Product Type, 2017 to 2033 Table 36: Europe Market Volume (Tons) Forecast by Product Type, 2017 to 2033 Table 37: Europe Market Value (US$ Million) Forecast by Aluminum Foil Type, 2017 to 2033 Table 38: Europe Market Volume (Tons) Forecast by Aluminum Foil Type, 2017 to 2033 Table 39: Europe Market Value (US$ Million) Forecast by End Use, 2017 to 2033 Table 40: Europe Market Volume (Tons) Forecast by End Use, 2017 to 2033 Table 41: Asia Pacific Excluding Japan Market Value (US$ Million) Forecast by Country, 2017 to 2033 Table 42: Asia Pacific Excluding Japan Market Volume (Tons) Forecast by Country, 2017 to 2033 Table 43: Asia Pacific Excluding Japan Market Value (US$ Million) Forecast by Capacity, 2017 to 2033 Table 44: Asia Pacific Excluding Japan Market Volume (Tons) Forecast by Capacity, 2017 to 2033 Table 45: Asia Pacific Excluding Japan Market Value (US$ Million) Forecast by Product Type, 2017 to 2033 Table 46: Asia Pacific Excluding Japan Market Volume (Tons) Forecast by Product Type, 2017 to 2033 Table 47: Asia Pacific Excluding Japan Market Value (US$ Million) Forecast by Aluminum Foil Type, 2017 to 2033 Table 48: Asia Pacific Excluding Japan Market Volume (Tons) Forecast by Aluminum Foil Type, 2017 to 2033 Table 49: Asia Pacific Excluding Japan Market Value (US$ Million) Forecast by End Use, 2017 to 2033 Table 50: Asia Pacific Excluding Japan Market Volume (Tons) Forecast by End Use, 2017 to 2033 Table 51: Japan Market Value (US$ Million) Forecast by Country, 2017 to 2033 Table 52: Japan Market Volume (Tons) Forecast by Country, 2017 to 2033 Table 53: Japan Market Value (US$ Million) Forecast by Capacity, 2017 to 2033 Table 54: Japan Market Volume (Tons) Forecast by Capacity, 2017 to 2033 Table 55: Japan Market Value (US$ Million) Forecast by Product Type, 2017 to 2033 Table 56: Japan Market Volume (Tons) Forecast by Product Type, 2017 to 2033 Table 57: Japan Market Value (US$ Million) Forecast by Aluminum Foil Type, 2017 to 2033 Table 58: Japan Market Volume (Tons) Forecast by Aluminum Foil Type, 2017 to 2033 Table 59: Japan Market Value (US$ Million) Forecast by End Use, 2017 to 2033 Table 60: Japan Market Volume (Tons) Forecast by End Use, 2017 to 2033 Table 61: Middle East and Africa Market Value (US$ Million) Forecast by Country, 2017 to 2033 Table 62: Middle East and Africa Market Volume (Tons) Forecast by Country, 2017 to 2033 Table 63: Middle East and Africa Market Value (US$ Million) Forecast by Capacity, 2017 to 2033 Table 64: Middle East and Africa Market Volume (Tons) Forecast by Capacity, 2017 to 2033 Table 65: Middle East and Africa Market Value (US$ Million) Forecast by Product Type, 2017 to 2033 Table 66: Middle East and Africa Market Volume (Tons) Forecast by Product Type, 2017 to 2033 Table 67: Middle East and Africa Market Value (US$ Million) Forecast by Aluminum Foil Type, 2017 to 2033 Table 68: Middle East and Africa Market Volume (Tons) Forecast by Aluminum Foil Type, 2017 to 2033 Table 69: Middle East and Africa Market Value (US$ Million) Forecast by End Use, 2017 to 2033 Table 70: Middle East and Africa Market Volume (Tons) Forecast by End Use, 2017 to 2033
Figure 1: Global Market Value (US$ Million) by Capacity, 2023 to 2033 Figure 2: Global Market Value (US$ Million) by Product Type, 2023 to 2033 Figure 3: Global Market Value (US$ Million) by Aluminum Foil Type, 2023 to 2033 Figure 4: Global Market Value (US$ Million) by End Use, 2023 to 2033 Figure 5: Global Market Value (US$ Million) by Region, 2023 to 2033 Figure 6: Global Market Value (US$ Million) Analysis by Region, 2017 to 2033 Figure 7: Global Market Volume (Tons) Analysis by Region, 2017 to 2033 Figure 8: Global Market Value Share (%) and BPS Analysis by Region, 2023 to 2033 Figure 9: Global Market Y-o-Y Growth (%) Projections by Region, 2023 to 2033 Figure 10: Global Market Value (US$ Million) Analysis by Capacity, 2017 to 2033 Figure 11: Global Market Volume (Tons) Analysis by Capacity, 2017 to 2033 Figure 12: Global Market Value Share (%) and BPS Analysis by Capacity, 2023 to 2033 Figure 13: Global Market Y-o-Y Growth (%) Projections by Capacity, 2023 to 2033 Figure 14: Global Market Value (US$ Million) Analysis by Product Type, 2017 to 2033 Figure 15: Global Market Volume (Tons) Analysis by Product Type, 2017 to 2033 Figure 16: Global Market Value Share (%) and BPS Analysis by Product Type, 2023 to 2033 Figure 17: Global Market Y-o-Y Growth (%) Projections by Product Type, 2023 to 2033 Figure 18: Global Market Value (US$ Million) Analysis by Aluminum Foil Type, 2017 to 2033 Figure 19: Global Market Volume (Tons) Analysis by Aluminum Foil Type, 2017 to 2033 Figure 20: Global Market Value Share (%) and BPS Analysis by Aluminum Foil Type, 2023 to 2033 Figure 21: Global Market Y-o-Y Growth (%) Projections by Aluminum Foil Type, 2023 to 2033 Figure 22: Global Market Value (US$ Million) Analysis by End Use, 2017 to 2033 Figure 23: Global Market Volume (Tons) Analysis by End Use, 2017 to 2033 Figure 24: Global Market Value Share (%) and BPS Analysis by End Use, 2023 to 2033 Figure 25: Global Market Y-o-Y Growth (%) Projections by End Use, 2023 to 2033 Figure 26: Global Market Attractiveness by Capacity, 2023 to 2033 Figure 27: Global Market Attractiveness by Product Type, 2023 to 2033 Figure 28: Global Market Attractiveness by Aluminum Foil Type, 2023 to 2033 Figure 29: Global Market Attractiveness by End Use, 2023 to 2033 Figure 30: Global Market Attractiveness by Region, 2023 to 2033 Figure 31: North America Market Value (US$ Million) by Capacity, 2023 to 2033 Figure 32: North America Market Value (US$ Million) by Product Type, 2023 to 2033 Figure 33: North America Market Value (US$ Million) by Aluminum Foil Type, 2023 to 2033 Figure 34: North America Market Value (US$ Million) by End Use, 2023 to 2033 Figure 35: North America Market Value (US$ Million) by Country, 2023 to 2033 Figure 36: North America Market Value (US$ Million) Analysis by Country, 2017 to 2033 Figure 37: North America Market Volume (Tons) Analysis by Country, 2017 to 2033 Figure 38: North America Market Value Share (%) and BPS Analysis by Country, 2023 to 2033 Figure 39: North America Market Y-o-Y Growth (%) Projections by Country, 2023 to 2033 Figure 40: North America Market Value (US$ Million) Analysis by Capacity, 2017 to 2033 Figure 41: North America Market Volume (Tons) Analysis by Capacity, 2017 to 2033 Figure 42: North America Market Value Share (%) and BPS Analysis by Capacity, 2023 to 2033 Figure 43: North America Market Y-o-Y Growth (%) Projections by Capacity, 2023 to 2033 Figure 44: North America Market Value (US$ Million) Analysis by Product Type, 2017 to 2033 Figure 45: North America Market Volume (Tons) Analysis by Product Type, 2017 to 2033 Figure 46: North America Market Value Share (%) and BPS Analysis by Product Type, 2023 to 2033 Figure 47: North America Market Y-o-Y Growth (%) Projections by Product Type, 2023 to 2033 Figure 48: North America Market Value (US$ Million) Analysis by Aluminum Foil Type, 2017 to 2033 Figure 49: North America Market Volume (Tons) Analysis by Aluminum Foil Type, 2017 to 2033 Figure 50: North America Market Value Share (%) and BPS Analysis by Aluminum Foil Type, 2023 to 2033 Figure 51: North America Market Y-o-Y Growth (%) Projections by Aluminum Foil Type, 2023 to 2033 Figure 52: North America Market Value (US$ Million) Analysis by End Use, 2017 to 2033 Figure 53: North America Market Volume (Tons) Analysis by End Use, 2017 to 2033 Figure 54: North America Market Value Share (%) and BPS Analysis by End Use, 2023 to 2033 Figure 55: North America Market Y-o-Y Growth (%) Projections by End Use, 2023 to 2033 Figure 56: North America Market Attractiveness by Capacity, 2023 to 2033 Figure 57: North America Market Attractiveness by Product Type, 2023 to 2033 Figure 58: North America Market Attractiveness by Aluminum Foil Type, 2023 to 2033 Figure 59: North America Market Attractiveness by End Use, 2023 to 2033 Figure 60: North America Market Attractiveness by Country, 2023 to 2033 Figure 61: Latin America Market Value (US$ Million) by Capacity, 2023 to 2033 Figure 62: Latin America Market Value (US$ Million) by Product Type, 2023 to 2033 Figure 63: Latin America Market Value (US$ Million) by Aluminum Foil Type, 2023 to 2033 Figure 64: Latin America Market Value (US$ Million) by End Use, 2023 to 2033 Figure 65: Latin America Market Value (US$ Million) by Country, 2023 to 2033 Figure 66: Latin America Market Value (US$ Million) Analysis by Country, 2017 to 2033 Figure 67: Latin America Market Volume (Tons) Analysis by Country, 2017 to 2033 Figure 68: Latin America Market Value Share (%) and BPS Analysis by Country, 2023 to 2033 Figure 69: Latin America Market Y-o-Y Growth (%) Projections by Country, 2023 to 2033 Figure 70: Latin America Market Value (US$ Million) Analysis by Capacity, 2017 to 2033 Figure 71: Latin America Market Volume (Tons) Analysis by Capacity, 2017 to 2033 Figure 72: Latin America Market Value Share (%) and BPS Analysis by Capacity, 2023 to 2033 Figure 73: Latin America Market Y-o-Y Growth (%) Projections by Capacity, 2023 to 2033 Figure 74: Latin America Market Value (US$ Million) Analysis by Product Type, 2017 to 2033 Figure 75: Latin America Market Volume (Tons) Analysis by Product Type, 2017 to 2033 Figure 76: Latin America Market Value Share (%) and BPS Analysis by Product Type, 2023 to 2033 Figure 77: Latin America Market Y-o-Y Growth (%) Projections by Product Type, 2023 to 2033 Figure 78: Latin America Market Value (US$ Million) Analysis by Aluminum Foil Type, 2017 to 2033 Figure 79: Latin America Market Volume (Tons) Analysis by Aluminum Foil Type, 2017 to 2033 Figure 80: Latin America Market Value Share (%) and BPS Analysis by Aluminum Foil Type, 2023 to 2033 Figure 81: Latin America Market Y-o-Y Growth (%) Projections by Aluminum Foil Type, 2023 to 2033 Figure 82: Latin America Market Value (US$ Million) Analysis by End Use, 2017 to 2033 Figure 83: Latin America Market Volume (Tons) Analysis by End Use, 2017 to 2033 Figure 84: Latin America Market Value Share (%) and BPS Analysis by End Use, 2023 to 2033 Figure 85: Latin America Market Y-o-Y Growth (%) Projections by End Use, 2023 to 2033 Figure 86: Latin America Market Attractiveness by Capacity, 2023 to 2033 Figure 87: Latin America Market Attractiveness by Product Type, 2023 to 2033 Figure 88: Latin America Market Attractiveness by Aluminum Foil Type, 2023 to 2033 Figure 89: Latin America Market Attractiveness by End Use, 2023 to 2033 Figure 90: Latin America Market Attractiveness by Country, 2023 to 2033 Figure 91: Europe Market Value (US$ Million) by Capacity, 2023 to 2033 Figure 92: Europe Market Value (US$ Million) by Product Type, 2023 to 2033 Figure 93: Europe Market Value (US$ Million) by Aluminum Foil Type, 2023 to 2033 Figure 94: Europe Market Value (US$ Million) by End Use, 2023 to 2033 Figure 95: Europe Market Value (US$ Million) by Country, 2023 to 2033 Figure 96: Europe Market Value (US$ Million) Analysis by Country, 2017 to 2033 Figure 97: Europe Market Volume (Tons) Analysis by Country, 2017 to 2033 Figure 98: Europe Market Value Share (%) and BPS Analysis by Country, 2023 to 2033 Figure 99: Europe Market Y-o-Y Growth (%) Projections by Country, 2023 to 2033 Figure 100: Europe Market Value (US$ Million) Analysis by Capacity, 2017 to 2033 Figure 101: Europe Market Volume (Tons) Analysis by Capacity, 2017 to 2033 Figure 102: Europe Market Value Share (%) and BPS Analysis by Capacity, 2023 to 2033 Figure 103: Europe Market Y-o-Y Growth (%) Projections by Capacity, 2023 to 2033 Figure 104: Europe Market Value (US$ Million) Analysis by Product Type, 2017 to 2033 Figure 105: Europe Market Volume (Tons) Analysis by Product Type, 2017 to 2033 Figure 106: Europe Market Value Share (%) and BPS Analysis by Product Type, 2023 to 2033 Figure 107: Europe Market Y-o-Y Growth (%) Projections by Product Type, 2023 to 2033 Figure 108: Europe Market Value (US$ Million) Analysis by Aluminum Foil Type, 2017 to 2033 Figure 109: Europe Market Volume (Tons) Analysis by Aluminum Foil Type, 2017 to 2033 Figure 110: Europe Market Value Share (%) and BPS Analysis by Aluminum Foil Type, 2023 to 2033 Figure 111: Europe Market Y-o-Y Growth (%) Projections by Aluminum Foil Type, 2023 to 2033 Figure 112: Europe Market Value (US$ Million) Analysis by End Use, 2017 to 2033 Figure 113: Europe Market Volume (Tons) Analysis by End Use, 2017 to 2033 Figure 114: Europe Market Value Share (%) and BPS Analysis by End Use, 2023 to 2033 Figure 115: Europe Market Y-o-Y Growth (%) Projections by End Use, 2023 to 2033 Figure 116: Europe Market Attractiveness by Capacity, 2023 to 2033 Figure 117: Europe Market Attractiveness by Product Type, 2023 to 2033 Figure 118: Europe Market Attractiveness by Aluminum Foil Type, 2023 to 2033 Figure 119: Europe Market Attractiveness by End Use, 2023 to 2033 Figure 120: Europe Market Attractiveness by Country, 2023 to 2033 Figure 121: Asia Pacific Excluding Japan Market Value (US$ Million) by Capacity, 2023 to 2033 Figure 122: Asia Pacific Excluding Japan Market Value (US$ Million) by Product Type, 2023 to 2033 Figure 123: Asia Pacific Excluding Japan Market Value (US$ Million) by Aluminum Foil Type, 2023 to 2033 Figure 124: Asia Pacific Excluding Japan Market Value (US$ Million) by End Use, 2023 to 2033 Figure 125: Asia Pacific Excluding Japan Market Value (US$ Million) by Country, 2023 to 2033 Figure 126: Asia Pacific Excluding Japan Market Value (US$ Million) Analysis by Country, 2017 to 2033 Figure 127: Asia Pacific Excluding Japan Market Volume (Tons) Analysis by Country, 2017 to 2033 Figure 128: Asia Pacific Excluding Japan Market Value Share (%) and BPS Analysis by Country, 2023 to 2033 Figure 129: Asia Pacific Excluding Japan Market Y-o-Y Growth (%) Projections by Country, 2023 to 2033 Figure 130: Asia Pacific Excluding Japan Market Value (US$ Million) Analysis by Capacity, 2017 to 2033 Figure 131: Asia Pacific Excluding Japan Market Volume (Tons) Analysis by Capacity, 2017 to 2033 Figure 132: Asia Pacific Excluding Japan Market Value Share (%) and BPS Analysis by Capacity, 2023 to 2033 Figure 133: Asia Pacific Excluding Japan Market Y-o-Y Growth (%) Projections by Capacity, 2023 to 2033 Figure 134: Asia Pacific Excluding Japan Market Value (US$ Million) Analysis by Product Type, 2017 to 2033 Figure 135: Asia Pacific Excluding Japan Market Volume (Tons) Analysis by Product Type, 2017 to 2033 Figure 136: Asia Pacific Excluding Japan Market Value Share (%) and BPS Analysis by Product Type, 2023 to 2033 Figure 137: Asia Pacific Excluding Japan Market Y-o-Y Growth (%) Projections by Product Type, 2023 to 2033 Figure 138: Asia Pacific Excluding Japan Market Value (US$ Million) Analysis by Aluminum Foil Type, 2017 to 2033 Figure 139: Asia Pacific Excluding Japan Market Volume (Tons) Analysis by Aluminum Foil Type, 2017 to 2033 Figure 140: Asia Pacific Excluding Japan Market Value Share (%) and BPS Analysis by Aluminum Foil Type, 2023 to 2033 Figure 141: Asia Pacific Excluding Japan Market Y-o-Y Growth (%) Projections by Aluminum Foil Type, 2023 to 2033 Figure 142: Asia Pacific Excluding Japan Market Value (US$ Million) Analysis by End Use, 2017 to 2033 Figure 143: Asia Pacific Excluding Japan Market Volume (Tons) Analysis by End Use, 2017 to 2033 Figure 144: Asia Pacific Excluding Japan Market Value Share (%) and BPS Analysis by End Use, 2023 to 2033 Figure 145: Asia Pacific Excluding Japan Market Y-o-Y Growth (%) Projections by End Use, 2023 to 2033 Figure 146: Asia Pacific Excluding Japan Market Attractiveness by Capacity, 2023 to 2033 Figure 147: Asia Pacific Excluding Japan Market Attractiveness by Product Type, 2023 to 2033 Figure 148: Asia Pacific Excluding Japan Market Attractiveness by Aluminum Foil Type, 2023 to 2033 Figure 149: Asia Pacific Excluding Japan Market Attractiveness by End Use, 2023 to 2033 Figure 150: Asia Pacific Excluding Japan Market Attractiveness by Country, 2023 to 2033 Figure 151: Japan Market Value (US$ Million) by Capacity, 2023 to 2033 Figure 152: Japan Market Value (US$ Million) by Product Type, 2023 to 2033 Figure 153: Japan Market Value (US$ Million) by Aluminum Foil Type, 2023 to 2033 Figure 154: Japan Market Value (US$ Million) by End Use, 2023 to 2033 Figure 155: Japan Market Value (US$ Million) by Country, 2023 to 2033 Figure 156: Japan Market Value (US$ Million) Analysis by Country, 2017 to 2033 Figure 157: Japan Market Volume (Tons) Analysis by Country, 2017 to 2033 Figure 158: Japan Market Value Share (%) and BPS Analysis by Country, 2023 to 2033 Figure 159: Japan Market Y-o-Y Growth (%) Projections by Country, 2023 to 2033 Figure 160: Japan Market Value (US$ Million) Analysis by Capacity, 2017 to 2033 Figure 161: Japan Market Volume (Tons) Analysis by Capacity, 2017 to 2033 Figure 162: Japan Market Value Share (%) and BPS Analysis by Capacity, 2023 to 2033 Figure 163: Japan Market Y-o-Y Growth (%) Projections by Capacity, 2023 to 2033 Figure 164: Japan Market Value (US$ Million) Analysis by Product Type, 2017 to 2033 Figure 165: Japan Market Volume (Tons) Analysis by Product Type, 2017 to 2033 Figure 166: Japan Market Value Share (%) and BPS Analysis by Product Type, 2023 to 2033 Figure 167: Japan Market Y-o-Y Growth (%) Projections by Product Type, 2023 to 2033 Figure 168: Japan Market Value (US$ Million) Analysis by Aluminum Foil Type, 2017 to 2033 Figure 169: Japan Market Volume (Tons) Analysis by Aluminum Foil Type, 2017 to 2033 Figure 170: Japan Market Value Share (%) and BPS Analysis by Aluminum Foil Type, 2023 to 2033 Figure 171: Japan Market Y-o-Y Growth (%) Projections by Aluminum Foil Type, 2023 to 2033 Figure 172: Japan Market Value (US$ Million) Analysis by End Use, 2017 to 2033 Figure 173: Japan Market Volume (Tons) Analysis by End Use, 2017 to 2033 Figure 174: Japan Market Value Share (%) and BPS Analysis by End Use, 2023 to 2033 Figure 175: Japan Market Y-o-Y Growth (%) Projections by End Use, 2023 to 2033 Figure 176: Japan Market Attractiveness by Capacity, 2023 to 2033 Figure 177: Japan Market Attractiveness by Product Type, 2023 to 2033 Figure 178: Japan Market Attractiveness by Aluminum Foil Type, 2023 to 2033 Figure 179: Japan Market Attractiveness by End Use, 2023 to 2033 Figure 180: Japan Market Attractiveness by Country, 2023 to 2033 Figure 181: Middle East and Africa Market Value (US$ Million) by Capacity, 2023 to 2033 Figure 182: Middle East and Africa Market Value (US$ Million) by Product Type, 2023 to 2033 Figure 183: Middle East and Africa Market Value (US$ Million) by Aluminum Foil Type, 2023 to 2033 Figure 184: Middle East and Africa Market Value (US$ Million) by End Use, 2023 to 2033 Figure 185: Middle East and Africa Market Value (US$ Million) by Country, 2023 to 2033 Figure 186: Middle East and Africa Market Value (US$ Million) Analysis by Country, 2017 to 2033 Figure 187: Middle East and Africa Market Volume (Tons) Analysis by Country, 2017 to 2033 Figure 188: Middle East and Africa Market Value Share (%) and BPS Analysis by Country, 2023 to 2033 Figure 189: Middle East and Africa Market Y-o-Y Growth (%) Projections by Country, 2023 to 2033 Figure 190: Middle East and Africa Market Value (US$ Million) Analysis by Capacity, 2017 to 2033 Figure 191: Middle East and Africa Market Volume (Tons) Analysis by Capacity, 2017 to 2033 Figure 192: Middle East and Africa Market Value Share (%) and BPS Analysis by Capacity, 2023 to 2033 Figure 193: Middle East and Africa Market Y-o-Y Growth (%) Projections by Capacity, 2023 to 2033 Figure 194: Middle East and Africa Market Value (US$ Million) Analysis by Product Type, 2017 to 2033 Figure 195: Middle East and Africa Market Volume (Tons) Analysis by Product Type, 2017 to 2033 Figure 196: Middle East and Africa Market Value Share (%) and BPS Analysis by Product Type, 2023 to 2033 Figure 197: Middle East and Africa Market Y-o-Y Growth (%) Projections by Product Type, 2023 to 2033 Figure 198: Middle East and Africa Market Value (US$ Million) Analysis by Aluminum Foil Type, 2017 to 2033 Figure 199: Middle East and Africa Market Volume (Tons) Analysis by Aluminum Foil Type, 2017 to 2033 Figure 200: Middle East and Africa Market Value Share (%) and BPS Analysis by Aluminum Foil Type, 2023 to 2033 Figure 201: Middle East and Africa Market Y-o-Y Growth (%) Projections by Aluminum Foil Type, 2023 to 2033 Figure 202: Middle East and Africa Market Value (US$ Million) Analysis by End Use, 2017 to 2033 Figure 203: Middle East and Africa Market Volume (Tons) Analysis by End Use, 2017 to 2033 Figure 204: Middle East and Africa Market Value Share (%) and BPS Analysis by End Use, 2023 to 2033 Figure 205: Middle East and Africa Market Y-o-Y Growth (%) Projections by End Use, 2023 to 2033 Figure 206: Middle East and Africa Market Attractiveness by Capacity, 2023 to 2033 Figure 207: Middle East and Africa Market Attractiveness by Product Type, 2023 to 2033 Figure 208: Middle East and Africa Market Attractiveness by Aluminum Foil Type, 2023 to 2033 Figure 209: Middle East and Africa Market Attractiveness by End Use, 2023 to 2033 Figure 210: Middle East and Africa Market Attractiveness by Country, 2023 to 2033
Recommendations
Explore Packaging Insights
View Reports