Aluminum-Free Food Pouch Market Size and Share Forecast Outlook 2025 to 2035

The Aluminum-Free Food Pouch Market is estimated to be valued at USD 45.4 billion in 2025 and is projected to reach USD 81.4 billion by 2035, registering a compound annual growth rate (CAGR) of 6.0% over the forecast period.
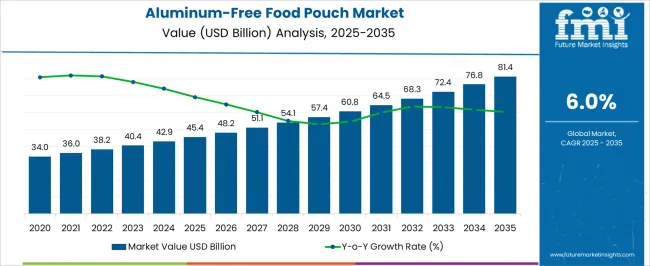
Quick Stats for Aluminum-Free Food Pouch Market

  • Aluminum-Free Food Pouch Market Value (2025): USD 45.4 billion
  • Aluminum-Free Food Pouch Market Forecast Value (2035): USD 81.4 billion
  • Aluminum-Free Food Pouch Market Forecast CAGR: 6.0%
  • Leading Segment in Aluminum-Free Food Pouch Market in 2025: Bioplastics (32.5%)
  • Key Growth Regions in Aluminum-Free Food Pouch Market: North America, Asia-Pacific, Europe
  • Top Key Players in Aluminum-Free Food Pouch Market: Astrapak Limited, Berry Plastic Corporation, Covers, Mondi Group, Sonoco

Aluminum Free Food Pouch Market Market Value Analysis

Aluminum-Free Food Pouch Market Key Takeaways

Metric Value
Aluminum-Free Food Pouch Market Estimated Value in (2025 E) USD 45.4 billion
Aluminum-Free Food Pouch Market Forecast Value in (2035 F) USD 81.4 billion
Forecast CAGR (2025 to 2035) 6.0%

Why is the Aluminum-Free Food Pouch Market Growing?

The Aluminum-Free Food Pouch market is witnessing robust growth as consumer demand shifts toward sustainable and eco-friendly packaging solutions. Traditional aluminum-based packaging is increasingly being replaced due to environmental concerns, recyclability challenges, and rising demand for lightweight yet durable alternatives. Innovations in bioplastics, paper-based laminates, and multilayer flexible films are creating new opportunities for packaging manufacturers to cater to environmentally conscious consumers and regulatory requirements.

The growing emphasis on reducing carbon footprints, achieving circular economy goals, and promoting plastic waste reduction is reinforcing the adoption of aluminum-free packaging solutions across food categories. Convenience, extended shelf life, and branding opportunities offered by aluminum-free pouches further strengthen their market position. Increasing demand from ready-to-eat foods, snacks, and beverages is driving volume consumption, supported by the expansion of retail and e-commerce channels.

Regulatory mandates in key regions requiring sustainable packaging adoption and industry commitments toward eco-friendly practices are shaping the market landscape As technological advancements continue to improve barrier properties and performance, aluminum-free food pouches are expected to emerge as a mainstream packaging choice in global markets.

Segmental Analysis

The aluminum-free food pouch market is segmented by material type, application area, end-user industry, thickness, distribution channel, and geographic regions. By material type, aluminum-free food pouch market is divided into Bioplastics, Paper Based Materials, Polyethylene (PE), Polypropylene (PP), and Other Eco Friendly Materials. In terms of application area, aluminum-free food pouch market is classified into Snacks, Ready-To-Eat Meals, Beverages, Health Supplements, and Pet Food. Based on end-user industry, aluminum-free food pouch market is segmented into Food And Beverage, Personal Care, Pharmaceutical, Household Products, and Others. By thickness, aluminum-free food pouch market is segmented into Below 50 Microns, 50 To 100 Microns, 100 To 150 Microns, and Above 150 Microns. By distribution channel, aluminum-free food pouch market is segmented into Online Retail, Supermarkets/Hypermarkets, Convenience Stores, Specialty Stores, and Direct Sales. Regionally, the aluminum-free food pouch industry is classified into North America, Latin America, Western Europe, Eastern Europe, Balkan & Baltic Countries, Russia & Belarus, Central Asia, East Asia, South Asia & Pacific, and the Middle East & Africa.
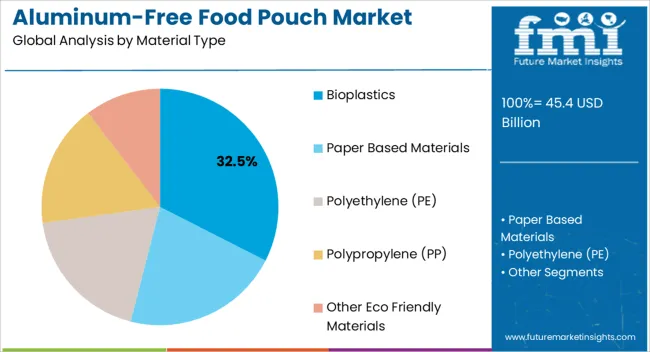
Insights into the Bioplastics Material Type Segment

Aluminum Free Food Pouch Market Analysis By Material Type

The bioplastics material type segment is expected to account for 32.5% of the Aluminum-Free Food Pouch market revenue in 2025, positioning it as the leading material choice. Growth is being driven by increasing consumer preference for renewable, biodegradable, and compostable packaging alternatives that reduce dependency on fossil-based materials. Bioplastics provide favorable mechanical strength, barrier protection, and compatibility with food products, making them suitable for flexible pouch applications.

Manufacturers are investing in scalable bioplastic production to meet the rising demand from food brands aiming to achieve sustainability targets. Additionally, regulatory encouragement for bio-based solutions and consumer awareness campaigns promoting green packaging are further enhancing adoption. Bioplastics also allow customization of pouch designs, ensuring brand differentiation and functional performance.

Their ability to balance performance with eco-friendliness provides an edge in markets where environmental compliance and consumer perception are equally critical As global food companies continue to adopt sustainable practices, bioplastics are expected to maintain a strong growth trajectory, reinforcing their leadership within the material segment.
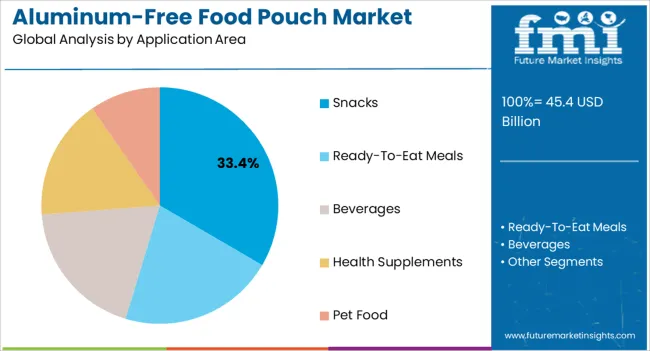
Insights into the Snacks Application Area Segment

Aluminum Free Food Pouch Market Analysis By Application Area

The snacks application area segment is projected to hold 33.4% of the Aluminum-Free Food Pouch market revenue in 2025, making it the dominant application. Growth is being supported by the rising consumption of packaged snacks, including chips, dried fruits, energy bars, and bakery items, across both developed and emerging economies. The need for lightweight, portable, and sustainable packaging has made aluminum-free pouches highly attractive for snack manufacturers.

These pouches provide excellent barrier protection against moisture and oxygen, ensuring product freshness and extended shelf life. Branding opportunities through customizable printing and flexible design further drive their adoption in competitive snack markets. Increasing health-conscious consumer behavior and demand for portion-controlled packaging are also influencing pouch innovation in this segment.

Expansion of retail chains, online food delivery platforms, and convenience stores has accelerated demand for snack pouches Regulatory guidelines promoting sustainable packaging adoption further strengthen the segment’s growth prospects As snack consumption continues to rise globally, the snacks application area is set to remain the leading contributor to the market’s revenue.
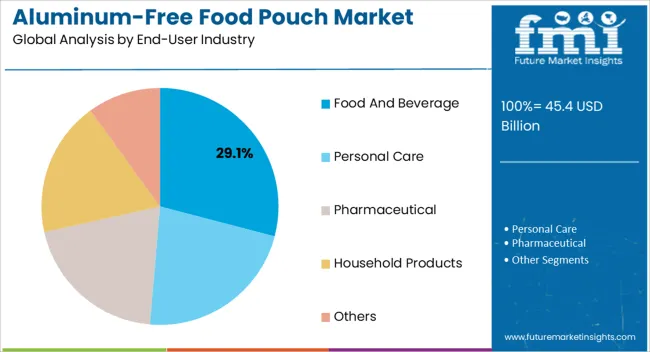
Insights into the Food and Beverage End-User Industry Segment

Aluminum Free Food Pouch Market Analysis By End User Industry

The food and beverage end-user industry segment is anticipated to account for 29.1% of the Aluminum-Free Food Pouch market revenue in 2025, underscoring its leading position among end users. This dominance is driven by the increasing reliance of food and beverage brands on sustainable packaging solutions to enhance shelf appeal, meet consumer expectations, and comply with regulatory standards. Aluminum-free pouches are being widely adopted for packaging ready meals, sauces, dairy products, and beverages due to their lightweight, flexible, and durable characteristics.

Their ability to preserve taste, aroma, and nutritional value without the drawbacks of aluminum packaging provides strong competitive advantages. Food and beverage manufacturers are leveraging these pouches for eco-friendly branding, ensuring alignment with sustainability commitments and consumer preferences.

Furthermore, advancements in multilayer bioplastic films and recyclable laminates are enhancing the functional performance of pouches in this segment As global food consumption and beverage demand continue to expand, the food and beverage end-user industry is expected to remain the primary driver of aluminum-free pouch adoption, reinforcing its leading revenue share.

Market Overview

Aluminum-Free Food Pouch Market Outlook (2025-2035)

The aluminium-free food pouch market is likely to record a CAGR of 6% through 2035. The market is expected to reach valuation of US$ 38.16 Billion in 2025, and is likely to reach a valuation of US$ 68.34 Billion by 2035.

Attributes Detail
Aluminum-free Food Pouch Market CAGR 6%
Aluminum-free Food Pouch Market (2025) US$ 38.16 Billion
Aluminum-free Food Pouch Market (2035) US$ 68.34 Billion

From fresh produce to ready-to-eat meals, effective packaging has become essential as a result of the general use of packaging and the development of modern food safety and commercialization techniques.

Fresh food packaging companies are increasingly using aluminum-free food pouches due to their customization abilities and the possibility of designing customized designs. These pouches are also eco-friendly as they are non-toxic and biodegradable.

There is a high degree of fragmentation and competition in the global aluminum-free food pouch market. Some prominent players across the globe dominate the market. Various factors, such as the rising demand for pouches in the food and beverage sector, have created enormous opportunities for the players. Mergers and acquisitions are among the strategies being adopted by players to capitalize on such opportunities.

Due to their lightweight and easy handling characteristics, aluminum-free food pouches are widely accepted by manufacturers as an eco-friendly alternative to aluminum pouches. Aside from offering flexibility and improved shelf visibility, aluminum-free food pouches are more cost-effective than aluminum pouches.

Additionally, storing food in aluminum-free pouches is much easier because users can view the contents. In contrast, aluminum pouches are difficult to see, and aluminum reacts with acids in acidic foods. Hence, most food pouch manufacturers are opting for aluminum-free pouches.

Manufacturers are creating a positive environmental impact through streamlined operations, engaged partners, and optimized products. There are companies on the market developing packaging to protect all kinds of products, including human food, pet food, medical devices, and industrial and agricultural products.

Due to the rising regulatory pressures and consumer awareness of sustainability, end-use companies are increasingly requesting sustainable packaging solutions.

There is a wide range of pouches available from the key players, and they are designed to cater to diverse applications across the food, beverage, personal care, and healthcare industries. Having a strong global presence, many companies focus on growth strategies, such as acquisitions and product launches, to maintain their leading position. Several companies have launched metal-free packaging options and ultra-high barrier packaging solutions for spouted pouches, pouches, flow packs, sachets, and bags in recent years.

A lot of manufacturers are concentrating on providing their customers with innovative products that are based on customer-centric approaches and designed to meet their needs. As a result, manufacturers are expected to be able to bypass the challenges they face and keep their growth moving forward for the global aluminum-free food pouch market even in the face of these challenges.
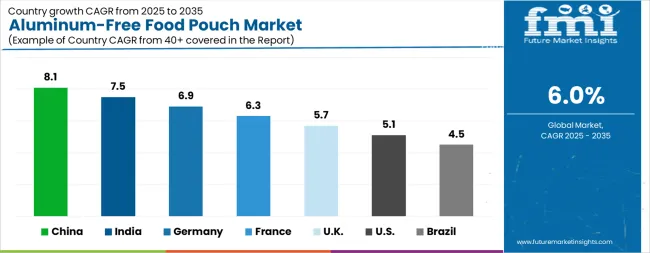
Analysis of Aluminum-Free Food Pouch Market By Key Countries

Aluminum Free Food Pouch Market Cagr Analysis By Country

Country CAGR
China 8.1%
India 7.5%
Germany 6.9%
France 6.3%
UK 5.7%
USA 5.1%
Brazil 4.5%

Country-wise Analysis

The Aluminum-Free Food Pouch Market is expected to register a CAGR of 6.0% during the forecast period, exhibiting varied country level momentum. China leads with the highest CAGR of 8.1%, followed by India at 7.5%. Developed markets such as Germany, France, and the UK continue to expand steadily, while the USA is likely to grow at consistent rates. Brazil posts the lowest CAGR at 4.5%, yet still underscores a broadly positive trajectory for the global Aluminum-Free Food Pouch Market. In 2024, Germany held a dominant revenue in the Western Europe market and is expected to grow with a CAGR of 6.9%. The USA Aluminum-Free Food Pouch Market is estimated to be valued at USD 16.3 billion in 2025 and is anticipated to reach a valuation of USD 26.9 billion by 2035. Sales are projected to rise at a CAGR of 5.1% over the forecast period between 2025 and 2035. While Japan and South Korea markets are estimated to be valued at USD 2.5 billion and USD 1.3 billion respectively in 2025.
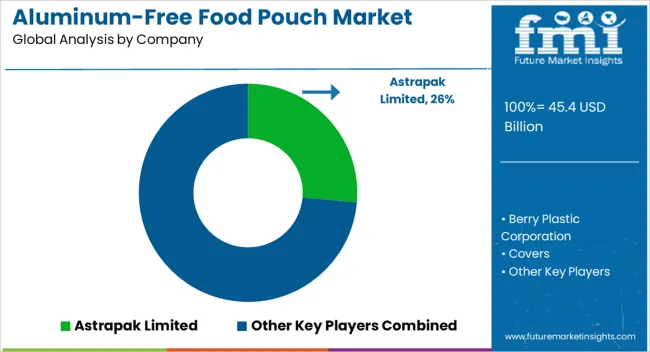
Key Players in the Aluminum-Free Food Pouch Market

Aluminum Free Food Pouch Market Analysis By Company

  • Astrapak Limited
  • Berry Plastic Corporation
  • Covers
  • Mondi Group
  • Sonoco

Scope of the Report

Item Value
Quantitative Units USD 45.4 Billion
Material Type Bioplastics, Paper Based Materials, Polyethylene (PE), Polypropylene (PP), and Other Eco Friendly Materials
Application Area Snacks, Ready-To-Eat Meals, Beverages, Health Supplements, and Pet Food
End-User Industry Food And Beverage, Personal Care, Pharmaceutical, Household Products, and Others
Thickness Below 50 Microns, 50 To 100 Microns, 100 To 150 Microns, and Above 150 Microns
Distribution Channel Online Retail, Supermarkets/Hypermarkets, Convenience Stores, Specialty Stores, and Direct Sales
Regions Covered North America, Europe, Asia-Pacific, Latin America, Middle East & Africa
Country Covered United States, Canada, Germany, France, United Kingdom, China, Japan, India, Brazil, South Africa
Key Companies Profiled Astrapak Limited, Berry Plastic Corporation, Covers, Mondi Group, and Sonoco

Aluminum-Free Food Pouch Market by Segments

Material Type:

  • Bioplastics
  • Paper Based Materials
  • Polyethylene (PE)
  • Polypropylene (PP)
  • Other Eco Friendly Materials

Application Area:

  • Snacks
  • Ready-To-Eat Meals
  • Beverages
  • Health Supplements
  • Pet Food

End-User Industry:

  • Food And Beverage
  • Personal Care
  • Pharmaceutical
  • Household Products
  • Others

Thickness:

  • Below 50 Microns
  • 50 To 100 Microns
  • 100 To 150 Microns
  • Above 150 Microns

Distribution Channel:

  • Online Retail
  • Supermarkets/Hypermarkets
  • Convenience Stores
  • Specialty Stores
  • Direct Sales

Region:

  • North America
    • USA
    • Canada
    • Mexico
  • Latin America
    • Brazil
    • Chile
    • Rest of Latin America
  • Western Europe
    • Germany
    • UK
    • Italy
    • Spain
    • France
    • Nordic
    • BENELUX
    • Rest of Western Europe
  • Eastern Europe
    • Russia
    • Poland
    • Hungary
    • Balkan & Baltic
    • Rest of Eastern Europe
  • East Asia
    • China
    • Japan
    • South Korea
  • South Asia and Pacific
    • India
    • ASEAN
    • Australia & New Zealand
    • Rest of South Asia and Pacific
  • Middle East & Africa
    • Kingdom of Saudi Arabia
    • Other GCC Countries
    • Turkiye
    • South Africa
    • Other African Union
    • Rest of Middle East & Africa

Table of Content

  1. Executive Summary
    • Global Market Outlook
    • Demand-side Trends
    • Supply-side Trends
    • Technology Roadmap Analysis
    • Analysis and Recommendations
  2. Market Overview
    • Market Coverage / Taxonomy
    • Market Definition / Scope / Limitations
  3. Market Background
    • Market Dynamics
      • Drivers
      • Restraints
      • Opportunity
      • Trends
    • Scenario Forecast
      • Demand in Optimistic Scenario
      • Demand in Likely Scenario
      • Demand in Conservative Scenario
    • Opportunity Map Analysis
    • Product Life Cycle Analysis
    • Supply Chain Analysis
    • Investment Feasibility Matrix
    • Value Chain Analysis
    • PESTLE and Porter’s Analysis
    • Regulatory Landscape
    • Regional Parent Market Outlook
    • Production and Consumption Statistics
    • Import and Export Statistics
  4. Global Market Analysis 2020 to 2024 and Forecast, 2025 to 2035
    • Historical Market Size Value (USD Million) Analysis, 2020 to 2024
    • Current and Future Market Size Value (USD Million) Projections, 2025 to 2035
      • Y-o-Y Growth Trend Analysis
      • Absolute $ Opportunity Analysis
  5. Global Market Pricing Analysis 2020 to 2024 and Forecast 2025 to 2035
  6. Global Market Analysis 2020 to 2024 and Forecast 2025 to 2035, By Material Type
    • Introduction / Key Findings
    • Historical Market Size Value (USD Million) Analysis By Material Type , 2020 to 2024
    • Current and Future Market Size Value (USD Million) Analysis and Forecast By Material Type , 2025 to 2035
      • Bioplastics
      • Paper Based Materials
      • Polyethylene (PE)
      • Polypropylene (PP)
      • Other Eco Friendly Materials
    • Y-o-Y Growth Trend Analysis By Material Type , 2020 to 2024
    • Absolute $ Opportunity Analysis By Material Type , 2025 to 2035
  7. Global Market Analysis 2020 to 2024 and Forecast 2025 to 2035, By Application Area
    • Introduction / Key Findings
    • Historical Market Size Value (USD Million) Analysis By Application Area, 2020 to 2024
    • Current and Future Market Size Value (USD Million) Analysis and Forecast By Application Area, 2025 to 2035
      • Snacks
      • Ready-To-Eat Meals
      • Beverages
      • Health Supplements
      • Pet Food
    • Y-o-Y Growth Trend Analysis By Application Area, 2020 to 2024
    • Absolute $ Opportunity Analysis By Application Area, 2025 to 2035
  8. Global Market Analysis 2020 to 2024 and Forecast 2025 to 2035, By End-User Industry
    • Introduction / Key Findings
    • Historical Market Size Value (USD Million) Analysis By End-User Industry, 2020 to 2024
    • Current and Future Market Size Value (USD Million) Analysis and Forecast By End-User Industry, 2025 to 2035
      • Food And Beverage
      • Personal Care
      • Pharmaceutical
      • Household Products
      • Others
    • Y-o-Y Growth Trend Analysis By End-User Industry, 2020 to 2024
    • Absolute $ Opportunity Analysis By End-User Industry, 2025 to 2035
  9. Global Market Analysis 2020 to 2024 and Forecast 2025 to 2035, By Thickness
    • Introduction / Key Findings
    • Historical Market Size Value (USD Million) Analysis By Thickness, 2020 to 2024
    • Current and Future Market Size Value (USD Million) Analysis and Forecast By Thickness, 2025 to 2035
      • Below 50 Microns
      • 50 To 100 Microns
      • 100 To 150 Microns
      • Above 150 Microns
    • Y-o-Y Growth Trend Analysis By Thickness, 2020 to 2024
    • Absolute $ Opportunity Analysis By Thickness, 2025 to 2035
  10. Global Market Analysis 2020 to 2024 and Forecast 2025 to 2035, By Distribution Channel
    • Introduction / Key Findings
    • Historical Market Size Value (USD Million) Analysis By Distribution Channel, 2020 to 2024
    • Current and Future Market Size Value (USD Million) Analysis and Forecast By Distribution Channel, 2025 to 2035
      • Online Retail
      • Supermarkets/Hypermarkets
      • Convenience Stores
      • Specialty Stores
      • Direct Sales
    • Y-o-Y Growth Trend Analysis By Distribution Channel, 2020 to 2024
    • Absolute $ Opportunity Analysis By Distribution Channel, 2025 to 2035
  11. Global Market Analysis 2020 to 2024 and Forecast 2025 to 2035, By Region
    • Introduction
    • Historical Market Size Value (USD Million) Analysis By Region, 2020 to 2024
    • Current Market Size Value (USD Million) Analysis and Forecast By Region, 2025 to 2035
      • North America
      • Latin America
      • Western Europe
      • Eastern Europe
      • East Asia
      • South Asia and Pacific
      • Middle East & Africa
    • Market Attractiveness Analysis By Region
  12. North America Market Analysis 2020 to 2024 and Forecast 2025 to 2035, By Country
    • Historical Market Size Value (USD Million) Trend Analysis By Market Taxonomy, 2020 to 2024
    • Market Size Value (USD Million) Forecast By Market Taxonomy, 2025 to 2035
      • By Country
        • USA
        • Canada
        • Mexico
      • By Material Type
      • By Application Area
      • By End-User Industry
      • By Thickness
      • By Distribution Channel
    • Market Attractiveness Analysis
      • By Country
      • By Material Type
      • By Application Area
      • By End-User Industry
      • By Thickness
      • By Distribution Channel
    • Key Takeaways
  13. Latin America Market Analysis 2020 to 2024 and Forecast 2025 to 2035, By Country
    • Historical Market Size Value (USD Million) Trend Analysis By Market Taxonomy, 2020 to 2024
    • Market Size Value (USD Million) Forecast By Market Taxonomy, 2025 to 2035
      • By Country
        • Brazil
        • Chile
        • Rest of Latin America
      • By Material Type
      • By Application Area
      • By End-User Industry
      • By Thickness
      • By Distribution Channel
    • Market Attractiveness Analysis
      • By Country
      • By Material Type
      • By Application Area
      • By End-User Industry
      • By Thickness
      • By Distribution Channel
    • Key Takeaways
  14. Western Europe Market Analysis 2020 to 2024 and Forecast 2025 to 2035, By Country
    • Historical Market Size Value (USD Million) Trend Analysis By Market Taxonomy, 2020 to 2024
    • Market Size Value (USD Million) Forecast By Market Taxonomy, 2025 to 2035
      • By Country
        • Germany
        • UK
        • Italy
        • Spain
        • France
        • Nordic
        • BENELUX
        • Rest of Western Europe
      • By Material Type
      • By Application Area
      • By End-User Industry
      • By Thickness
      • By Distribution Channel
    • Market Attractiveness Analysis
      • By Country
      • By Material Type
      • By Application Area
      • By End-User Industry
      • By Thickness
      • By Distribution Channel
    • Key Takeaways
  15. Eastern Europe Market Analysis 2020 to 2024 and Forecast 2025 to 2035, By Country
    • Historical Market Size Value (USD Million) Trend Analysis By Market Taxonomy, 2020 to 2024
    • Market Size Value (USD Million) Forecast By Market Taxonomy, 2025 to 2035
      • By Country
        • Russia
        • Poland
        • Hungary
        • Balkan & Baltic
        • Rest of Eastern Europe
      • By Material Type
      • By Application Area
      • By End-User Industry
      • By Thickness
      • By Distribution Channel
    • Market Attractiveness Analysis
      • By Country
      • By Material Type
      • By Application Area
      • By End-User Industry
      • By Thickness
      • By Distribution Channel
    • Key Takeaways
  16. East Asia Market Analysis 2020 to 2024 and Forecast 2025 to 2035, By Country
    • Historical Market Size Value (USD Million) Trend Analysis By Market Taxonomy, 2020 to 2024
    • Market Size Value (USD Million) Forecast By Market Taxonomy, 2025 to 2035
      • By Country
        • China
        • Japan
        • South Korea
      • By Material Type
      • By Application Area
      • By End-User Industry
      • By Thickness
      • By Distribution Channel
    • Market Attractiveness Analysis
      • By Country
      • By Material Type
      • By Application Area
      • By End-User Industry
      • By Thickness
      • By Distribution Channel
    • Key Takeaways
  17. South Asia and Pacific Market Analysis 2020 to 2024 and Forecast 2025 to 2035, By Country
    • Historical Market Size Value (USD Million) Trend Analysis By Market Taxonomy, 2020 to 2024
    • Market Size Value (USD Million) Forecast By Market Taxonomy, 2025 to 2035
      • By Country
        • India
        • ASEAN
        • Australia & New Zealand
        • Rest of South Asia and Pacific
      • By Material Type
      • By Application Area
      • By End-User Industry
      • By Thickness
      • By Distribution Channel
    • Market Attractiveness Analysis
      • By Country
      • By Material Type
      • By Application Area
      • By End-User Industry
      • By Thickness
      • By Distribution Channel
    • Key Takeaways
  18. Middle East & Africa Market Analysis 2020 to 2024 and Forecast 2025 to 2035, By Country
    • Historical Market Size Value (USD Million) Trend Analysis By Market Taxonomy, 2020 to 2024
    • Market Size Value (USD Million) Forecast By Market Taxonomy, 2025 to 2035
      • By Country
        • Kingdom of Saudi Arabia
        • Other GCC Countries
        • Turkiye
        • South Africa
        • Other African Union
        • Rest of Middle East & Africa
      • By Material Type
      • By Application Area
      • By End-User Industry
      • By Thickness
      • By Distribution Channel
    • Market Attractiveness Analysis
      • By Country
      • By Material Type
      • By Application Area
      • By End-User Industry
      • By Thickness
      • By Distribution Channel
    • Key Takeaways
  19. Key Countries Market Analysis
    • USA
      • Pricing Analysis
      • Market Share Analysis, 2024
        • By Material Type
        • By Application Area
        • By End-User Industry
        • By Thickness
        • By Distribution Channel
    • Canada
      • Pricing Analysis
      • Market Share Analysis, 2024
        • By Material Type
        • By Application Area
        • By End-User Industry
        • By Thickness
        • By Distribution Channel
    • Mexico
      • Pricing Analysis
      • Market Share Analysis, 2024
        • By Material Type
        • By Application Area
        • By End-User Industry
        • By Thickness
        • By Distribution Channel
    • Brazil
      • Pricing Analysis
      • Market Share Analysis, 2024
        • By Material Type
        • By Application Area
        • By End-User Industry
        • By Thickness
        • By Distribution Channel
    • Chile
      • Pricing Analysis
      • Market Share Analysis, 2024
        • By Material Type
        • By Application Area
        • By End-User Industry
        • By Thickness
        • By Distribution Channel
    • Germany
      • Pricing Analysis
      • Market Share Analysis, 2024
        • By Material Type
        • By Application Area
        • By End-User Industry
        • By Thickness
        • By Distribution Channel
    • UK
      • Pricing Analysis
      • Market Share Analysis, 2024
        • By Material Type
        • By Application Area
        • By End-User Industry
        • By Thickness
        • By Distribution Channel
    • Italy
      • Pricing Analysis
      • Market Share Analysis, 2024
        • By Material Type
        • By Application Area
        • By End-User Industry
        • By Thickness
        • By Distribution Channel
    • Spain
      • Pricing Analysis
      • Market Share Analysis, 2024
        • By Material Type
        • By Application Area
        • By End-User Industry
        • By Thickness
        • By Distribution Channel
    • France
      • Pricing Analysis
      • Market Share Analysis, 2024
        • By Material Type
        • By Application Area
        • By End-User Industry
        • By Thickness
        • By Distribution Channel
    • India
      • Pricing Analysis
      • Market Share Analysis, 2024
        • By Material Type
        • By Application Area
        • By End-User Industry
        • By Thickness
        • By Distribution Channel
    • ASEAN
      • Pricing Analysis
      • Market Share Analysis, 2024
        • By Material Type
        • By Application Area
        • By End-User Industry
        • By Thickness
        • By Distribution Channel
    • Australia & New Zealand
      • Pricing Analysis
      • Market Share Analysis, 2024
        • By Material Type
        • By Application Area
        • By End-User Industry
        • By Thickness
        • By Distribution Channel
    • China
      • Pricing Analysis
      • Market Share Analysis, 2024
        • By Material Type
        • By Application Area
        • By End-User Industry
        • By Thickness
        • By Distribution Channel
    • Japan
      • Pricing Analysis
      • Market Share Analysis, 2024
        • By Material Type
        • By Application Area
        • By End-User Industry
        • By Thickness
        • By Distribution Channel
    • South Korea
      • Pricing Analysis
      • Market Share Analysis, 2024
        • By Material Type
        • By Application Area
        • By End-User Industry
        • By Thickness
        • By Distribution Channel
    • Russia
      • Pricing Analysis
      • Market Share Analysis, 2024
        • By Material Type
        • By Application Area
        • By End-User Industry
        • By Thickness
        • By Distribution Channel
    • Poland
      • Pricing Analysis
      • Market Share Analysis, 2024
        • By Material Type
        • By Application Area
        • By End-User Industry
        • By Thickness
        • By Distribution Channel
    • Hungary
      • Pricing Analysis
      • Market Share Analysis, 2024
        • By Material Type
        • By Application Area
        • By End-User Industry
        • By Thickness
        • By Distribution Channel
    • Kingdom of Saudi Arabia
      • Pricing Analysis
      • Market Share Analysis, 2024
        • By Material Type
        • By Application Area
        • By End-User Industry
        • By Thickness
        • By Distribution Channel
    • Turkiye
      • Pricing Analysis
      • Market Share Analysis, 2024
        • By Material Type
        • By Application Area
        • By End-User Industry
        • By Thickness
        • By Distribution Channel
    • South Africa
      • Pricing Analysis
      • Market Share Analysis, 2024
        • By Material Type
        • By Application Area
        • By End-User Industry
        • By Thickness
        • By Distribution Channel
  20. Market Structure Analysis
    • Competition Dashboard
    • Competition Benchmarking
    • Market Share Analysis of Top Players
      • By Regional
      • By Material Type
      • By Application Area
      • By End-User Industry
      • By Thickness
      • By Distribution Channel
  21. Competition Analysis
    • Competition Deep Dive
      • Astrapak Limited
        • Overview
        • Product Portfolio
        • Profitability by Market Segments (Product/Age /Sales Channel/Region)
        • Sales Footprint
        • Strategy Overview
          • Marketing Strategy
          • Product Strategy
          • Channel Strategy
      • Berry Plastic Corporation
      • Covers
      • Mondi Group
      • Sonoco
  22. Assumptions & Acronyms Used
  23. Research Methodology

List of Tables

  • Table 1: Global Market Value (USD Million) Forecast by Region, 2020 to 2035
  • Table 2: Global Market Value (USD Million) Forecast by Material Type , 2020 to 2035
  • Table 3: Global Market Value (USD Million) Forecast by Application Area, 2020 to 2035
  • Table 4: Global Market Value (USD Million) Forecast by End-User Industry, 2020 to 2035
  • Table 5: Global Market Value (USD Million) Forecast by Thickness, 2020 to 2035
  • Table 6: Global Market Value (USD Million) Forecast by Distribution Channel, 2020 to 2035
  • Table 7: North America Market Value (USD Million) Forecast by Country, 2020 to 2035
  • Table 8: North America Market Value (USD Million) Forecast by Material Type , 2020 to 2035
  • Table 9: North America Market Value (USD Million) Forecast by Application Area, 2020 to 2035
  • Table 10: North America Market Value (USD Million) Forecast by End-User Industry, 2020 to 2035
  • Table 11: North America Market Value (USD Million) Forecast by Thickness, 2020 to 2035
  • Table 12: North America Market Value (USD Million) Forecast by Distribution Channel, 2020 to 2035
  • Table 13: Latin America Market Value (USD Million) Forecast by Country, 2020 to 2035
  • Table 14: Latin America Market Value (USD Million) Forecast by Material Type , 2020 to 2035
  • Table 15: Latin America Market Value (USD Million) Forecast by Application Area, 2020 to 2035
  • Table 16: Latin America Market Value (USD Million) Forecast by End-User Industry, 2020 to 2035
  • Table 17: Latin America Market Value (USD Million) Forecast by Thickness, 2020 to 2035
  • Table 18: Latin America Market Value (USD Million) Forecast by Distribution Channel, 2020 to 2035
  • Table 19: Western Europe Market Value (USD Million) Forecast by Country, 2020 to 2035
  • Table 20: Western Europe Market Value (USD Million) Forecast by Material Type , 2020 to 2035
  • Table 21: Western Europe Market Value (USD Million) Forecast by Application Area, 2020 to 2035
  • Table 22: Western Europe Market Value (USD Million) Forecast by End-User Industry, 2020 to 2035
  • Table 23: Western Europe Market Value (USD Million) Forecast by Thickness, 2020 to 2035
  • Table 24: Western Europe Market Value (USD Million) Forecast by Distribution Channel, 2020 to 2035
  • Table 25: Eastern Europe Market Value (USD Million) Forecast by Country, 2020 to 2035
  • Table 26: Eastern Europe Market Value (USD Million) Forecast by Material Type , 2020 to 2035
  • Table 27: Eastern Europe Market Value (USD Million) Forecast by Application Area, 2020 to 2035
  • Table 28: Eastern Europe Market Value (USD Million) Forecast by End-User Industry, 2020 to 2035
  • Table 29: Eastern Europe Market Value (USD Million) Forecast by Thickness, 2020 to 2035
  • Table 30: Eastern Europe Market Value (USD Million) Forecast by Distribution Channel, 2020 to 2035
  • Table 31: East Asia Market Value (USD Million) Forecast by Country, 2020 to 2035
  • Table 32: East Asia Market Value (USD Million) Forecast by Material Type , 2020 to 2035
  • Table 33: East Asia Market Value (USD Million) Forecast by Application Area, 2020 to 2035
  • Table 34: East Asia Market Value (USD Million) Forecast by End-User Industry, 2020 to 2035
  • Table 35: East Asia Market Value (USD Million) Forecast by Thickness, 2020 to 2035
  • Table 36: East Asia Market Value (USD Million) Forecast by Distribution Channel, 2020 to 2035
  • Table 37: South Asia and Pacific Market Value (USD Million) Forecast by Country, 2020 to 2035
  • Table 38: South Asia and Pacific Market Value (USD Million) Forecast by Material Type , 2020 to 2035
  • Table 39: South Asia and Pacific Market Value (USD Million) Forecast by Application Area, 2020 to 2035
  • Table 40: South Asia and Pacific Market Value (USD Million) Forecast by End-User Industry, 2020 to 2035
  • Table 41: South Asia and Pacific Market Value (USD Million) Forecast by Thickness, 2020 to 2035
  • Table 42: South Asia and Pacific Market Value (USD Million) Forecast by Distribution Channel, 2020 to 2035
  • Table 43: Middle East & Africa Market Value (USD Million) Forecast by Country, 2020 to 2035
  • Table 44: Middle East & Africa Market Value (USD Million) Forecast by Material Type , 2020 to 2035
  • Table 45: Middle East & Africa Market Value (USD Million) Forecast by Application Area, 2020 to 2035
  • Table 46: Middle East & Africa Market Value (USD Million) Forecast by End-User Industry, 2020 to 2035
  • Table 47: Middle East & Africa Market Value (USD Million) Forecast by Thickness, 2020 to 2035
  • Table 48: Middle East & Africa Market Value (USD Million) Forecast by Distribution Channel, 2020 to 2035

List of Figures

  • Figure 1: Global Market Pricing Analysis
  • Figure 2: Global Market Value (USD Million) Forecast 2020 to 2035
  • Figure 3: Global Market Value Share and BPS Analysis by Material Type , 2025 to 2035
  • Figure 4: Global Market Y-o-Y Growth Comparison by Material Type , 2025–2035
  • Figure 5: Global Market Attractiveness Analysis by Material Type
  • Figure 6: Global Market Value Share and BPS Analysis by Application Area, 2025 to 2035
  • Figure 7: Global Market Y-o-Y Growth Comparison by Application Area, 2025–2035
  • Figure 8: Global Market Attractiveness Analysis by Application Area
  • Figure 9: Global Market Value Share and BPS Analysis by End-User Industry, 2025 to 2035
  • Figure 10: Global Market Y-o-Y Growth Comparison by End-User Industry, 2025–2035
  • Figure 11: Global Market Attractiveness Analysis by End-User Industry
  • Figure 12: Global Market Value Share and BPS Analysis by Thickness, 2025 to 2035
  • Figure 13: Global Market Y-o-Y Growth Comparison by Thickness, 2025–2035
  • Figure 14: Global Market Attractiveness Analysis by Thickness
  • Figure 15: Global Market Value Share and BPS Analysis by Distribution Channel, 2025 to 2035
  • Figure 16: Global Market Y-o-Y Growth Comparison by Distribution Channel, 2025–2035
  • Figure 17: Global Market Attractiveness Analysis by Distribution Channel
  • Figure 18: Global Market Value (USD Million) Share and BPS Analysis by Region, 2025 to 2035
  • Figure 19: Global Market Y-o-Y Growth Comparison by Region, 2025–2035
  • Figure 20: Global Market Attractiveness Analysis by Region
  • Figure 21: North America Market Incremental Dollar Opportunity, 2025–2035
  • Figure 22: Latin America Market Incremental Dollar Opportunity, 2025–2035
  • Figure 23: Western Europe Market Incremental Dollar Opportunity, 2025–2035
  • Figure 24: Eastern Europe Market Incremental Dollar Opportunity, 2025–2035
  • Figure 25: East Asia Market Incremental Dollar Opportunity, 2025–2035
  • Figure 26: South Asia and Pacific Market Incremental Dollar Opportunity, 2025–2035
  • Figure 27: Middle East & Africa Market Incremental Dollar Opportunity, 2025–2035
  • Figure 28: North America Market Value Share and BPS Analysis by Country, 2025 to 2035
  • Figure 29: North America Market Value Share and BPS Analysis by Material Type , 2025 to 2035
  • Figure 30: North America Market Y-o-Y Growth Comparison by Material Type , 2025–2035
  • Figure 31: North America Market Attractiveness Analysis by Material Type
  • Figure 32: North America Market Value Share and BPS Analysis by Application Area, 2025 to 2035
  • Figure 33: North America Market Y-o-Y Growth Comparison by Application Area, 2025–2035
  • Figure 34: North America Market Attractiveness Analysis by Application Area
  • Figure 35: North America Market Value Share and BPS Analysis by End-User Industry, 2025 to 2035
  • Figure 36: North America Market Y-o-Y Growth Comparison by End-User Industry, 2025–2035
  • Figure 37: North America Market Attractiveness Analysis by End-User Industry
  • Figure 38: North America Market Value Share and BPS Analysis by Thickness, 2025 to 2035
  • Figure 39: North America Market Y-o-Y Growth Comparison by Thickness, 2025–2035
  • Figure 40: North America Market Attractiveness Analysis by Thickness
  • Figure 41: North America Market Value Share and BPS Analysis by Distribution Channel, 2025 to 2035
  • Figure 42: North America Market Y-o-Y Growth Comparison by Distribution Channel, 2025–2035
  • Figure 43: North America Market Attractiveness Analysis by Distribution Channel
  • Figure 44: Latin America Market Value Share and BPS Analysis by Country, 2025 to 2035
  • Figure 45: Latin America Market Value Share and BPS Analysis by Material Type , 2025 to 2035
  • Figure 46: Latin America Market Y-o-Y Growth Comparison by Material Type , 2025–2035
  • Figure 47: Latin America Market Attractiveness Analysis by Material Type
  • Figure 48: Latin America Market Value Share and BPS Analysis by Application Area, 2025 to 2035
  • Figure 49: Latin America Market Y-o-Y Growth Comparison by Application Area, 2025–2035
  • Figure 50: Latin America Market Attractiveness Analysis by Application Area
  • Figure 51: Latin America Market Value Share and BPS Analysis by End-User Industry, 2025 to 2035
  • Figure 52: Latin America Market Y-o-Y Growth Comparison by End-User Industry, 2025–2035
  • Figure 53: Latin America Market Attractiveness Analysis by End-User Industry
  • Figure 54: Latin America Market Value Share and BPS Analysis by Thickness, 2025 to 2035
  • Figure 55: Latin America Market Y-o-Y Growth Comparison by Thickness, 2025–2035
  • Figure 56: Latin America Market Attractiveness Analysis by Thickness
  • Figure 57: Latin America Market Value Share and BPS Analysis by Distribution Channel, 2025 to 2035
  • Figure 58: Latin America Market Y-o-Y Growth Comparison by Distribution Channel, 2025–2035
  • Figure 59: Latin America Market Attractiveness Analysis by Distribution Channel
  • Figure 60: Western Europe Market Value Share and BPS Analysis by Country, 2025 to 2035
  • Figure 61: Western Europe Market Value Share and BPS Analysis by Material Type , 2025 to 2035
  • Figure 62: Western Europe Market Y-o-Y Growth Comparison by Material Type , 2025–2035
  • Figure 63: Western Europe Market Attractiveness Analysis by Material Type
  • Figure 64: Western Europe Market Value Share and BPS Analysis by Application Area, 2025 to 2035
  • Figure 65: Western Europe Market Y-o-Y Growth Comparison by Application Area, 2025–2035
  • Figure 66: Western Europe Market Attractiveness Analysis by Application Area
  • Figure 67: Western Europe Market Value Share and BPS Analysis by End-User Industry, 2025 to 2035
  • Figure 68: Western Europe Market Y-o-Y Growth Comparison by End-User Industry, 2025–2035
  • Figure 69: Western Europe Market Attractiveness Analysis by End-User Industry
  • Figure 70: Western Europe Market Value Share and BPS Analysis by Thickness, 2025 to 2035
  • Figure 71: Western Europe Market Y-o-Y Growth Comparison by Thickness, 2025–2035
  • Figure 72: Western Europe Market Attractiveness Analysis by Thickness
  • Figure 73: Western Europe Market Value Share and BPS Analysis by Distribution Channel, 2025 to 2035
  • Figure 74: Western Europe Market Y-o-Y Growth Comparison by Distribution Channel, 2025–2035
  • Figure 75: Western Europe Market Attractiveness Analysis by Distribution Channel
  • Figure 76: Eastern Europe Market Value Share and BPS Analysis by Country, 2025 to 2035
  • Figure 77: Eastern Europe Market Value Share and BPS Analysis by Material Type , 2025 to 2035
  • Figure 78: Eastern Europe Market Y-o-Y Growth Comparison by Material Type , 2025–2035
  • Figure 79: Eastern Europe Market Attractiveness Analysis by Material Type
  • Figure 80: Eastern Europe Market Value Share and BPS Analysis by Application Area, 2025 to 2035
  • Figure 81: Eastern Europe Market Y-o-Y Growth Comparison by Application Area, 2025–2035
  • Figure 82: Eastern Europe Market Attractiveness Analysis by Application Area
  • Figure 83: Eastern Europe Market Value Share and BPS Analysis by End-User Industry, 2025 to 2035
  • Figure 84: Eastern Europe Market Y-o-Y Growth Comparison by End-User Industry, 2025–2035
  • Figure 85: Eastern Europe Market Attractiveness Analysis by End-User Industry
  • Figure 86: Eastern Europe Market Value Share and BPS Analysis by Thickness, 2025 to 2035
  • Figure 87: Eastern Europe Market Y-o-Y Growth Comparison by Thickness, 2025–2035
  • Figure 88: Eastern Europe Market Attractiveness Analysis by Thickness
  • Figure 89: Eastern Europe Market Value Share and BPS Analysis by Distribution Channel, 2025 to 2035
  • Figure 90: Eastern Europe Market Y-o-Y Growth Comparison by Distribution Channel, 2025–2035
  • Figure 91: Eastern Europe Market Attractiveness Analysis by Distribution Channel
  • Figure 92: East Asia Market Value Share and BPS Analysis by Country, 2025 to 2035
  • Figure 93: East Asia Market Value Share and BPS Analysis by Material Type , 2025 to 2035
  • Figure 94: East Asia Market Y-o-Y Growth Comparison by Material Type , 2025–2035
  • Figure 95: East Asia Market Attractiveness Analysis by Material Type
  • Figure 96: East Asia Market Value Share and BPS Analysis by Application Area, 2025 to 2035
  • Figure 97: East Asia Market Y-o-Y Growth Comparison by Application Area, 2025–2035
  • Figure 98: East Asia Market Attractiveness Analysis by Application Area
  • Figure 99: East Asia Market Value Share and BPS Analysis by End-User Industry, 2025 to 2035
  • Figure 100: East Asia Market Y-o-Y Growth Comparison by End-User Industry, 2025–2035
  • Figure 101: East Asia Market Attractiveness Analysis by End-User Industry
  • Figure 102: East Asia Market Value Share and BPS Analysis by Thickness, 2025 to 2035
  • Figure 103: East Asia Market Y-o-Y Growth Comparison by Thickness, 2025–2035
  • Figure 104: East Asia Market Attractiveness Analysis by Thickness
  • Figure 105: East Asia Market Value Share and BPS Analysis by Distribution Channel, 2025 to 2035
  • Figure 106: East Asia Market Y-o-Y Growth Comparison by Distribution Channel, 2025–2035
  • Figure 107: East Asia Market Attractiveness Analysis by Distribution Channel
  • Figure 108: South Asia and Pacific Market Value Share and BPS Analysis by Country, 2025 to 2035
  • Figure 109: South Asia and Pacific Market Value Share and BPS Analysis by Material Type , 2025 to 2035
  • Figure 110: South Asia and Pacific Market Y-o-Y Growth Comparison by Material Type , 2025–2035
  • Figure 111: South Asia and Pacific Market Attractiveness Analysis by Material Type
  • Figure 112: South Asia and Pacific Market Value Share and BPS Analysis by Application Area, 2025 to 2035
  • Figure 113: South Asia and Pacific Market Y-o-Y Growth Comparison by Application Area, 2025–2035
  • Figure 114: South Asia and Pacific Market Attractiveness Analysis by Application Area
  • Figure 115: South Asia and Pacific Market Value Share and BPS Analysis by End-User Industry, 2025 to 2035
  • Figure 116: South Asia and Pacific Market Y-o-Y Growth Comparison by End-User Industry, 2025–2035
  • Figure 117: South Asia and Pacific Market Attractiveness Analysis by End-User Industry
  • Figure 118: South Asia and Pacific Market Value Share and BPS Analysis by Thickness, 2025 to 2035
  • Figure 119: South Asia and Pacific Market Y-o-Y Growth Comparison by Thickness, 2025–2035
  • Figure 120: South Asia and Pacific Market Attractiveness Analysis by Thickness
  • Figure 121: South Asia and Pacific Market Value Share and BPS Analysis by Distribution Channel, 2025 to 2035
  • Figure 122: South Asia and Pacific Market Y-o-Y Growth Comparison by Distribution Channel, 2025–2035
  • Figure 123: South Asia and Pacific Market Attractiveness Analysis by Distribution Channel
  • Figure 124: Middle East & Africa Market Value Share and BPS Analysis by Country, 2025 to 2035
  • Figure 125: Middle East & Africa Market Value Share and BPS Analysis by Material Type , 2025 to 2035
  • Figure 126: Middle East & Africa Market Y-o-Y Growth Comparison by Material Type , 2025–2035
  • Figure 127: Middle East & Africa Market Attractiveness Analysis by Material Type
  • Figure 128: Middle East & Africa Market Value Share and BPS Analysis by Application Area, 2025 to 2035
  • Figure 129: Middle East & Africa Market Y-o-Y Growth Comparison by Application Area, 2025–2035
  • Figure 130: Middle East & Africa Market Attractiveness Analysis by Application Area
  • Figure 131: Middle East & Africa Market Value Share and BPS Analysis by End-User Industry, 2025 to 2035
  • Figure 132: Middle East & Africa Market Y-o-Y Growth Comparison by End-User Industry, 2025–2035
  • Figure 133: Middle East & Africa Market Attractiveness Analysis by End-User Industry
  • Figure 134: Middle East & Africa Market Value Share and BPS Analysis by Thickness, 2025 to 2035
  • Figure 135: Middle East & Africa Market Y-o-Y Growth Comparison by Thickness, 2025–2035
  • Figure 136: Middle East & Africa Market Attractiveness Analysis by Thickness
  • Figure 137: Middle East & Africa Market Value Share and BPS Analysis by Distribution Channel, 2025 to 2035
  • Figure 138: Middle East & Africa Market Y-o-Y Growth Comparison by Distribution Channel, 2025–2035
  • Figure 139: Middle East & Africa Market Attractiveness Analysis by Distribution Channel
  • Figure 140: Global Market – Tier Structure Analysis
  • Figure 141: Global Market – Company Share Analysis

Frequently Asked Questions

How big is the aluminum-free food pouch market in 2025?

The global aluminum-free food pouch market is estimated to be valued at USD 45.4 billion in 2025.

What will be the size of aluminum-free food pouch market in 2035?

The market size for the aluminum-free food pouch market is projected to reach USD 81.4 billion by 2035.

How much will be the aluminum-free food pouch market growth between 2025 and 2035?

The aluminum-free food pouch market is expected to grow at a 6.0% CAGR between 2025 and 2035.

What are the key product types in the aluminum-free food pouch market?

The key product types in aluminum-free food pouch market are bioplastics, paper based materials, polyethylene (pe), polypropylene (pp) and other eco friendly materials.

Which application area segment to contribute significant share in the aluminum-free food pouch market in 2025?

In terms of application area, snacks segment to command 33.4% share in the aluminum-free food pouch market in 2025.

Explore Similar Insights

Future Market Insights

Aluminum-Free Food Pouch Market

Chat With MaRIA

Chat With

MaRIA

Hi There, I am MaRIA, Your Market Research Intelligence Assistant. How may I help you?