Aluminum Hydroxide Market Outlook (2022-2032)

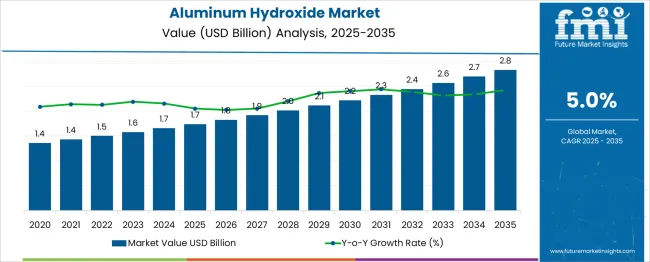
[250+ Pages Report] The global aluminum hydroxide market is expected to reach a valuation of US$ 2.8 Bn, exhibiting a CAGR of 5% over the forecast period 2022-2032. In 2022, sales of aluminum hydroxide reached US$ 1.5 Bn.

Aluminum hydroxide is used as a filler in flame retardants, which are used to enhance the inherent properties of plastics and polymers. Increasing usage of plastics and polymers in the industrial sector will steer sales in the market.

In addition to this, rising increasing consumption of plastics and polymers in fire hydrants will create opportunities for growth in the market. On the back of the aforementioned factors, demand in the aluminum hydroxide market is expected to burgeon over the upcoming decade.

Report Attribute Details
Aluminum Hydroxide Market Size (2022) US$ 1.5 billion
Aluminum Hydroxide Market Size (2032) US$ 2.8 billion
Aluminum Hydroxide Market Projected Growth Rate (2022-2032) 5% CAGR

Aluminum hydroxide, also known as aluminum trihydrate, is a key component used in the production of diverse aluminum-based compounds such as aluminum chlorides, zeolites, aluminum oxide among others.

Aluminum hydroxide is also used as a flocculent in water purification process, as an adsorbent or desiccant in gas purification, and in the formulation of antacids owing to its basic properties.

Don't pay for what you don't need

Customize your report by selecting specific countries or regions and save 30%!

What are the Key Trends Facilitating Sales in Aluminum Hydroxide Market?

Rising prevalence of acidity across the globe is increasing the demand for antacids, thereby boosting sales of aluminum hydroxide in the global market. Hence, surging application of aluminum hydroxide in the formulation of antacids due to its functional properties is propelling the growth in the market.

Elevated levels of water pollution and concern over the environment has heightened the focus on wastewater treatment. Aluminum hydroxide is used in various water purification processes. Thus, increasing water pollution will also spur demand for aluminum hydroxide over the coming decade.

Further, rapid growth in textiles, cosmetics, chemicals, and paper and ink industries is another factor facilitating the growth in the aluminum hydroxide market. Due to its functional properties, aluminum hydroxide is used in the manufacturing of various beauty products, textile products, in the production of chemicals, paper and ink.

Which Factors are Impeding the Growth in the Aluminum Hydroxide Market?

One of the key factors hampering the demand in the market is high availability of alternative products such as magnesium hydroxide. Low-cost and easy availability of alternatives is anticipated to limit sales of magnesium hydroxide. Additionally, rising health risks, due to exposure to aluminum hydroxide, will also restrict growth to an extent.

Nikhil Kaitwade
Nikhil Kaitwade

Principal Consultant

Talk to Analyst

Find your sweet spots for generating winning opportunities in this market.

How will Expansion of Chemical Industry in China Boost Asia Pacific Aluminum Hydroxide Market?

Over the past decade, Asia Pacific has seen rapid growth in the chemicals and pharmaceutical industries. Growing consumption of cosmetics and personal care products is one of the key factors aiding the growth in the chemical industry.

Within the Asia Pacific market, China is expected to account for a dominant share.. Due to the presence of one of the world’s largest chemical markets, China wields a powerful impact on regional market.

Further, favorable policies in the pharmaceutical industry is increasing the adoption of aluminum hydroxide in China. This is expected to further bolster the demand in the Asia Pacific market.

What is the Demand Outlook for Middle East & Africa Aluminum Hydroxide Market?

Middle East and Africa is set to witness significant growth in aluminum hydroxide market. Growing presence of multiple industries and similar activities in Africa along with rising wastewater treatment activities in Middle East will increase market potential for aluminum hydroxide. 

Chemical and pharmaceutical industries are also taking space in Middle East and Africa. Growing use of polymers and plastics, high demand for fire retardants are also expected to drive the growth in the aluminum hydroxide market in Middle East and Africa.
Get the data you need at a Fraction of the cost

Personalize your report by choosing insights you need
and save 40%!

Market Competition 

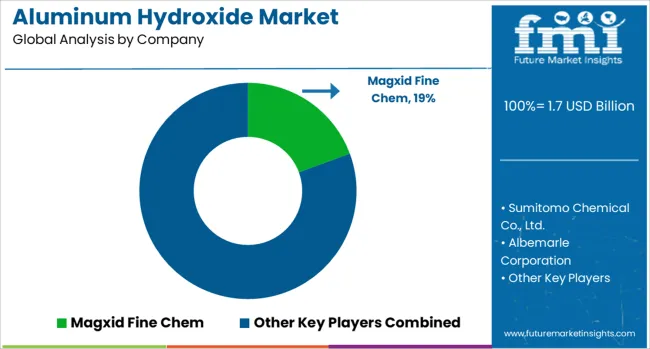
Some of the key players in the global aluminum hydroxide market are Magxid Fine Chem, Sumitomo Chemical Co., Ltd., Albemarle Corporation, Radhaji Pharma Chem, P J Chemicals, Avanschem, Showa Denko, Nabeltec AG, Huber Engineered Materials, Nashtec LLC, MAL Hungarian Aluminum and Hindalco Chemicals among others.

Aluminum hydroxide is a fairly competitive market. Leading companies are investing in research and development activities to build their existing product portfolios, while others are seeking to increase their manufacturing capacities in order to meet the surging demand for aluminum hydroxide.

Report Scope

Report Attribute Details
Growth Rate 5% CAGR from 2022 to 2032
Base Year for Estimation 2021
Historical Data 2015-2021
Forecast Period 2022-2032
Quantitative Units Revenue in US$ Million, and CAGR from 2022-2032
Report Coverage Revenue Forecast, Volume Forecast, Company Ranking, Competitive Landscape, Growth Factors, Trends and Pricing Analysis
Segments Covered
  • Grade
  • Form
  • Application
  • End User
  • Region
Countries Covered
  • North America (USA, Canada)
  • Latin America (Mexico, Brazil, Argentina, Chile, Peru)
  • Western Europe (Germany, Italy, France, UK, Spain, BENELUX, Nordics)
  • Eastern Europe (Russia, Poland, CIS)
  • Asia-Pacific (China, India, ASEAN, South Korea)
  • Japan
  • Middle East and Africa (GCC Countries, South Africa, Turkey, Iran, Israel)
Key Companies Profiled
  • Magxid Fine Chem
  • Sumitomo Chemical Co., Ltd.
  • Albemarle Corporation
  • Radhaji Pharma Chem
  • P J Chemicals
  • Avanschem 
  • Showa Denko
  • Nabeltec AG
  • Huber Engineered Materials
  • Nashtec LLC
  • MAL Hungarian Aluminium
  • Hindalco Chemicals
Customization Available Upon Request

Key Segments Profiled in the Aluminum Hydroxide Market Survey

By Grade:

  • Pharmaceutical grade
  • Industrial grade

By Form:

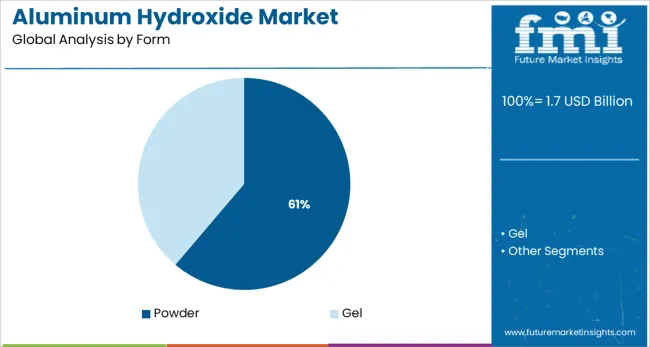
  • Powder
  • Gel

By Application:

  • Flocculants
  • Adsorbent
  • Desiccant
  • Filler
  • Catalyst
  • Antacid formulations

By End User:

  • Wastewater Treatment
  • Plastics & Polymers
  • Pharmaceuticals
  • Chemicals
  • Cosmetics & Personal Care
  • Textiles
  • Paper & Printing Inks

By Region:

  • North America (U.S., Canada)
  • Latin America (Mexico, Brazil, Argentina, Chile, Peru)
  • Western Europe (Germany, Italy, France, U.K., Spain, BENELUX, Nordics)
  • Eastern Europe (Russia, Poland, CIS)
  • Asia-Pacific (China, India, ASEAN, South Korea)
  • Japan
  • Middle East and Africa (GCC Countries, South Africa, Turkey, Iran, Israel)

Frequently Asked Questions

At what rate will the aluminum hydroxide market grow until 2032?

The global aluminum hydroxide market is expected to grow at a steady 5% CAGR until 2032.

Who are the key players in the aluminum hydroxide market?

Magxid Fine Chem, Sumitomo Chemical Co., Ltd., Albemarle Corporation, Radhaji Pharma Chem, P J Chemicals, Avanschem, Showa Denko, Nabeltec AG, Huber Engineered Materials, Nashtec LLC, MAL Hungarian Aluminum and Hindalco Chemicals are some of the major players in the aluminum hydroxide market

Which region is set to lead the aluminum hydroxide market?

Asia Pacific is expected to lead the global aluminum hydroxide market owing to ongoing expansion in the chemical and pharmaceutical sectors in China.

Table of Content
1. Executive Summary

    1.1. Global Market Outlook

    1.2. Demand-side Trends

    1.3. Supply-side Trends

    1.4. Technology Roadmap Analysis

    1.5. Analysis and Recommendations

2. Market Overview

    2.1. Market Coverage / Taxonomy

    2.2. Market Definition / Scope / Limitations

3. Market Background

    3.1. Market Dynamics

        3.1.1. Drivers

        3.1.2. Restraints

        3.1.3. Opportunity 

        3.1.4. Trends

    3.2. Scenario Forecast

        3.2.1. Demand in Optimistic Scenario

        3.2.2. Demand in Likely Scenario

        3.2.3. Demand in Conservative Scenario

    3.3. Opportunity Map Analysis

    3.4. Product Life Cycle Analysis

    3.5. Supply Chain Analysis

        3.5.1. Supply Side Participants and their Roles

            3.5.1.1. Producers

            3.5.1.2. Mid-Level Participants (Traders/ Agents/ Brokers)

            3.5.1.3. Wholesalers and Distributors

        3.5.2. Value Added and Value Created at Node in the Supply Chain

        3.5.3. List of Raw Material Suppliers

        3.5.4. List of Existing and Potential Buyer’s

    3.6. Investment Feasibility Matrix

    3.7. Value Chain Analysis

        3.7.1. Profit Margin Analysis

        3.7.2. Wholesalers and Distributors

        3.7.3. Retailers

    3.8. PESTLE and Porter’s Analysis

    3.9. Regulatory Landscape

        3.9.1. By Key Regions

        3.9.2. By Key Countries

    3.10. Regional Parent Market Outlook

    3.11. Production and Consumption Statistics

    3.12. Import and Export Statistics

4. Global Market Analysis 2017-2021 and Forecast, 2022-2032

    4.1. Historical Market Size Value (US$ Mn) & Volume (Tons) Analysis, 2017-2021

    4.2. Current and Future Market Size Value (US$ Mn) & Volume (Tons) Projections, 2022-2032

        4.2.1. Y-o-Y Growth Trend Analysis

        4.2.2. Absolute $ Opportunity Analysis

5. Global Market Analysis 2017-2021 and Forecast 2022-2032, By Grade

    5.1. Introduction / Key Findings

    5.2. Historical Market Size Value (US$ Mn) & Volume (Tons) Analysis By Grade, 2017-2021

    5.3. Current and Future Market Size Value (US$ Mn) & Volume (Tons) Analysis and Forecast By Grade, 2022-2032

        5.3.1. Pharmaceutical Grade

        5.3.2. Industrial Grade

    5.4. Y-o-Y Growth Trend Analysis By Grade, 2017-2021

    5.5. Absolute $ Opportunity Analysis By Grade, 2022-2032

6. Global Market Analysis 2017-2021 and Forecast 2022-2032, By Form

    6.1. Introduction / Key Findings

    6.2. Historical Market Size Value (US$ Mn) & Volume (Tons) Analysis By Form, 2017-2021

    6.3. Current and Future Market Size Value (US$ Mn) & Volume (Tons) Analysis and Forecast By Form, 2022-2032

        6.3.1. Powder

        6.3.2. Gel

    6.4. Y-o-Y Growth Trend Analysis By Form, 2017-2021

    6.5. Absolute $ Opportunity Analysis By Form, 2022-2032

7. Global Market Analysis 2017-2021 and Forecast 2022-2032, By Application

    7.1. Introduction / Key Findings

    7.2. Historical Market Size Value (US$ Mn) & Volume (Tons) Analysis By Application, 2017-2021

    7.3. Current and Future Market Size Value (US$ Mn) & Volume (Tons) Analysis and Forecast By Application, 2022-2032

        7.3.1. Flocculants

        7.3.2. Adsorbent

        7.3.3. Desiccant

        7.3.4. Filler

        7.3.5. Catalyst

        7.3.6. Antacid Formulations

    7.4. Y-o-Y Growth Trend Analysis By Application, 2017-2021

    7.5. Absolute $ Opportunity Analysis By Application, 2022-2032

8. Global Market Analysis 2017-2021 and Forecast 2022-2032, By End-use

    8.1. Introduction / Key Findings

    8.2. Historical Market Size Value (US$ Mn) & Volume (Tons) Analysis By End-use, 2017-2021

    8.3. Current and Future Market Size Value (US$ Mn) & Volume (Tons) Analysis and Forecast By End-use, 2022-2032

        8.3.1. Waste Water Treatment

        8.3.2. Plastics & Polymers

        8.3.3. Pharmaceuticals

        8.3.4. Chemicals

        8.3.5. Cosmetics & Personal Care

        8.3.6. Textiles

        8.3.7. Paper & Printing Inks

    8.4. Y-o-Y Growth Trend Analysis By End-use, 2017-2021

    8.5. Absolute $ Opportunity Analysis By End-use, 2022-2032

9. Global Market Analysis 2017-2021 and Forecast 2022-2032, By Region

    9.1. Introduction

    9.2. Historical Market Size Value (US$ Mn) & Volume (Tons) Analysis By Region, 2017-2021

    9.3. Current Market Size Value (US$ Mn) & Volume (Tons) Analysis and Forecast By Region, 2022-2032

        9.3.1. North America

        9.3.2. Latin America

        9.3.3. Europe

        9.3.4. Asia Pacific

        9.3.5. MEA

    9.4. Market Attractiveness Analysis By Region

10. North America Market Analysis 2017-2021 and Forecast 2022-2032, By Country

    10.1. Historical Market Size Value (US$ Mn) & Volume (Tons) Trend Analysis By Market Taxonomy, 2017-2021

    10.2. Market Size Value (US$ Mn) & Volume (Tons) Forecast By Market Taxonomy, 2022-2032

        10.2.1. By Country

            10.2.1.1. U.S.

            10.2.1.2. Canada

        10.2.2. By Grade

        10.2.3. By Form

        10.2.4. By Application

        10.2.5. By End-use

    10.3. Market Attractiveness Analysis

        10.3.1. By Country

        10.3.2. By Grade

        10.3.3. By Form

        10.3.4. By Application

        10.3.5. By End-use

    10.4. Key Takeaways

11. Latin America Market Analysis 2017-2021 and Forecast 2022-2032, By Country

    11.1. Historical Market Size Value (US$ Mn) & Volume (Tons) Trend Analysis By Market Taxonomy, 2017-2021

    11.2. Market Size Value (US$ Mn) & Volume (Tons) Forecast By Market Taxonomy, 2022-2032

        11.2.1. By Country

            11.2.1.1. Brazil

            11.2.1.2. Mexico

            11.2.1.3. Rest of Latin America

        11.2.2. By Grade

        11.2.3. By Form

        11.2.4. By Application

        11.2.5. By End-use

    11.3. Market Attractiveness Analysis

        11.3.1. By Country

        11.3.2. By Grade

        11.3.3. By Form

        11.3.4. By Application

        11.3.5. By End-use

    11.4. Key Takeaways

12. Europe Market Analysis 2017-2021 and Forecast 2022-2032, By Country

    12.1. Historical Market Size Value (US$ Mn) & Volume (Tons) Trend Analysis By Market Taxonomy, 2017-2021

    12.2. Market Size Value (US$ Mn) & Volume (Tons) Forecast By Market Taxonomy, 2022-2032

        12.2.1. By Country

            12.2.1.1. Germany

            12.2.1.2. U.K.

            12.2.1.3. France

            12.2.1.4. Spain

            12.2.1.5. Italy

            12.2.1.6. Rest of Europe

        12.2.2. By Grade

        12.2.3. By Form

        12.2.4. By Application

        12.2.5. By End-use

    12.3. Market Attractiveness Analysis

        12.3.1. By Country

        12.3.2. By Grade

        12.3.3. By Form

        12.3.4. By Application

        12.3.5. By End-use

    12.4. Key Takeaways

13. Asia Pacific Market Analysis 2017-2021 and Forecast 2022-2032, By Country

    13.1. Historical Market Size Value (US$ Mn) & Volume (Tons) Trend Analysis By Market Taxonomy, 2017-2021

    13.2. Market Size Value (US$ Mn) & Volume (Tons) Forecast By Market Taxonomy, 2022-2032

        13.2.1. By Country

            13.2.1.1. China

            13.2.1.2. Japan

            13.2.1.3. South Korea

            13.2.1.4. Malaysia

            13.2.1.5. Singapore

            13.2.1.6. Australia

            13.2.1.7. New Zealand

            13.2.1.8. Rest of APAC

        13.2.2. By Grade

        13.2.3. By Form

        13.2.4. By Application

        13.2.5. By End-use

    13.3. Market Attractiveness Analysis

        13.3.1. By Country

        13.3.2. By Grade

        13.3.3. By Form

        13.3.4. By Application

        13.3.5. By End-use

    13.4. Key Takeaways

14. MEA Market Analysis 2017-2021 and Forecast 2022-2032, By Country

    14.1. Historical Market Size Value (US$ Mn) & Volume (Tons) Trend Analysis By Market Taxonomy, 2017-2021

    14.2. Market Size Value (US$ Mn) & Volume (Tons) Forecast By Market Taxonomy, 2022-2032

        14.2.1. By Country

            14.2.1.1. GCC Countries

            14.2.1.2. South Africa

            14.2.1.3. Israel

            14.2.1.4. Rest of MEA

        14.2.2. By Grade

        14.2.3. By Form

        14.2.4. By Application

        14.2.5. By End-use

    14.3. Market Attractiveness Analysis

        14.3.1. By Country

        14.3.2. By Grade

        14.3.3. By Form

        14.3.4. By Application

        14.3.5. By End-use

    14.4. Key Takeaways

15. Key Countries Market Analysis

    15.1. U.S.

        15.1.1. Pricing Analysis

        15.1.2. Market Share Analysis, 2021

            15.1.2.1. By Grade

            15.1.2.2. By Form

            15.1.2.3. By Application

            15.1.2.4. By End-use

    15.2. Canada

        15.2.1. Pricing Analysis

        15.2.2. Market Share Analysis, 2021

            15.2.2.1. By Grade

            15.2.2.2. By Form

            15.2.2.3. By Application

            15.2.2.4. By End-use

    15.3. Brazil

        15.3.1. Pricing Analysis

        15.3.2. Market Share Analysis, 2021

            15.3.2.1. By Grade

            15.3.2.2. By Form

            15.3.2.3. By Application

            15.3.2.4. By End-use

    15.4. Mexico

        15.4.1. Pricing Analysis

        15.4.2. Market Share Analysis, 2021

            15.4.2.1. By Grade

            15.4.2.2. By Form

            15.4.2.3. By Application

            15.4.2.4. By End-use

    15.5. Germany

        15.5.1. Pricing Analysis

        15.5.2. Market Share Analysis, 2021

            15.5.2.1. By Grade

            15.5.2.2. By Form

            15.5.2.3. By Application

            15.5.2.4. By End-use

    15.6. U.K.

        15.6.1. Pricing Analysis

        15.6.2. Market Share Analysis, 2021

            15.6.2.1. By Grade

            15.6.2.2. By Form

            15.6.2.3. By Application

            15.6.2.4. By End-use

    15.7. France

        15.7.1. Pricing Analysis

        15.7.2. Market Share Analysis, 2021

            15.7.2.1. By Grade

            15.7.2.2. By Form

            15.7.2.3. By Application

            15.7.2.4. By End-use

    15.8. Spain

        15.8.1. Pricing Analysis

        15.8.2. Market Share Analysis, 2021

            15.8.2.1. By Grade

            15.8.2.2. By Form

            15.8.2.3. By Application

            15.8.2.4. By End-use

    15.9. Italy

        15.9.1. Pricing Analysis

        15.9.2. Market Share Analysis, 2021

            15.9.2.1. By Grade

            15.9.2.2. By Form

            15.9.2.3. By Application

            15.9.2.4. By End-use

    15.10. China

        15.10.1. Pricing Analysis

        15.10.2. Market Share Analysis, 2021

            15.10.2.1. By Grade

            15.10.2.2. By Form

            15.10.2.3. By Application

            15.10.2.4. By End-use

    15.11. Japan

        15.11.1. Pricing Analysis

        15.11.2. Market Share Analysis, 2021

            15.11.2.1. By Grade

            15.11.2.2. By Form

            15.11.2.3. By Application

            15.11.2.4. By End-use

    15.12. South Korea

        15.12.1. Pricing Analysis

        15.12.2. Market Share Analysis, 2021

            15.12.2.1. By Grade

            15.12.2.2. By Form

            15.12.2.3. By Application

            15.12.2.4. By End-use

    15.13. Malaysia

        15.13.1. Pricing Analysis

        15.13.2. Market Share Analysis, 2021

            15.13.2.1. By Grade

            15.13.2.2. By Form

            15.13.2.3. By Application

            15.13.2.4. By End-use

    15.14. Singapore

        15.14.1. Pricing Analysis

        15.14.2. Market Share Analysis, 2021

            15.14.2.1. By Grade

            15.14.2.2. By Form

            15.14.2.3. By Application

            15.14.2.4. By End-use

    15.15. Australia

        15.15.1. Pricing Analysis

        15.15.2. Market Share Analysis, 2021

            15.15.2.1. By Grade

            15.15.2.2. By Form

            15.15.2.3. By Application

            15.15.2.4. By End-use

    15.16. New Zealand

        15.16.1. Pricing Analysis

        15.16.2. Market Share Analysis, 2021

            15.16.2.1. By Grade

            15.16.2.2. By Form

            15.16.2.3. By Application

            15.16.2.4. By End-use

    15.17. GCC Countries

        15.17.1. Pricing Analysis

        15.17.2. Market Share Analysis, 2021

            15.17.2.1. By Grade

            15.17.2.2. By Form

            15.17.2.3. By Application

            15.17.2.4. By End-use

    15.18. South Africa

        15.18.1. Pricing Analysis

        15.18.2. Market Share Analysis, 2021

            15.18.2.1. By Grade

            15.18.2.2. By Form

            15.18.2.3. By Application

            15.18.2.4. By End-use

    15.19. Israel

        15.19.1. Pricing Analysis

        15.19.2. Market Share Analysis, 2021

            15.19.2.1. By Grade

            15.19.2.2. By Form

            15.19.2.3. By Application

            15.19.2.4. By End-use

16. Market Structure Analysis

    16.1. Competition Dashboard

    16.2. Competition Benchmarking

    16.3. Market Share Analysis of Top Players

        16.3.1. By Regional

        16.3.2. By Grade

        16.3.3. By Form

        16.3.4. By Application

        16.3.5. By End-use

17. Competition Analysis

    17.1. Competition Deep Dive

        17.1.1. Magxid Fine Chem

            17.1.1.1. Overview

            17.1.1.2. Product Portfolio

            17.1.1.3. Profitability by Market Segments

            17.1.1.4. Sales Footprint

            17.1.1.5. Strategy Overview

                17.1.1.5.1. Marketing Strategy

                17.1.1.5.2. Product Strategy

                17.1.1.5.3. Channel Strategy

        17.1.2. Sumitomo Chemical Co., Ltd.

            17.1.2.1. Overview

            17.1.2.2. Product Portfolio

            17.1.2.3. Profitability by Market Segments

            17.1.2.4. Sales Footprint

            17.1.2.5. Strategy Overview

                17.1.2.5.1. Marketing Strategy

                17.1.2.5.2. Product Strategy

                17.1.2.5.3. Channel Strategy

        17.1.3. Albemarle Corporation

            17.1.3.1. Overview

            17.1.3.2. Product Portfolio

            17.1.3.3. Profitability by Market Segments

            17.1.3.4. Sales Footprint

            17.1.3.5. Strategy Overview

                17.1.3.5.1. Marketing Strategy

                17.1.3.5.2. Product Strategy

                17.1.3.5.3. Channel Strategy

        17.1.4. Radhaji Pharma Chem

            17.1.4.1. Overview

            17.1.4.2. Product Portfolio

            17.1.4.3. Profitability by Market Segments

            17.1.4.4. Sales Footprint

            17.1.4.5. Strategy Overview

                17.1.4.5.1. Marketing Strategy

                17.1.4.5.2. Product Strategy

                17.1.4.5.3. Channel Strategy

        17.1.5. P J Chemicals

            17.1.5.1. Overview

            17.1.5.2. Product Portfolio

            17.1.5.3. Profitability by Market Segments

            17.1.5.4. Sales Footprint

            17.1.5.5. Strategy Overview

                17.1.5.5.1. Marketing Strategy

                17.1.5.5.2. Product Strategy

                17.1.5.5.3. Channel Strategy

        17.1.6. Avanschem

            17.1.6.1. Overview

            17.1.6.2. Product Portfolio

            17.1.6.3. Profitability by Market Segments

            17.1.6.4. Sales Footprint

            17.1.6.5. Strategy Overview

                17.1.6.5.1. Marketing Strategy

                17.1.6.5.2. Product Strategy

                17.1.6.5.3. Channel Strategy

        17.1.7. Showa Denko

            17.1.7.1. Overview

            17.1.7.2. Product Portfolio

            17.1.7.3. Profitability by Market Segments

            17.1.7.4. Sales Footprint

            17.1.7.5. Strategy Overview

                17.1.7.5.1. Marketing Strategy

                17.1.7.5.2. Product Strategy

                17.1.7.5.3. Channel Strategy

        17.1.8. Nabeltec AG

            17.1.8.1. Overview

            17.1.8.2. Product Portfolio

            17.1.8.3. Profitability by Market Segments

            17.1.8.4. Sales Footprint

            17.1.8.5. Strategy Overview

                17.1.8.5.1. Marketing Strategy

                17.1.8.5.2. Product Strategy

                17.1.8.5.3. Channel Strategy

        17.1.9. Huber Engineered Materials

            17.1.9.1. Overview

            17.1.9.2. Product Portfolio

            17.1.9.3. Profitability by Market Segments

            17.1.9.4. Sales Footprint

            17.1.9.5. Strategy Overview

                17.1.9.5.1. Marketing Strategy

                17.1.9.5.2. Product Strategy

                17.1.9.5.3. Channel Strategy

        17.1.10. Nashtec LLC

            17.1.10.1. Overview

            17.1.10.2. Product Portfolio

            17.1.10.3. Profitability by Market Segments

            17.1.10.4. Sales Footprint

            17.1.10.5. Strategy Overview

                17.1.10.5.1. Marketing Strategy

                17.1.10.5.2. Product Strategy

                17.1.10.5.3. Channel Strategy

        17.1.11. MAL Hungarian Aluminum

            17.1.11.1. Overview

            17.1.11.2. Product Portfolio

            17.1.11.3. Profitability by Market Segments

            17.1.11.4. Sales Footprint

            17.1.11.5. Strategy Overview

                17.1.11.5.1. Marketing Strategy

                17.1.11.5.2. Product Strategy

                17.1.11.5.3. Channel Strategy

        17.1.12. Hindalco Chemicals

            17.1.12.1. Overview

            17.1.12.2. Product Portfolio

            17.1.12.3. Profitability by Market Segments

            17.1.12.4. Sales Footprint

            17.1.12.5. Strategy Overview

                17.1.12.5.1. Marketing Strategy

                17.1.12.5.2. Product Strategy

                17.1.12.5.3. Channel Strategy

18. Assumptions & Acronyms Used

19. Research Methodology
Recommendations

Chemicals & Materials

Lithium Hydroxide Market

September 2024

REP-GB-2331

Upcoming

Chemicals & Materials

Magnesium Hydroxide Market

March 2022

REP-GB-1585

October 2023

200 pages

Chemicals & Materials

Sodium Hydroxide Market

June 2021

REP-GB-13328

February 2023

309 pages

Explore Chemicals & Materials Insights

View Reports
Future Market Insights

Aluminum Hydroxide Market