Aluminum ROPP Closure Market Size and Share Forecast Outlook 2025 to 2035

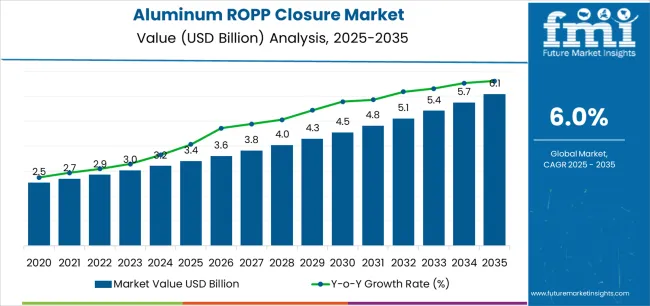
The global ROPP closures market is projected to grow from USD 736.2 million in 2025 to USD 949.5 million by 2035, registering a CAGR of 2.2% over the forecast period. Sales in 2024 were recorded at USD 720.8 million.

Quick Stats of Aluminum ROPP Closures Market

  • Market Value (2025): USD 736.2 million
  • Forecast Value (2035): USD 949.5 million
  • Forecast CAGR: 2.2%
  • Neck Size Leader in 2025: 30 mm (36.4% market share)
  • Top End Use: Alcoholic Beverage (41.7% share)
  • Key Growth Country: Europe (Turkey is the fastest-growing market with 6.7% CAGR)

Aluminium Ropp Closures Market

Metric Value
Industry Size (2025E) USD 736.2 million
Industry Value (2035F) USD 949.5 million
CAGR (2025 to 2035) 2.2%

This growth is primarily attributed to the increasing demand for tamper-evident and secure packaging solutions in the beverage, pharmaceutical, and personal care industries. Aluminum ROPP closures offer advantages such as recyclability, lightweight, and excellent barrier properties, making them a preferred choice for manufacturers aiming for sustainable and efficient packaging.

In November 2024, BERICAP, a leading global manufacturer of plastic and aluminum closures, announced the acquisition of the remaining 50% stake in BERICAP North America (BCNA) from Amcor Rigid Packaging, thereby gaining full ownership.

This strategic move aims to strengthen BERICAP's presence in the North American market and expand its product offerings in the aluminum closures segment. "The acquisition of the shares in BCNA is the most significant investment in the company’s almost 100-year history and demonstrates its strong commitment to the North American market," stated the official press release from BERICAP.

Recent innovations in aluminum ROPP closures have led to significant improvements in product functionality and customization. Manufacturers have focused on developing high-quality, secure, and durable closures that cater to the specific needs of various industries.

Advancements in printing and embossing technologies have enabled the production of visually appealing and intricate closure designs, enhancing their aesthetic value. Additionally, the integration of eco-friendly materials and sustainable practices has improved the environmental footprint of aluminum ROPP closures.

The aluminum ROPP closures market is expected to witness significant growth in emerging economies, particularly in the Asia-Pacific region, due to rapid urbanization and increasing consumer awareness. Applications are expanding beyond traditional sectors, with growing adoption in personal care and industrial packaging.

Manufacturers are anticipated to focus on developing cost-effective and versatile closure solutions to cater to diverse consumer needs and comply with evolving environmental regulations.

Semi-Annual Market Update

The below table presents the expected CAGR for the global aluminum ROPP closure market over several semi-annual periods spanning from 2025 to 2035. In the first half (H1) of the decade from 2024 to 2034, the business is predicted to surge at a CAGR of 3.2%, followed by a low growth rate of 2.6% in the second half (H2) of the same decade.

Particular Value CAGR
H1(2024 to 2034) 3.2%
H2(2024 to 2034) 2.6%
H1(2025 to 2035) 3.3%
H2(2025 to 2035) 2.5%

Moving into the subsequent period, from H1 2024 to H2 2035, the CAGR is projected to increase to 3.3% in the first half and decrease to 2.5% in the second half. In the first half (H1) the market witnessed an increase of 10 BPS while in the second half (H2), the market witnessed a decrease of 10 BPS.

Analyzing Aluminum ROPP Closures Market by Top Investment Segment

The market has been segmented based on neck size, product type, end use, printing type, manufacturing, and region. Neck sizes such as 28 mm, 30 mm, 32 mm, 34 mm, and 38 mm have been specified to fit diverse bottle openings across beverage and food categories.

Product types including standard ROPP closures, pourer insert ROPP closures, and customized designs have been incorporated to offer sealing precision, user convenience, and brand distinction. End uses have been segmented into alcoholic beverages (wine and spirit), non-alcoholic beverages (fruit juices, carbonated drinks/soda, RTD beverages), and food applications such as sauces, spices & condiments, and edible oil.

Printing types have been classified as printed and non-printed to support branding needs and bulk utility. Manufacturing has been divided into in-house manufacturing and contract manufacturing to reflect operational strategies across producers. Regional segmentation has been outlined for North America, Latin America, East Asia, South Asia & Pacific, Eastern Europe, Western Europe, Oceania, and the Middle East & Africa.

30 mm Neck Size Segment Selected for Its Standardization and Secure Fit

Aluminium Ropp Closures Market Analysis By Neck Size

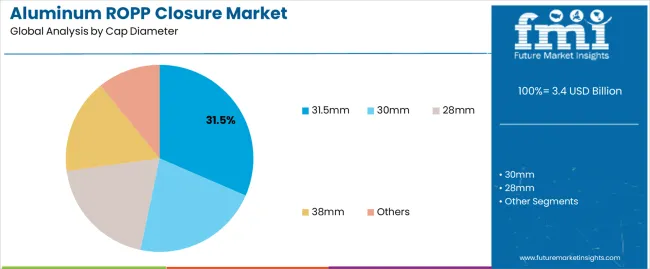
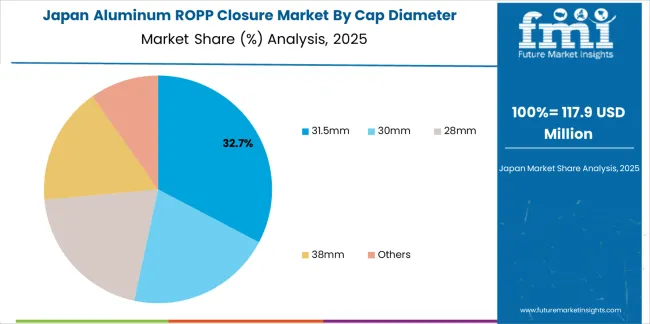
The 30 mm neck size segment is expected to hold the largest share of 36.4% in the aluminum ROPP closures market by 2025, as its use has been standardized across multiple bottling operations. Closures in this size have been applied widely in liquor, pharmaceutical, and non-carbonated beverage packaging lines for precise sealing and compatibility with automation. Torque consistency and tamper evidence have been ensured through precision threading and knurling. High-speed capping and closure integrity have been achieved across glass and PET bottle formats.

Enhanced performance on rotary and inline capping machines has contributed to their adoption in large-scale filling operations. Leakage prevention and shelf-life assurance have been maintained in both hot-fill and ambient conditions. Industry-wide preference for this neck finish has reduced changeover complexity. Demand has been projected to remain strong due to its versatility and operational reliability.

Alcoholic Beverage Segment Leads with High Consumption and Regulatory Sealing Needs

Aluminium Ropp Closures Market Analysis By End Use

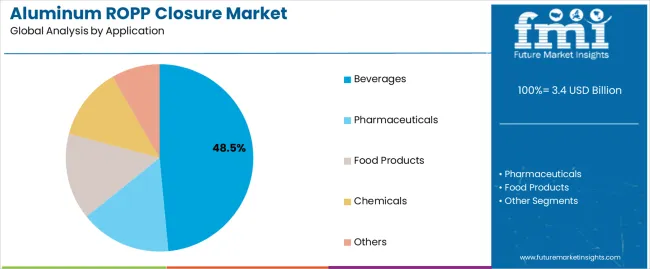
The alcoholic beverage segment is projected to account for 41.7% of the aluminum ROPP closures market in 2025, driven by global consumption trends and stringent packaging regulations. ROPP closures have been utilized extensively across spirits, wine, and liqueur packaging for tamper evidence, resealability, and visual branding. Compatibility with glass bottle finishes and pressure-sensitive labeling has enabled streamlined bottling workflows. Enhanced product protection during storage and distribution has been assured through secure closure application.

Embossed and printed cap surfaces have supported brand distinction in premium and mass-market beverage categories. Torque retention and liner adhesion have been optimized for long shelf life and leak prevention. Filling line efficiency has been maintained through integration with capping and inspection systems. Growth in both domestic and duty-free alcohol sales has reinforced the segment’s leading market position.

Key Industry Highlights

Tamper-Proof and Child-Resistant ROPP Closures Boost Pharma and Personal Care

Tamper-evident and child-resistant ROPP closures have much more stringent needs for product safety and regulatory compliance in pharmaceutical as well as personal care industries. The rules and regulations mandate the child-resistant ROPP closure for syrups, liquid medicines, and even OTC medicines to avoid any accidental ingestion especially in the presence of children. It tightens the lid on the container without making its application unreasonably elaborate to adults; hence it is very much in vogue in pharmaceutical packaging.

Huge demand in the personal care segment for premium end packaging solutions and customized ROPP closures with printing, embossing, and various decorative finishes. In such a closure, luxury fragrances, perfumes, and skincare products could be encapsulated to enhance brand appeal and differentiate itself from competition.

Anti-counterfeiting features are also being incorporated in printed closures to establish the authenticity of the product for the manufacturers. It will drive market growth within these segments, as more demand is witnessed for safe, attractive, and compliant closures.

Sustainability Push Drives Aluminum ROPP Closures Adoption Across Key Industries

One of the highly driving factors for this trend of aluminum ROPP closures is the sustainability and recyclability in packaging, as the industries are replacing plastic with some eco-friendly alternative. Aluminum can be recycled an infinite number of times, and it reduces the environmental impact along with the world's sustainability goal. This is more evident in non-alcoholic beverages, homecare products, and edible oils, where there is a strong regulatory and consumer pressure on the brands to have sustainable packaging.

However, the juice, carbonated drinks, and RTD manufacturers in the industry now opt for aluminum caps where the recyclability factor has become higher and the plastic waste factor has gone down. House care brands with cleaning solutions, liquid detergents, etc, also opt for a metal packaging closure as these set laws regarding sustainability.

Edible oil also moves because aluminum ROPP closures offer an airtight seal, thus avoiding oxidation and giving a recyclable alternative to plastic caps. Since sustainability is going to be at the top of priorities, market uptake for aluminum closures is going to surge in the near future.

Alternative Closures Challenge Aluminum ROPP Market Amid Sustainability and Cost Shifts

Growing trends of alternative closure technologies such as plastic screw caps, cork closures, and flip-top caps, are threatening aluminum ROPP closures market growth opportunities in specific markets. Traditional use of cork for wine and spirits in the beverage industry still sustains preference to aluminum closures based on premium appeal and the need to allow products to age in the bottle. In addition, plastic screw caps are increasingly being used in carbonated drinks, fruit juices, and RTD beverages because they are cheaper and lighter.

Brands are also incorporating flip-top caps and pump dispensers on items such as shampoo, lotions, and liquid soaps that will require much lesser usage of ROPP closures in personal care products. Plastic closures business also gain significantly due to emerging trends with innovations of biodegradable and PCR, a Post Consumer Recycle materials in consideration by an ecologically concerned consumers, forcing innovation from Aluminum ROPP.

Market Concentration

Tier 1 company leaders are distinguished by their extensive portfolio and use of advanced production technology. These market leaders are stand out because of their extensive expertise in manufacturing and reconditioning across multiple packaging formats and a broad geographical reach, underpinned by a robust consumer base.

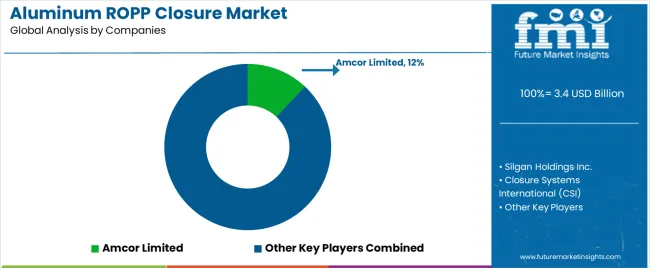
They offer a wide range of series including reconditioning, recycling, and manufacturing utilizing the latest technology and meeting the regulatory standards providing the highest quality. Prominent companies within Tier 1 include Guala Closures, Amcor Plc, and Crown Holdings Inc.

Tier 2 companies are defined by a strong presence overseas and in-depth market knowledge. These market players have good technology and ensure regulatory compliance but may not have advanced technology and wide global reach. Prominent companies in Tier 2 include Closure System International, Taiwan Hon Chuan, Bericap, Crown Seal Public Company Limited.

Tier 3 includes the majority of small-scale companies operating at the local presence and serving niche markets. These companies are notably oriented towards fulfilling local market demands and are consequently classified within the tier 3 share segment. They are small-scale players and have limited geographical reach.

Tier 3, within this context, is recognized as an unorganized market, denoting a sector characterized by a lack of extensive structure and formalization when compared to organized competitors.

Country-wise Insights

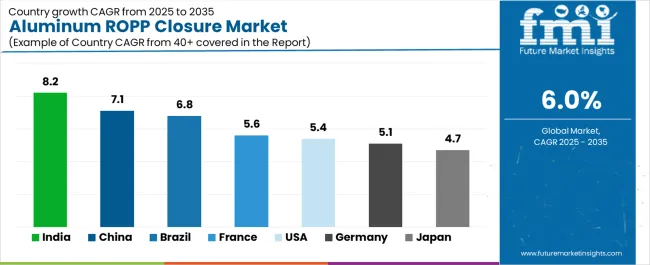
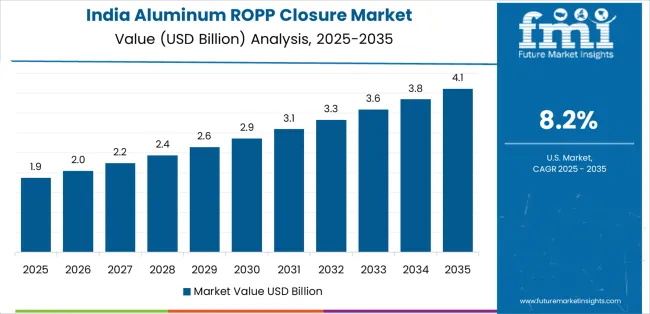
The section below covers the industry analysis for the aluminum ROPP closure market for different countries. Market demand analysis on key countries in several regions of the globe, including North America, Asia Pacific, Europe, and others, is provided. USA is anticipated to remain at the forefront in North America, with a CAGR of 2.7% through 2035. In South Asia & Pacific, India is projected to witness a CAGR of 5.5% by 2035.

Countries Value CAGR (2025 to 2035)
USA 2.7%
Canada 2.0%
Brazil 2.5%
Chile 3.4%
Germany 1.9%
China 4.2%
India 5.5%

USA Wineries Shift to Aluminum ROPP Closures for Freshness and Sustainability

Among the key drivers in the USA wine industry aluminum ROPP closure market is growing demand for screw cap closures rather than traditional cork due to its ability to prevent oxidation and facilitate convenience. There is a tendency among American wineries, mainly in regions such as California, Oregon, and Washington, toward using aluminum ROPP closures to maintain wine freshness and limit spoilage brought about by the taint in corks. These closures seal hermetically, preventing unwanted oxygen ingress while maintaining the wine's intended flavor profile.

Premium wine brands aimed at retail and e-commerce also increasingly adopt ROPP for branding and differentiation purposes. More recently, growing direct-to-consumer wine shipment has fueled a need for the resealing of aluminum in order to secure product integrity for the final destination.

The majority of this migration is observed for white wines and rosé since freshness is imperative. With sustainability on everyone's minds, wineries also prefer using aluminum closures that are 100% recyclable compared to synthetics.

Pharmaceutical Safety Regulations Fuel Germany’s Surge in Aluminum ROPP Closures

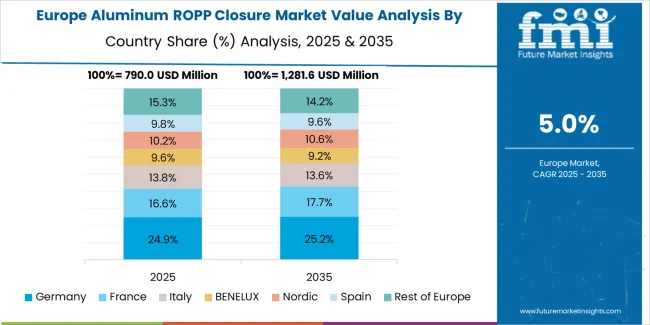
The key growth driver for Germany aluminum ROPP closure markets is the rapidly increasing demand from the pharmaceuticals industry for tamper-evident and light-weight closures. Germany is among the world's leading pharmaceuticals manufacturing and export hubs, having strict regulations compelling the use of secure and non-contaminative packaging for liquid medicines.

The use of aluminum ROPP closures for syrups, vaccines, and OTC drugs is becoming very popular among pharmaceutical companies because these closures have excellent barrier properties, preventing moisture and air ingress to ensure product stability.

Strict German government regulations concerning child-resistant packaging for prescription and pediatric medicines, have driven the manufacturer to innovate with CR-certified ROPP closures offering safety without affecting usability. Online pharmacies and prescriptions have further expanded demand for tamper-proof aluminum closures, maintaining the integrity of products during delivery. The pharma companies prefer aluminum over plastic, in pursuit of sustainable, recyclable, and circular economy-compatible goals.

Competitive Landscape

Key players operating in the aluminum ROPP closure market are investing in the development of innovative sustainable solutions and also entering into partnerships. Key aluminum ROPP closure providers have also been acquiring smaller players to grow their presence to further penetrate the aluminum ROPP closure market across multiple regions.

Key Developments in Aluminum ROPP Closures Market

Expansion

In January 2024, Thai Beverage Can Ltd., started a new production line of ROPP aluminium caps for its aluminium bottles and glass bottles thus boosting production activity.

Acquisition

  • In January 2024, Pelliconi & C. S.p.A. acquired the production assets from Novembal, a leading company specialized in the design and production of plastic caps.
  • In October 2024, Silgan Holdings Inc acquired Weener Plastics Holdings B.V., a leading producer of differentiated dispensing solutions for personal care, food and healthcare products.
  • In March 2024, Crown Holdings, Inc. has received the Aluminium Stewardship Initiative (ASI) Chain of Custody (CoC) Standard V2 (2022) Certification for its Mexican operations-the latest addition to a series of responsible sourcing credentials around the globe.

Expansion

In April 2024, BERICAP invested in a new plant in Kunshan to production capacity by 50% to help it more effectively cater to customer demand to enable local presence and ensuring short distances for both customer support and product logistics.

Key Companies

  • Amcor Rigid Plastics
  • Guala Closures North America
  • Crown Holdings, INC.
  • Closure System International (CSI)
  • United Closures & Plastics
  • Silgan Closures
  • MOCON, Inc.
  • Allstate Can Corporation
  • Tecni Plas, Inc.
  • Herti USA

Key Segments

By Product Type:

In terms of product type, the industry is divided into standard ROPP closures, child resistant ROPP closures, pourer insert ROPP closures, customized designs, and others.

By Manufacturing Process:

In terms of manufacturing process, the industry is segregated into in-house manufacturing and contract manufacturing.

By Neck Type:

By neck type, the market is divided into up to 24 mm, 24 to 38 mm, and above 38 mm.

By Printing Type:

By printing type, the market is divided into printed and non-printed.

By End Use:

The market is classified by end use such as alcoholic beverage, non-alcoholic beverage, food, pharmaceuticals, cosmetics and personal care, fragrance and perfumes, and homecare products.

By Region:

Key countries of North America, Latin America, East Asia, South Asia & Pacific, Western Europe, Eastern Europe, and the Middle East & Africa have been covered in the report.

Table of Content

  1. Executive Summary
    • Global Market Outlook
    • Demand-side Trends
    • Supply-side Trends
    • Technology Roadmap Analysis
    • Analysis and Recommendations
  2. Market Overview
    • Market Coverage/Taxonomy
    • Market Definition/Scope/Limitations
  3. Market Background
    • Market Dynamics
      • Drivers
      • Restraints
      • Opportunity
      • Trends
    • Scenario Forecast
      • Demand in Optimistic Scenario
      • Demand in Likely Scenario
      • Demand in Conservative Scenario
    • Opportunity Map Analysis
    • Product Life Cycle Analysis
    • Supply Chain Analysis
      • Supply Side Participants and their Roles
        • Producers
        • Mid-Level Participants (Traders/ Agents/ Brokers)
        • Wholesalers and Distributors
      • Value Added and Value Created at Node in the Supply Chain
      • List of Raw Material Suppliers
      • List of Existing and Potential Buyer’s
    • Investment Feasibility Matrix
    • Value Chain Analysis
      • Profit Margin Analysis
      • Wholesalers and Distributors
      • Retailers
    • PESTLE and Porter’s Analysis
    • Regulatory Landscape
      • By Key Regions
      • By Key Countries
    • Regional Parent Market Outlook
    • Production and Consumption Statistics
    • Import and Export Statistics
  4. Global Market Analysis 2020 to 2024 and Forecast, 2025 to 2035
    • Historical Market Size Value (USD Million) & Volume (Units) Analysis, 2020 to 2024
    • Current and Future Market Size Value (USD Million) & Volume (Units) Projections, 2025 to 2035
      • Y-o-Y Growth Trend Analysis
      • Absolute $ Opportunity Analysis
  5. Global Market Pricing Analysis 2020 to 2024 and Forecast 2025 to 2035
  6. Global Aluminum ROPP Closures Market Analysis 2020 to 2024 and Forecast 2025 to 2035, By Neck Size
    • Introduction/Key Findings
    • Historical Market Size Value (USD Million) & Volume (Units) Analysis By Neck Size, 2020 to 2024
    • Current and Future Market Size Value (USD Million) & Volume (Units) Analysis and Forecast By Neck Size, 2025 to 2035
      • 28 mm
      • 30mm
      • 32mm
      • 34mm
      • 38mm
    • Y-o-Y Growth Trend Analysis By Neck Size, 2020 to 2024
    • Absolute $ Opportunity Analysis By Neck Size, 2025 to 2035
  7. Global Aluminum ROPP Closures Market Analysis 2020 to 2024 and Forecast 2025 to 2035, By Product Type
    • Introduction/Key Findings
    • Historical Market Size Value (USD Million) & Volume (Units) Analysis By Product Type, 2020 to 2024
    • Current and Future Market Size Value (USD Million) & Volume (Units) Analysis and Forecast By Product Type, 2025 to 2035
      • Standard ROPP Closures
      • Pourer Insert ROPP Closures
      • Customized Designs
    • Y-o-Y Growth Trend Analysis By Product Type, 2020 to 2024
    • Absolute $ Opportunity Analysis By Product Type, 2025 to 2035
  8. Global Aluminum ROPP Closures Market Analysis 2020 to 2024 and Forecast 2025 to 2035, By End Use
    • Introduction/Key Findings
    • Historical Market Size Value (USD Million) & Volume (Units) Analysis By End Use, 2020 to 2024
    • Current and Future Market Size Value (USD Million) & Volume (Units) Analysis and Forecast By End Use, 2025 to 2035
      • Alcoholic Beverage
        • Wine
        • Spirit
      • Non Alcoholic Beverage
        • Fruit Juices
        • Carbonated Drink/Soda
        • RTD Beverages
      • Food
        • Sauces
        • Spices and Condiments
        • Edible Oil
    • Y-o-Y Growth Trend Analysis By End Use, 2020 to 2024
    • Absolute $ Opportunity Analysis By End Use, 2025 to 2035
  9. Global Aluminum ROPP Closures Market Analysis 2020 to 2024 and Forecast 2025 to 2035, By Printing Type
    • Introduction/Key Findings
    • Historical Market Size Value (USD Million) & Volume (Units) Analysis By Printing Type, 2020 to 2024
    • Current and Future Market Size Value (USD Million) & Volume (Units) Analysis and Forecast By Printing Type, 2025 to 2035
      • Printed
      • Non Printed
    • Y-o-Y Growth Trend Analysis By Printing Type, 2020 to 2024
    • Absolute $ Opportunity Analysis By Printing Type, 2025 to 2035
  10. Global Aluminum ROPP Closures Market Analysis 2020 to 2024 and Forecast 2025 to 2035, By Manufacturing
    • Introduction/Key Findings
    • Historical Market Size Value (USD Million) & Volume (Units) Analysis By Manufacturing, 2020 to 2024
    • Current and Future Market Size Value (USD Million) & Volume (Units) Analysis and Forecast By Manufacturing, 2025 to 2035
      • In-house Manufacturing
      • Contract Manufacturing
    • Y-o-Y Growth Trend Analysis By Manufacturing, 2020 to 2024
    • Absolute $ Opportunity Analysis By Manufacturing, 2025 to 2035
  11. Global Aluminum ROPP Closures Market Analysis 2020 to 2024 and Forecast 2025 to 2035, By Region
    • Introduction
    • Historical Market Size Value (USD Million) & Volume (Units) Analysis By Region, 2020 to 2024
    • Current Market Size Value (USD Million) & Volume (Units) Analysis and Forecast By Region, 2025 to 2035
      • North America
      • Latin America
      • Europe
      • East Asia
      • South Asia
      • Oceania
      • MEA
    • Market Attractiveness Analysis By Region
  12. North America Aluminum ROPP Closures Market Analysis 2020 to 2024 and Forecast 2025 to 2035, By Country
    • Historical Market Size Value (USD Million) & Volume (Units) Trend Analysis By Market Taxonomy, 2020 to 2024
    • Market Size Value (USD Million) & Volume (Units) Forecast By Market Taxonomy, 2025 to 2035
      • By Country
        • USA
        • Canada
      • By Neck Size
      • By Product Type
      • By End Use
      • By Printing Type
      • By Manufacturing
    • Market Attractiveness Analysis
      • By Country
      • By Neck Size
      • By Product Type
      • By End Use
      • By Printing Type
      • By Manufacturing
    • Key Takeaways
  13. Latin America Aluminum ROPP Closures Market Analysis 2020 to 2024 and Forecast 2025 to 2035, By Country
    • Historical Market Size Value (USD Million) & Volume (Units) Trend Analysis By Market Taxonomy, 2020 to 2024
    • Market Size Value (USD Million) & Volume (Units) Forecast By Market Taxonomy, 2025 to 2035
      • By Country
        • Brazil
        • Mexico
        • Argentina
        • Chile
        • Peru
        • Rest of Latin America
      • By Neck Size
      • By Product Type
      • By End Use
      • By Printing Type
      • By Manufacturing
    • Market Attractiveness Analysis
      • By Country
      • By Neck Size
      • By Product Type
      • By End Use
      • By Printing Type
      • By Manufacturing
    • Key Takeaways
  14. Europe Aluminum ROPP Closures Market Analysis 2020 to 2024 and Forecast 2025 to 2035, By Country
    • Historical Market Size Value (USD Million) & Volume (Units) Trend Analysis By Market Taxonomy, 2020 to 2024
    • Market Size Value (USD Million) & Volume (Units) Forecast By Market Taxonomy, 2025 to 2035
      • By Country
        • Germany
        • Italy
        • France
        • UK
        • Spain
        • Russia
        • BENELUX
        • Rest of Europe
      • By Neck Size
      • By Product Type
      • By End Use
      • By Printing Type
      • By Manufacturing
    • Market Attractiveness Analysis
      • By Country
      • By Neck Size
      • By Product Type
      • By End Use
      • By Printing Type
      • By Manufacturing
    • Key Takeaways
  15. East Asia Market Analysis 2020 to 2024 and Forecast 2025 to 2035, By Country
    • Historical Market Size Value (USD Million) & Volume (Units) Trend Analysis By Market Taxonomy, 2020 to 2024
    • Market Size Value (USD Million) & Volume (Units) Forecast By Market Taxonomy, 2025 to 2035
      • By Country
        • China
        • Japan
        • South Korea
      • By Neck Size
      • By Product Type
      • By End Use
      • By Printing Type
      • By Manufacturing
    • Market Attractiveness Analysis
      • By Country
      • By Neck Size
      • By Product Type
      • By End Use
      • By Printing Type
      • By Manufacturing
    • Key Takeaways
  16. South Asia Aluminum ROPP Closures Market Analysis 2020 to 2024 and Forecast 2025 to 2035, By Country
    • Historical Market Size Value (USD Million) & Volume (Units) Trend Analysis By Market Taxonomy, 2020 to 2024
    • Market Size Value (USD Million) & Volume (Units) Forecast By Market Taxonomy, 2025 to 2035
      • By Country
        • India
        • Thailand
        • Malaysia
        • Indonesia
        • Rest of South Asia
      • By Neck Size
      • By Product Type
      • By End Use
      • By Printing Type
      • By Manufacturing
    • Market Attractiveness Analysis
      • By Country
      • By Neck Size
      • By Product Type
      • By End Use
      • By Printing Type
      • By Manufacturing
    • Key Takeaways
  17. Oceania Aluminum ROPP Closures Market Analysis 2020 to 2024 and Forecast 2025 to 2035, By Country
    • Historical Market Size Value (USD Million) & Volume (Units) Trend Analysis By Market Taxonomy, 2020 to 2024
    • Market Size Value (USD Million) & Volume (Units) Forecast By Market Taxonomy, 2025 to 2035
      • By Country
        • Australia
        • New Zealand
      • By Neck Size
      • By Product Type
      • By End Use
      • By Printing Type
      • By Manufacturing
    • Market Attractiveness Analysis
      • By Country
      • By Neck Size
      • By Product Type
      • By End Use
      • By Printing Type
      • By Manufacturing
    • Key Takeaways
  18. MEA Aluminum ROPP Closures Market Analysis 2020 to 2024 and Forecast 2025 to 2035, By Country
    • Historical Market Size Value (USD Million) & Volume (Units) Trend Analysis By Market Taxonomy, 2020 to 2024
    • Market Size Value (USD Million) & Volume (Units) Forecast By Market Taxonomy, 2025 to 2035
      • By Country
        • GCC
        • Rest of MEA
      • By Neck Size
      • By Product Type
      • By End Use
      • By Printing Type
      • By Manufacturing
    • Market Attractiveness Analysis
      • By Country
      • By Neck Size
      • By Product Type
      • By End Use
      • By Printing Type
      • By Manufacturing
    • Key Takeaways
  19. Key Countries Aluminum ROPP Closures Market Analysis
    • USA
      • Pricing Analysis
      • Market Share Analysis, 2024
        • By Neck Size
        • By Product Type
        • By End Use
        • By Printing Type
        • By Manufacturing
    • Canada
      • Pricing Analysis
      • Market Share Analysis, 2024
        • By Neck Size
        • By Product Type
        • By End Use
        • By Printing Type
        • By Manufacturing
    • Brazil
      • Pricing Analysis
      • Market Share Analysis, 2024
        • By Neck Size
        • By Product Type
        • By End Use
        • By Printing Type
        • By Manufacturing
    • Mexico
      • Pricing Analysis
      • Market Share Analysis, 2024
        • By Neck Size
        • By Product Type
        • By End Use
        • By Printing Type
        • By Manufacturing
    • Argentina
      • Pricing Analysis
      • Market Share Analysis, 2024
        • By Neck Size
        • By Product Type
        • By End Use
        • By Printing Type
        • By Manufacturing
  20. Market Structure Analysis
    • Competition Dashboard
    • Competition Benchmarking
    • Market Share Analysis of Top Players
      • By Regional
      • By Neck Size
      • By Product Type
      • By End Use
      • By Printing Type
      • By Manufacturing
  21. Competition Analysis
    • Competition Deep Dive
      • Amcor Rigid Plastics
        • Overview
        • Product Portfolio
        • Profitability by Market Segments (Product/Age /Sales Channel/Region)
        • Sales Footprint
        • Strategy Overview
          • Marketing Strategy
          • Product Strategy
          • Channel Strategy
      • Guala Closures North America
        • Overview
        • Product Portfolio
        • Profitability by Market Segments (Product/Age /Sales Channel/Region)
        • Sales Footprint
        • Strategy Overview
          • Marketing Strategy
          • Product Strategy
          • Channel Strategy
      • Crown Holdings, INC.
        • Overview
        • Product Portfolio
        • Profitability by Market Segments (Product/Age /Sales Channel/Region)
        • Sales Footprint
        • Strategy Overview
          • Marketing Strategy
          • Product Strategy
          • Channel Strategy
      • Closure System International(CSI)
        • Overview
        • Product Portfolio
        • Profitability by Market Segments (Product/Age /Sales Channel/Region)
        • Sales Footprint
        • Strategy Overview
          • Marketing Strategy
          • Product Strategy
          • Channel Strategy
      • Value (USD Million) & Volume (Units)ed Closures & Plastics
        • Overview
        • Product Portfolio
        • Profitability by Market Segments (Product/Age /Sales Channel/Region)
        • Sales Footprint
        • Strategy Overview
          • Marketing Strategy
          • Product Strategy
          • Channel Strategy
      • Silgan Closures
        • Overview
        • Product Portfolio
        • Profitability by Market Segments (Product/Age /Sales Channel/Region)
        • Sales Footprint
        • Strategy Overview
          • Marketing Strategy
          • Product Strategy
          • Channel Strategy
      • MOCON, Inc.
        • Overview
        • Product Portfolio
        • Profitability by Market Segments (Product/Age /Sales Channel/Region)
        • Sales Footprint
        • Strategy Overview
          • Marketing Strategy
          • Product Strategy
          • Channel Strategy
      • Allstate Can Corporation
        • Overview
        • Product Portfolio
        • Profitability by Market Segments (Product/Age /Sales Channel/Region)
        • Sales Footprint
        • Strategy Overview
          • Marketing Strategy
          • Product Strategy
          • Channel Strategy
      • Tecni Plas, Inc.
        • Overview
        • Product Portfolio
        • Profitability by Market Segments (Product/Age /Sales Channel/Region)
        • Sales Footprint
        • Strategy Overview
          • Marketing Strategy
          • Product Strategy
          • Channel Strategy
      • Herti USA
        • Overview
        • Product Portfolio
        • Profitability by Market Segments (Product/Age /Sales Channel/Region)
        • Sales Footprint
        • Strategy Overview
          • Marketing Strategy
          • Product Strategy
          • Channel Strategy
  22. Assumptions & Acronyms Used
  23. Research Methodology

List of Tables

  • Table 1: Global Market Value (USD Million) Forecast by Region, 2020-2035
  • Table 2: Global Market Volume (Units) Forecast by Region, 2020-2035
  • Table 3: Global Market Value (USD Million) Forecast by Neck Size, 2020-2035
  • Table 4: Global Market Volume (Units) Forecast by Neck Size, 2020-2035
  • Table 5: Global Market Value (USD Million) Forecast by Product Type, 2020-2035
  • Table 6: Global Market Volume (Units) Forecast by Product Type, 2020-2035
  • Table 7: Global Market Value (USD Million) Forecast by End Use, 2020-2035
  • Table 8: Global Market Volume (Units) Forecast by End Use, 2020-2035
  • Table 9: Global Market Value (USD Million) Forecast by Printing Type, 2020-2035
  • Table 10: Global Market Volume (Units) Forecast by Printing Type, 2020-2035
  • Table 11: Global Market Value (USD Million) Forecast by Manufacturing, 2020-2035
  • Table 12: Global Market Volume (Units) Forecast by Manufacturing, 2020-2035
  • Table 13: North America Market Value (USD Million) Forecast by Country, 2020-2035
  • Table 14: North America Market Volume (Units) Forecast by Country, 2020-2035
  • Table 15: North America Market Value (USD Million) Forecast by Neck Size, 2020-2035
  • Table 16: North America Market Volume (Units) Forecast by Neck Size, 2020-2035
  • Table 17: North America Market Value (USD Million) Forecast by Product Type, 2020-2035
  • Table 18: North America Market Volume (Units) Forecast by Product Type, 2020-2035
  • Table 19: North America Market Value (USD Million) Forecast by End Use, 2020-2035
  • Table 20: North America Market Volume (Units) Forecast by End Use, 2020-2035
  • Table 21: North America Market Value (USD Million) Forecast by Printing Type, 2020-2035
  • Table 22: North America Market Volume (Units) Forecast by Printing Type, 2020-2035
  • Table 23: North America Market Value (USD Million) Forecast by Manufacturing, 2020-2035
  • Table 24: North America Market Volume (Units) Forecast by Manufacturing, 2020-2035
  • Table 25: Latin America Market Value (USD Million) Forecast by Country, 2020-2035
  • Table 26: Latin America Market Volume (Units) Forecast by Country, 2020-2035
  • Table 27: Latin America Market Value (USD Million) Forecast by Neck Size, 2020-2035
  • Table 28: Latin America Market Volume (Units) Forecast by Neck Size, 2020-2035
  • Table 29: Latin America Market Value (USD Million) Forecast by Product Type, 2020-2035
  • Table 30: Latin America Market Volume (Units) Forecast by Product Type, 2020-2035
  • Table 31: Latin America Market Value (USD Million) Forecast by End Use, 2020-2035
  • Table 32: Latin America Market Volume (Units) Forecast by End Use, 2020-2035
  • Table 33: Latin America Market Value (USD Million) Forecast by Printing Type, 2020-2035
  • Table 34: Latin America Market Volume (Units) Forecast by Printing Type, 2020-2035
  • Table 35: Latin America Market Value (USD Million) Forecast by Manufacturing, 2020-2035
  • Table 36: Latin America Market Volume (Units) Forecast by Manufacturing, 2020-2035
  • Table 37: Europe Market Value (USD Million) Forecast by Country, 2020-2035
  • Table 38: Europe Market Volume (Units) Forecast by Country, 2020-2035
  • Table 39: Europe Market Value (USD Million) Forecast by Neck Size, 2020-2035
  • Table 40: Europe Market Volume (Units) Forecast by Neck Size, 2020-2035
  • Table 41: Europe Market Value (USD Million) Forecast by Product Type, 2020-2035
  • Table 42: Europe Market Volume (Units) Forecast by Product Type, 2020-2035
  • Table 43: Europe Market Value (USD Million) Forecast by End Use, 2020-2035
  • Table 44: Europe Market Volume (Units) Forecast by End Use, 2020-2035
  • Table 45: Europe Market Value (USD Million) Forecast by Printing Type, 2020-2035
  • Table 46: Europe Market Volume (Units) Forecast by Printing Type, 2020-2035
  • Table 47: Europe Market Value (USD Million) Forecast by Manufacturing, 2020-2035
  • Table 48: Europe Market Volume (Units) Forecast by Manufacturing, 2020-2035
  • Table 49: East Asia Market Value (USD Million) Forecast by Country, 2020-2035
  • Table 50: East Asia Market Volume (Units) Forecast by Country, 2020-2035
  • Table 51: East Asia Market Value (USD Million) Forecast by Neck Size, 2020-2035
  • Table 52: East Asia Market Volume (Units) Forecast by Neck Size, 2020-2035
  • Table 53: East Asia Market Value (USD Million) Forecast by Product Type, 2020-2035
  • Table 54: East Asia Market Volume (Units) Forecast by Product Type, 2020-2035
  • Table 55: East Asia Market Value (USD Million) Forecast by End Use, 2020-2035
  • Table 56: East Asia Market Volume (Units) Forecast by End Use, 2020-2035
  • Table 57: East Asia Market Value (USD Million) Forecast by Printing Type, 2020-2035
  • Table 58: East Asia Market Volume (Units) Forecast by Printing Type, 2020-2035
  • Table 59: East Asia Market Value (USD Million) Forecast by Manufacturing, 2020-2035
  • Table 60: East Asia Market Volume (Units) Forecast by Manufacturing, 2020-2035
  • Table 61: South Asia Market Value (USD Million) Forecast by Country, 2020-2035
  • Table 62: South Asia Market Volume (Units) Forecast by Country, 2020-2035
  • Table 63: South Asia Market Value (USD Million) Forecast by Neck Size, 2020-2035
  • Table 64: South Asia Market Volume (Units) Forecast by Neck Size, 2020-2035
  • Table 65: South Asia Market Value (USD Million) Forecast by Product Type, 2020-2035
  • Table 66: South Asia Market Volume (Units) Forecast by Product Type, 2020-2035
  • Table 67: South Asia Market Value (USD Million) Forecast by End Use, 2020-2035
  • Table 68: South Asia Market Volume (Units) Forecast by End Use, 2020-2035
  • Table 69: South Asia Market Value (USD Million) Forecast by Printing Type, 2020-2035
  • Table 70: South Asia Market Volume (Units) Forecast by Printing Type, 2020-2035
  • Table 71: South Asia Market Value (USD Million) Forecast by Manufacturing, 2020-2035
  • Table 72: South Asia Market Volume (Units) Forecast by Manufacturing, 2020-2035
  • Table 73: Oceania Market Value (USD Million) Forecast by Country, 2020-2035
  • Table 74: Oceania Market Volume (Units) Forecast by Country, 2020-2035
  • Table 75: Oceania Market Value (USD Million) Forecast by Neck Size, 2020-2035
  • Table 76: Oceania Market Volume (Units) Forecast by Neck Size, 2020-2035
  • Table 77: Oceania Market Value (USD Million) Forecast by Product Type, 2020-2035
  • Table 78: Oceania Market Volume (Units) Forecast by Product Type, 2020-2035
  • Table 79: Oceania Market Value (USD Million) Forecast by End Use, 2020-2035
  • Table 80: Oceania Market Volume (Units) Forecast by End Use, 2020-2035
  • Table 81: Oceania Market Value (USD Million) Forecast by Printing Type, 2020-2035
  • Table 82: Oceania Market Volume (Units) Forecast by Printing Type, 2020-2035
  • Table 83: Oceania Market Value (USD Million) Forecast by Manufacturing, 2020-2035
  • Table 84: Oceania Market Volume (Units) Forecast by Manufacturing, 2020-2035
  • Table 85: MEA Market Value (USD Million) Forecast by Country, 2020-2035
  • Table 86: MEA Market Volume (Units) Forecast by Country, 2020-2035
  • Table 87: MEA Market Value (USD Million) Forecast by Neck Size, 2020-2035
  • Table 88: MEA Market Volume (Units) Forecast by Neck Size, 2020-2035
  • Table 89: MEA Market Value (USD Million) Forecast by Product Type, 2020-2035
  • Table 90: MEA Market Volume (Units) Forecast by Product Type, 2020-2035
  • Table 91: MEA Market Value (USD Million) Forecast by End Use, 2020-2035
  • Table 92: MEA Market Volume (Units) Forecast by End Use, 2020-2035
  • Table 93: MEA Market Value (USD Million) Forecast by Printing Type, 2020-2035
  • Table 94: MEA Market Volume (Units) Forecast by Printing Type, 2020-2035
  • Table 95: MEA Market Value (USD Million) Forecast by Manufacturing, 2020-2035
  • Table 96: MEA Market Volume (Units) Forecast by Manufacturing, 2020-2035

List of Figures

  • Figure 1: Global Market Volume (Units) Forecast 2020-2035
  • Figure 2: Global Market Pricing Analysis
  • Figure 3: Global Market Value (USD Million) Forecast 2020-2035
  • Figure 4: Global Market Value Share and BPS Analysis by Neck Size, 2025 and 2035
  • Figure 5: Global Market Y-o-Y Growth Comparison by Neck Size, 2025-2035
  • Figure 6: Global Market Attractiveness Analysis by Neck Size
  • Figure 7: Global Market Value Share and BPS Analysis by Product Type, 2025 and 2035
  • Figure 8: Global Market Y-o-Y Growth Comparison by Product Type, 2025-2035
  • Figure 9: Global Market Attractiveness Analysis by Product Type
  • Figure 10: Global Market Value Share and BPS Analysis by End Use, 2025 and 2035
  • Figure 11: Global Market Y-o-Y Growth Comparison by End Use, 2025-2035
  • Figure 12: Global Market Attractiveness Analysis by End Use
  • Figure 13: Global Market Value Share and BPS Analysis by Printing Type, 2025 and 2035
  • Figure 14: Global Market Y-o-Y Growth Comparison by Printing Type, 2025-2035
  • Figure 15: Global Market Attractiveness Analysis by Printing Type
  • Figure 16: Global Market Value Share and BPS Analysis by Manufacturing, 2025 and 2035
  • Figure 17: Global Market Y-o-Y Growth Comparison by Manufacturing, 2025-2035
  • Figure 18: Global Market Attractiveness Analysis by Manufacturing
  • Figure 19: Global Market Value (USD Million) Share and BPS Analysis by Region, 2025 and 2035
  • Figure 20: Global Market Y-o-Y Growth Comparison by Region, 2025-2035
  • Figure 21: Global Market Attractiveness Analysis by Region
  • Figure 22: North America Market Incremental $ Opportunity, 2025-2035
  • Figure 23: Latin America Market Incremental $ Opportunity, 2025-2035
  • Figure 24: Europe Market Incremental $ Opportunity, 2025-2035
  • Figure 25: East Asia Market Incremental $ Opportunity, 2025-2035
  • Figure 26: South Asia Market Incremental $ Opportunity, 2025-2035
  • Figure 27: Oceania Market Incremental $ Opportunity, 2025-2035
  • Figure 28: MEA Market Incremental $ Opportunity, 2025-2035
  • Figure 29: North America Market Value Share and BPS Analysis by Country, 2025 and 2035
  • Figure 30: North America Market Value Share and BPS Analysis by Neck Size, 2025 and 2035
  • Figure 31: North America Market Y-o-Y Growth Comparison by Neck Size, 2025-2035
  • Figure 32: North America Market Attractiveness Analysis by Neck Size
  • Figure 33: North America Market Value Share and BPS Analysis by Product Type, 2025 and 2035
  • Figure 34: North America Market Y-o-Y Growth Comparison by Product Type, 2025-2035
  • Figure 35: North America Market Attractiveness Analysis by Product Type
  • Figure 36: North America Market Value Share and BPS Analysis by End Use, 2025 and 2035
  • Figure 37: North America Market Y-o-Y Growth Comparison by End Use, 2025-2035
  • Figure 38: North America Market Attractiveness Analysis by End Use
  • Figure 39: North America Market Value Share and BPS Analysis by Printing Type, 2025 and 2035
  • Figure 40: North America Market Y-o-Y Growth Comparison by Printing Type, 2025-2035
  • Figure 41: North America Market Attractiveness Analysis by Printing Type
  • Figure 42: North America Market Value Share and BPS Analysis by Manufacturing, 2025 and 2035
  • Figure 43: North America Market Y-o-Y Growth Comparison by Manufacturing, 2025-2035
  • Figure 44: North America Market Attractiveness Analysis by Manufacturing
  • Figure 45: Latin America Market Value Share and BPS Analysis by Country, 2025 and 2035
  • Figure 46: Latin America Market Value Share and BPS Analysis by Neck Size, 2025 and 2035
  • Figure 47: Latin America Market Y-o-Y Growth Comparison by Neck Size, 2025-2035
  • Figure 48: Latin America Market Attractiveness Analysis by Neck Size
  • Figure 49: Latin America Market Value Share and BPS Analysis by Product Type, 2025 and 2035
  • Figure 50: Latin America Market Y-o-Y Growth Comparison by Product Type, 2025-2035
  • Figure 51: Latin America Market Attractiveness Analysis by Product Type
  • Figure 52: Latin America Market Value Share and BPS Analysis by End Use, 2025 and 2035
  • Figure 53: Latin America Market Y-o-Y Growth Comparison by End Use, 2025-2035
  • Figure 54: Latin America Market Attractiveness Analysis by End Use
  • Figure 55: Latin America Market Value Share and BPS Analysis by Printing Type, 2025 and 2035
  • Figure 56: Latin America Market Y-o-Y Growth Comparison by Printing Type, 2025-2035
  • Figure 57: Latin America Market Attractiveness Analysis by Printing Type
  • Figure 58: Latin America Market Value Share and BPS Analysis by Manufacturing, 2025 and 2035
  • Figure 59: Latin America Market Y-o-Y Growth Comparison by Manufacturing, 2025-2035
  • Figure 60: Latin America Market Attractiveness Analysis by Manufacturing
  • Figure 61: Europe Market Value Share and BPS Analysis by Country, 2025 and 2035
  • Figure 62: Europe Market Value Share and BPS Analysis by Neck Size, 2025 and 2035
  • Figure 63: Europe Market Y-o-Y Growth Comparison by Neck Size, 2025-2035
  • Figure 64: Europe Market Attractiveness Analysis by Neck Size
  • Figure 65: Europe Market Value Share and BPS Analysis by Product Type, 2025 and 2035
  • Figure 66: Europe Market Y-o-Y Growth Comparison by Product Type, 2025-2035
  • Figure 67: Europe Market Attractiveness Analysis by Product Type
  • Figure 68: Europe Market Value Share and BPS Analysis by End Use, 2025 and 2035
  • Figure 69: Europe Market Y-o-Y Growth Comparison by End Use, 2025-2035
  • Figure 70: Europe Market Attractiveness Analysis by End Use
  • Figure 71: Europe Market Value Share and BPS Analysis by Printing Type, 2025 and 2035
  • Figure 72: Europe Market Y-o-Y Growth Comparison by Printing Type, 2025-2035
  • Figure 73: Europe Market Attractiveness Analysis by Printing Type
  • Figure 74: Europe Market Value Share and BPS Analysis by Manufacturing, 2025 and 2035
  • Figure 75: Europe Market Y-o-Y Growth Comparison by Manufacturing, 2025-2035
  • Figure 76: Europe Market Attractiveness Analysis by Manufacturing
  • Figure 77: East Asia Market Value Share and BPS Analysis by Country, 2025 and 2035
  • Figure 78: East Asia Market Value Share and BPS Analysis by Neck Size, 2025 and 2035
  • Figure 79: East Asia Market Y-o-Y Growth Comparison by Neck Size, 2025-2035
  • Figure 80: East Asia Market Attractiveness Analysis by Neck Size
  • Figure 81: East Asia Market Value Share and BPS Analysis by Product Type, 2025 and 2035
  • Figure 82: East Asia Market Y-o-Y Growth Comparison by Product Type, 2025-2035
  • Figure 83: East Asia Market Attractiveness Analysis by Product Type
  • Figure 84: East Asia Market Value Share and BPS Analysis by End Use, 2025 and 2035
  • Figure 85: East Asia Market Y-o-Y Growth Comparison by End Use, 2025-2035
  • Figure 86: East Asia Market Attractiveness Analysis by End Use
  • Figure 87: East Asia Market Value Share and BPS Analysis by Printing Type, 2025 and 2035
  • Figure 88: East Asia Market Y-o-Y Growth Comparison by Printing Type, 2025-2035
  • Figure 89: East Asia Market Attractiveness Analysis by Printing Type
  • Figure 90: East Asia Market Value Share and BPS Analysis by Manufacturing, 2025 and 2035
  • Figure 91: East Asia Market Y-o-Y Growth Comparison by Manufacturing, 2025-2035
  • Figure 92: East Asia Market Attractiveness Analysis by Manufacturing
  • Figure 93: South Asia Market Value Share and BPS Analysis by Country, 2025 and 2035
  • Figure 94: South Asia Market Value Share and BPS Analysis by Neck Size, 2025 and 2035
  • Figure 95: South Asia Market Y-o-Y Growth Comparison by Neck Size, 2025-2035
  • Figure 96: South Asia Market Attractiveness Analysis by Neck Size
  • Figure 97: South Asia Market Value Share and BPS Analysis by Product Type, 2025 and 2035
  • Figure 98: South Asia Market Y-o-Y Growth Comparison by Product Type, 2025-2035
  • Figure 99: South Asia Market Attractiveness Analysis by Product Type
  • Figure 100: South Asia Market Value Share and BPS Analysis by End Use, 2025 and 2035
  • Figure 101: South Asia Market Y-o-Y Growth Comparison by End Use, 2025-2035
  • Figure 102: South Asia Market Attractiveness Analysis by End Use
  • Figure 103: South Asia Market Value Share and BPS Analysis by Printing Type, 2025 and 2035
  • Figure 104: South Asia Market Y-o-Y Growth Comparison by Printing Type, 2025-2035
  • Figure 105: South Asia Market Attractiveness Analysis by Printing Type
  • Figure 106: South Asia Market Value Share and BPS Analysis by Manufacturing, 2025 and 2035
  • Figure 107: South Asia Market Y-o-Y Growth Comparison by Manufacturing, 2025-2035
  • Figure 108: South Asia Market Attractiveness Analysis by Manufacturing
  • Figure 109: Oceania Market Value Share and BPS Analysis by Country, 2025 and 2035
  • Figure 110: Oceania Market Value Share and BPS Analysis by Neck Size, 2025 and 2035
  • Figure 111: Oceania Market Y-o-Y Growth Comparison by Neck Size, 2025-2035
  • Figure 112: Oceania Market Attractiveness Analysis by Neck Size
  • Figure 113: Oceania Market Value Share and BPS Analysis by Product Type, 2025 and 2035
  • Figure 114: Oceania Market Y-o-Y Growth Comparison by Product Type, 2025-2035
  • Figure 115: Oceania Market Attractiveness Analysis by Product Type
  • Figure 116: Oceania Market Value Share and BPS Analysis by End Use, 2025 and 2035
  • Figure 117: Oceania Market Y-o-Y Growth Comparison by End Use, 2025-2035
  • Figure 118: Oceania Market Attractiveness Analysis by End Use
  • Figure 119: Oceania Market Value Share and BPS Analysis by Printing Type, 2025 and 2035
  • Figure 120: Oceania Market Y-o-Y Growth Comparison by Printing Type, 2025-2035
  • Figure 121: Oceania Market Attractiveness Analysis by Printing Type
  • Figure 122: Oceania Market Value Share and BPS Analysis by Manufacturing, 2025 and 2035
  • Figure 123: Oceania Market Y-o-Y Growth Comparison by Manufacturing, 2025-2035
  • Figure 124: Oceania Market Attractiveness Analysis by Manufacturing
  • Figure 125: MEA Market Value Share and BPS Analysis by Country, 2025 and 2035
  • Figure 126: MEA Market Value Share and BPS Analysis by Neck Size, 2025 and 2035
  • Figure 127: MEA Market Y-o-Y Growth Comparison by Neck Size, 2025-2035
  • Figure 128: MEA Market Attractiveness Analysis by Neck Size
  • Figure 129: MEA Market Value Share and BPS Analysis by Product Type, 2025 and 2035
  • Figure 130: MEA Market Y-o-Y Growth Comparison by Product Type, 2025-2035
  • Figure 131: MEA Market Attractiveness Analysis by Product Type
  • Figure 132: MEA Market Value Share and BPS Analysis by End Use, 2025 and 2035
  • Figure 133: MEA Market Y-o-Y Growth Comparison by End Use, 2025-2035
  • Figure 134: MEA Market Attractiveness Analysis by End Use
  • Figure 135: MEA Market Value Share and BPS Analysis by Printing Type, 2025 and 2035
  • Figure 136: MEA Market Y-o-Y Growth Comparison by Printing Type, 2025-2035
  • Figure 137: MEA Market Attractiveness Analysis by Printing Type
  • Figure 138: MEA Market Value Share and BPS Analysis by Manufacturing, 2025 and 2035
  • Figure 139: MEA Market Y-o-Y Growth Comparison by Manufacturing, 2025-2035
  • Figure 140: MEA Market Attractiveness Analysis by Manufacturing
  • Figure 141: Global Market - Tier Structure Analysis
  • Figure 142: Global Market - Company Share Analysis

Frequently Asked Questions

What is the future of global aluminum ROPP closure industry?

The global aluminum ROPP closure industry is projected to witness CAGR of 2.2% between 2025 and 2035.

What was the worth of the global aluminum ROPP closure industry in 2024?

The global aluminum ROPP closure industry stood at USD 3,123.6 million in 2024.

What will the worth of global aluminum ROPP closure industry by 2035 end?

The global aluminum ROPP closure industry is anticipated to reach USD 949.5 million by 2035 end.

Which region to showcase the highest CAGR during forecast period?

South Asia & Pacific region is set to record the highest CAGR of 5.2% in the assessment period.

Who are the key manufacturer of global aluminum ROPP closure industry?

The key players operating in the global aluminum ROPP closure industry include Guala Closures, Amcor Plc, and Crown Holdings Inc.

Explore Similar Insights

Future Market Insights

Aluminum ROPP Closure Market