Reports

- Global Locations -

Headquarters

Future Market Insights, Inc.

Christiana Corporate, 200
Continental Drive, Suite 401,
Newark, Delaware - 19713,
United States

T: +1-845-579-5705

Americas

Future Market Insights, Inc.

616 Corporate Way, Suite 2-9018,
Valley Cottage, NY 10989, United States

T: +1-347-918-3531

MEA

Future Market Insights

1602-6 Jumeirah Bay X2 Tower, Plot No: JLT-PH2-X2A,
Jumeirah Lakes Towers, Dubai,
United Arab Emirates

Europe

Future Market Insights

3rd Floor, 207 Regent Street,
W1B 3HH London
United Kingdom

T: + 44 (0) 20 8123 9659
D: +44 (0) 20 3287 4268

Asia Pacific

Future Market Insights

IndiaLand Global Tech Park, Unit UG-1, Behind Grand HighStreet, Phase 1, Hinjawadi, MH, Pune – 411057, India

Aluminum Cap & Closure Market Overview

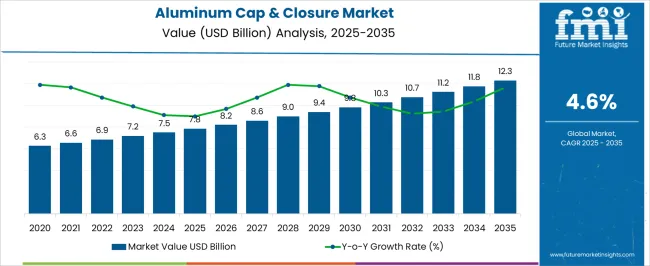
The global aluminum cap & closure market is expected to grow at a CAGR of 4.6% from 2024 to 2034. The market value is projected to increase from US$ 7.5 billion in 2024 to US$ 11.8 billion by 2034.

Aluminum Cap & Closure Market Size, Analysis, and Insights

  • The growth in the global beverage industry, particularly in the carbonated soft drink (CSD) and beer segments, is driving the market. These industries require reliable and secure packaging to maintain the quality and freshness of their products, and aluminum caps and closures have proven to be an effective solution.
  • The increasing awareness among consumers about the importance of sustainable packaging is further fueling market growth.
  • Aluminum is a highly recyclable material, and its use in caps and closures is seen as an eco-friendly alternative to plastic.
  • As more consumers become environmentally conscious, they are more likely to choose products with sustainable packaging, and this trend is expected to drive growth in the aluminum cap and closure market.
  • Rise in eCommerce is also contributing to the growth of the market.
  • As more consumers turn to online shopping, there is a need for packaging that can withstand the rigors of transportation and protect the products inside.
  • Aluminum caps and closures are known for their durability and tamper-evident properties, making them an ideal choice for eCommerce packaging.
  • The increasing demand for convenience and on-the-go products has also boosted the market for aluminum caps and closures.
  • These products require easy-to-use and secure packaging, and aluminum caps and closures offer a reliable solution.
  • This trend is particularly evident in the food and beverage industry, where single-serve packaging is becoming increasingly popular.
Attributes Details
Aluminum Cap & Closure Market Size, 2024 US$ 7.5 billion
Expected Market Valuation, 2034 US$ 11.8 billion
Value-based CAGR (2024 to 2034) 4.6%

Don't pay for what you don't need

Customize your report by selecting specific countries or regions and save 30%!

Key Opportunities for the Aluminum Cap & Closure Market

  • With the increasing awareness and concern about environmental issues, there is a growing demand for eco-friendly packaging solutions that can reduce waste and carbon footprint.
  • Aluminum closures are recyclable and can be used multiple times, making them an ideal choice for sustainable packaging.
  • With the increasing competition in the market, companies are looking for ways to differentiate their products from others, propelling demand for premium packaging solutions.
  • The use of high-quality aluminum closures can help companies enhance the perceived value of their products and create a premium image in the minds of consumers.
  • The emergence of eCommerce is also creating new opportunities for market players in the aluminum cap & closure market.
  • With the growing trend of online shopping, companies are looking for packaging solutions that can protect their products during transit.
  • Aluminum closures can provide the required protection and ensure that the products reach consumers in good condition.
  • Market players can leverage these opportunities to expand their business and gain a competitive advantage in the market.

Challenges in the Aluminum Cap & Closure Market

  • With the growing number of players in the market, companies need to focus on product innovation, quality, and pricing to remain competitive.
  • The increasing pressure to reduce costs while maintaining quality is another challenge that companies face.
  • The fluctuating prices of aluminum and other materials used to manufacture caps and closures can vary widely depending on global supply and demand trends.
  • This can make it difficult for companies to predict their costs and plans for the future.
  • Regulatory compliance is another challenge that companies face.
  • As governments around the world continue to introduce new regulations and standards related to packaging materials, companies must ensure that their products comply with these regulations.
  • This can involve significant investment in testing and certification, which can be a burden for smaller players in the market.
Ismail Sutaria
Ismail Sutaria

Principal Consultant

Talk to Analyst

Find your sweet spots for generating winning opportunities in this market.

Comparative View of Adjacent Markets

Aside from the aluminum cap & closure market, key attributes of two other related markets have been highlighted in the tables below. The two additional markets are related to aluminum industry. The markets are the global aluminum foil market and the aluminum market.

Aluminum Cap & Closure Market:

Attributes Aluminum Cap & Closure Market
Value-based CAGR (2024 to 2034) 4.6%
Market Trends Increasing demand for convenience and on-the-go products
Growth Opportunities Growing demand for sustainable packaging solutions

Aluminum Foil Market:

Attributes Aluminum Foil Market
Value-based CAGR (2024 to 2034) 5.6%
Market Trends consumers' inclination toward hygienic and convenient packaging solutions is impacting the market growth
Growth Factor Growing demand for pharmaceutical packaging is creating opportunities for the aluminum foil packaging industry

Aluminum Market:

Attributes Aluminum Market
Value-based CAGR (2024 to 2034) 4.2%
Market Trends increasing use of aluminum in the automotive industry
Growth Factor increasing urbanization and industrialization across the globe

Category-wise Insights

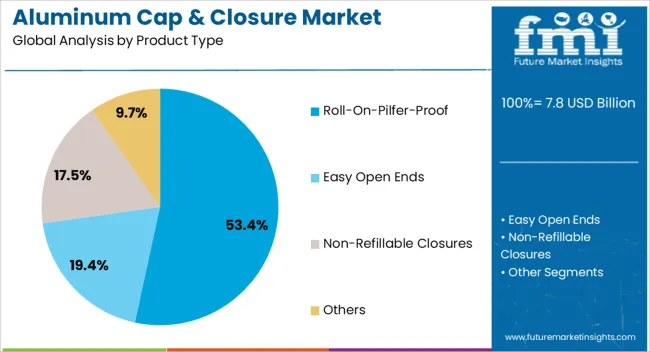
The Roll-On-Pilfer-Proof Segment Dominates the Market by Product Type

Attributes Details
Product Type Roll-On-Pilfer-Proof
CAGR (2024 to 2034) 4.5%
  • This type of closure consists of a plastic insert with a rolling ball that can be easily applied to the bottle's neck, providing an airtight seal that prevents leakage and contamination.
  • The unique design provides a tamper-evident feature, which drives the product demand.
  • The pilfer-proof feature ensures that the product remains intact and secure during transportation and storage.
  • This makes it an ideal choice for packaging industries, especially for pharmaceuticals, food, and beverage industries, where product safety and integrity are of utmost importance.
  • The convenience of use, easy application, and cost-effectiveness of roll-on-pilfer-proof closures have made them a popular choice for consumers as well.

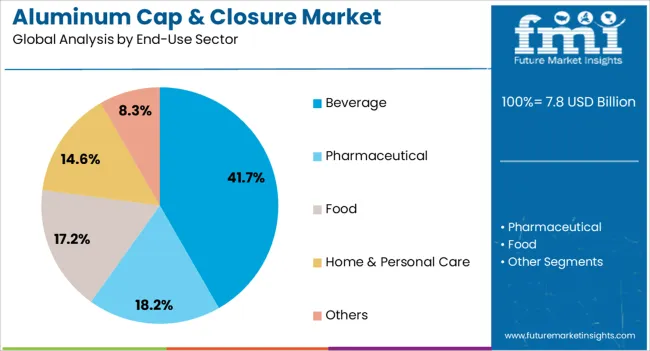
The Beverage Segment Dominates the Market by End-Use Sector

Attributes Details
End-Use Sector Beverage
CAGR (2024 to 2034) 4.4%
  • The demand for bottled beverages has been on the rise in recent years. This has led to an increase in demand for aluminum caps and closures, as they provide a secure and airtight seal for beverages.
  • Aluminum caps and closures offer several advantages over other materials, such as plastic or cork. They are lightweight, durable, and can be easily recycled.
  • They provide excellent protection against oxygen and moisture, which helps to preserve the freshness and quality of beverages.
  • Aluminum caps and closures are widely used in the beverage industry due to their compatibility with different types of containers and filling machines.

Get the data you need at a Fraction of the cost

Personalize your report by choosing insights you need
and save 40%!

Country-wise insights

Countries CAGR (2024 to 2034)
United States 4.9%
United Kingdom 5.8%
China 5.3%
Japan 5.1%
South Korea 6.0%

Growing Awareness among Consumers about Sustainability and Environmental Concerns in the United States

  • The growing packaging industry in the country is driving the market forward.
  • With the rise of eCommerce and online shopping, the demand for efficient and secure packaging has also increased.
  • Aluminum caps and closures provide a reliable and safe packaging solution for various products such as beverages, pharmaceuticals, personal care products, and more.
  • The increasing demand for aluminum caps and closures in the United States is due to the growing awareness among consumers about sustainability and environmental concerns.
  • Aluminum is a highly recyclable material that can be recycled infinitely without losing its quality. This makes it an eco-friendly and sustainable choice for packaging, which is becoming increasingly important for consumers.

Rising Awareness Regarding Eco-friendly Environment in the United Kingdom

  • The increasing awareness among consumers about the environmental impact of packaging materials is bolstering product demand.
  • The United Kingdom has set ambitious targets to reduce plastic waste, and this has led to a shift towards more sustainable packaging solutions such as aluminum caps and closures.
  • With the increasing energy demand in the United Kingdom, the industry is constantly looking for ways to improve efficiency and reduce costs.
  • The United Kingdom has a robust manufacturing industry, and the demand for aluminum caps and closures has led to a rise in the production of these products.
  • The country has well-established infrastructure and logistics networks that make it easy for companies to import and export goods.
  • This has made it easier for manufacturers to distribute their products across the country and beyond.

Improved Manufacturing Capabilities in China

  • China is the world's most populous country and has a rapidly growing middle class. As people's incomes rise, they tend to consume more packaged goods, including beverages and food items, which require caps and closures.
  • The growth of eCommerce in China has led to an increase in demand for packaging materials, including aluminum caps and closures.
  • China has also become a major producer of aluminum caps and closures.
  • The country's manufacturing capabilities have improved significantly, and it now has a large number of companies that specialize in manufacturing these products.
  • This has led to increased competition and lower prices for consumers.
  • The Chinese government has been investing heavily in infrastructure and urbanization.
  • The construction of new buildings, transportation systems, and other infrastructure projects requires a significant amount of aluminum, which has contributed to the growth of the aluminum industry in China.

Increasing Beverage Industry in Japan

  • The growth of the beverage industry in Japan has led to an increased demand for aluminum caps and closures for bottles.
  • Aluminum caps and closures are popular in the beverage industry due to their lightweight and easy-to-use design, as well as their ability to maintain the freshness of the contents.
  • The increasing popularity of online shopping has also contributed to the growth of the aluminum cap & closure market in Japan.
  • As more people turn to online shopping, the demand for packaging materials, including aluminum caps and closures, has increased.
  • This is because online retailers need to ensure that their products are packaged safely and securely for shipping and delivery.
  • Aluminum is a highly recyclable material, and as more companies in Japan prioritize sustainable practices, the demand for aluminum caps and closures has increased, focusing on sustainability.

Rising Pharmaceutical Industry in South Korea

  • The pharmaceutical industry in South Korea has contributed to the demand for aluminum caps and closures.
  • The use of aluminum packaging for medicines and drugs has become increasingly popular due to its durability and ability to protect the contents from external factors such as moisture and air. This has led to an increase in demand for aluminum caps and closures in the pharmaceutical industry.
  • South Korea's growing economy and rising disposable income have led to an increase in consumer spending.
  • This has resulted in a higher demand for packaged goods, including food, beverages, and cosmetics, which also use aluminum caps and closures.
  • As a result, the aluminum cap & closure market in South Korea is expected to continue to grow in the coming years.

Competitive Landscape

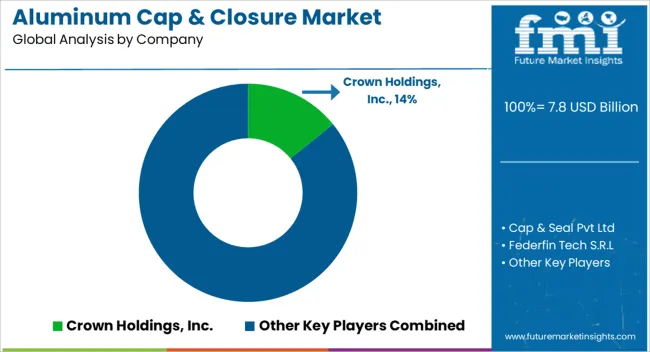
The aluminum cap and closure market is highly competitive, with many players offering a wide range of products and services. Companies have a strong presence in the market owing to their extensive distribution networks, innovative product offerings, and strong brand recognition.

However, smaller players are also gaining traction. Overall, the market is expected to grow in the coming years, as demand for high-quality and sustainable packaging solutions continues to rise.

Recent Development:

  • In 2018, Crown Food Europe, a subsidiary of Crown Holdings, unveiled a new package of capping solutions that promises to reduce the total cost of ownership for food manufacturers. The package comprises the sale of its capping technology, ancillary components, and expert technical support for the machines during their service life.

Key Market Players

  • Crown Holdings, Inc.
  • Cap & Seal Pvt Ltd
  • Federfin Tech S.R.L
  • Silgan Holdings
  • Amcor
  • Guala Closure
  • Herti JSC
  • Alcopack
  • Torrent Closures

Key Market Segments

By Product Type:

  • Roll-On-Pilfer-Proof
  • Easy open ends
  • Non-refillable closures
  • Others

By End-Use Sector:

  • Beverage
  • Pharmaceutical
  • Food
  • Home & personal care
  • Others

By Region:

  • North America
  • Latin America
  • East Asia
  • South Asia
  • Europe
  • Oceania
  • MEA

Frequently Asked Questions

How Big is the Aluminum Cap & Closure Market in 2024?

The aluminum caps & closure market is estimated to be valued at US$ 7.5 billion in 2024.

What is China’s Market Outlook?

The market in China is expected to progress at a CAGR of 5.3% through the forecast period.

Which Product Type Contributes More to the Aluminum Cap & Closure Market?

Within the product type, the roll-on-pilfer-proof segment is expected to grow at a CAGR of 4.5% from 2024 to 2034.

What is the United States Market Outlook?

The United States accounts for around 4.9% of the global CAGR from 2024 to 2034.

What is the Projected Value of the Market by 2034?

The global market is set to reach a valuation of around US$ 11.8 billion by the end of 2034.

What Was the Historical CAGR for the Market?

The market value increased at a 6.1% CAGR from 2019 to 2023.

Table of Content

1. Executive Summary

    1.1. Global Market Outlook

    1.2. Demand-side Trends

    1.3. Supply-side Trends

    1.4. Technology Roadmap Analysis

    1.5. Analysis and Recommendations

2. Market Overview

    2.1. Market Coverage / Taxonomy

    2.2. Market Definition / Scope / Limitations

3. Market Background

    3.1. Market Dynamics

        3.1.1. Drivers

        3.1.2. Restraints

        3.1.3. Opportunity

        3.1.4. Trends

    3.2. Scenario Forecast

        3.2.1. Demand in Optimistic Scenario

        3.2.2. Demand in Likely Scenario

        3.2.3. Demand in Conservative Scenario

    3.3. Opportunity Map Analysis

    3.4. Product Life Cycle Analysis

    3.5. Supply Chain Analysis

        3.5.1. Supply Side Participants and their Roles

            3.5.1.1. Producers

            3.5.1.2. Mid-Level Participants (Traders/ Agents/ Brokers)

            3.5.1.3. Wholesalers and Distributors

        3.5.2. Value Added and Value Created at Node in the Supply Chain

        3.5.3. List of Raw Material Suppliers

        3.5.4. List of Existing and Potential Buyer’s

    3.6. Investment Feasibility Matrix

    3.7. Value Chain Analysis

        3.7.1. Profit Margin Analysis

        3.7.2. Wholesalers and Distributors

        3.7.3. Retailers

    3.8. PESTLE and Porter’s Analysis

    3.9. Regulatory Landscape

        3.9.1. By Key Regions

        3.9.2. By Key Countries

    3.10. Regional Parent Market Outlook

    3.11. Production and Consumption Statistics

    3.12. Import and Export Statistics

4. Global Market Analysis 2019 to 2023 and Forecast, 2024 to 2034

    4.1. Historical Market Size Value (US$ Million) & Volume (Units) Analysis, 2019 to 2023

    4.2. Current and Future Market Size Value (US$ Million) & Volume (Units) Projections, 2024 to 2034

        4.2.1. Y-o-Y Growth Trend Analysis

        4.2.2. Absolute $ Opportunity Analysis

5. Global Market Analysis 2019 to 2023 and Forecast 2024 to 2034, By Product Type

    5.1. Introduction / Key Findings

    5.2. Historical Market Size Value (US$ Million) & Volume (Units) Analysis By Product Type, 2019 to 2023

    5.3. Current and Future Market Size Value (US$ Million) & Volume (Units) Analysis and Forecast By Product Type, 2024 to 2034

        5.3.1. Roll-On-Pilfer-Proof

        5.3.2. Easy Open Ends

        5.3.3. Non-Refillable Closures

        5.3.4. Others

    5.4. Y-o-Y Growth Trend Analysis By Product Type, 2019 to 2023

    5.5. Absolute $ Opportunity Analysis By Product Type, 2024 to 2034

6. Global Market Analysis 2019 to 2023 and Forecast 2024 to 2034, By End-Use Sector

    6.1. Introduction / Key Findings

    6.2. Historical Market Size Value (US$ Million) & Volume (Units) Analysis By End-Use Sector, 2019 to 2023

    6.3. Current and Future Market Size Value (US$ Million) & Volume (Units) Analysis and Forecast By End-Use Sector, 2024 to 2034

        6.3.1. Beverage

        6.3.2. Pharmaceutical

        6.3.3. Food

        6.3.4. Home & Personal Care

        6.3.5. Others

    6.4. Y-o-Y Growth Trend Analysis By End-Use Sector, 2019 to 2023

    6.5. Absolute $ Opportunity Analysis By End-Use Sector, 2024 to 2034

7. Global Market Analysis 2019 to 2023 and Forecast 2024 to 2034, By Region

    7.1. Introduction

    7.2. Historical Market Size Value (US$ Million) & Volume (Units) Analysis By Region, 2019 to 2023

    7.3. Current Market Size Value (US$ Million) & Volume (Units) Analysis and Forecast By Region, 2024 to 2034

        7.3.1. North America

        7.3.2. Latin America

        7.3.3. Western Europe

        7.3.4. Eastern Europe

        7.3.5. South Asia and Pacific

        7.3.6. East Asia

        7.3.7. Middle East and Africa

    7.4. Market Attractiveness Analysis By Region

8. North America Market Analysis 2019 to 2023 and Forecast 2024 to 2034, By Country

    8.1. Historical Market Size Value (US$ Million) & Volume (Units) Trend Analysis By Market Taxonomy, 2019 to 2023

    8.2. Market Size Value (US$ Million) & Volume (Units) Forecast By Market Taxonomy, 2024 to 2034

        8.2.1. By Country

            8.2.1.1. USA

            8.2.1.2. Canada

        8.2.2. By Product Type

        8.2.3. By End-Use Sector

    8.3. Market Attractiveness Analysis

        8.3.1. By Country

        8.3.2. By Product Type

        8.3.3. By End-Use Sector

    8.4. Key Takeaways

9. Latin America Market Analysis 2019 to 2023 and Forecast 2024 to 2034, By Country

    9.1. Historical Market Size Value (US$ Million) & Volume (Units) Trend Analysis By Market Taxonomy, 2019 to 2023

    9.2. Market Size Value (US$ Million) & Volume (Units) Forecast By Market Taxonomy, 2024 to 2034

        9.2.1. By Country

            9.2.1.1. Brazil

            9.2.1.2. Mexico

            9.2.1.3. Rest of Latin America

        9.2.2. By Product Type

        9.2.3. By End-Use Sector

    9.3. Market Attractiveness Analysis

        9.3.1. By Country

        9.3.2. By Product Type

        9.3.3. By End-Use Sector

    9.4. Key Takeaways

10. Western Europe Market Analysis 2019 to 2023 and Forecast 2024 to 2034, By Country

    10.1. Historical Market Size Value (US$ Million) & Volume (Units) Trend Analysis By Market Taxonomy, 2019 to 2023

    10.2. Market Size Value (US$ Million) & Volume (Units) Forecast By Market Taxonomy, 2024 to 2034

        10.2.1. By Country

            10.2.1.1. Germany

            10.2.1.2. UK

            10.2.1.3. France

            10.2.1.4. Spain

            10.2.1.5. Italy

            10.2.1.6. Rest of Western Europe

        10.2.2. By Product Type

        10.2.3. By End-Use Sector

    10.3. Market Attractiveness Analysis

        10.3.1. By Country

        10.3.2. By Product Type

        10.3.3. By End-Use Sector

    10.4. Key Takeaways

11. Eastern Europe Market Analysis 2019 to 2023 and Forecast 2024 to 2034, By Country

    11.1. Historical Market Size Value (US$ Million) & Volume (Units) Trend Analysis By Market Taxonomy, 2019 to 2023

    11.2. Market Size Value (US$ Million) & Volume (Units) Forecast By Market Taxonomy, 2024 to 2034

        11.2.1. By Country

            11.2.1.1. Poland

            11.2.1.2. Russia

            11.2.1.3. Czech Republic

            11.2.1.4. Romania

            11.2.1.5. Rest of Eastern Europe

        11.2.2. By Product Type

        11.2.3. By End-Use Sector

    11.3. Market Attractiveness Analysis

        11.3.1. By Country

        11.3.2. By Product Type

        11.3.3. By End-Use Sector

    11.4. Key Takeaways

12. South Asia and Pacific Market Analysis 2019 to 2023 and Forecast 2024 to 2034, By Country

    12.1. Historical Market Size Value (US$ Million) & Volume (Units) Trend Analysis By Market Taxonomy, 2019 to 2023

    12.2. Market Size Value (US$ Million) & Volume (Units) Forecast By Market Taxonomy, 2024 to 2034

        12.2.1. By Country

            12.2.1.1. India

            12.2.1.2. Bangladesh

            12.2.1.3. Australia

            12.2.1.4. New Zealand

            12.2.1.5. Rest of South Asia and Pacific

        12.2.2. By Product Type

        12.2.3. By End-Use Sector

    12.3. Market Attractiveness Analysis

        12.3.1. By Country

        12.3.2. By Product Type

        12.3.3. By End-Use Sector

    12.4. Key Takeaways

13. East Asia Market Analysis 2019 to 2023 and Forecast 2024 to 2034, By Country

    13.1. Historical Market Size Value (US$ Million) & Volume (Units) Trend Analysis By Market Taxonomy, 2019 to 2023

    13.2. Market Size Value (US$ Million) & Volume (Units) Forecast By Market Taxonomy, 2024 to 2034

        13.2.1. By Country

            13.2.1.1. China

            13.2.1.2. Japan

            13.2.1.3. South Korea

        13.2.2. By Product Type

        13.2.3. By End-Use Sector

    13.3. Market Attractiveness Analysis

        13.3.1. By Country

        13.3.2. By Product Type

        13.3.3. By End-Use Sector

    13.4. Key Takeaways

14. Middle East and Africa Market Analysis 2019 to 2023 and Forecast 2024 to 2034, By Country

    14.1. Historical Market Size Value (US$ Million) & Volume (Units) Trend Analysis By Market Taxonomy, 2019 to 2023

    14.2. Market Size Value (US$ Million) & Volume (Units) Forecast By Market Taxonomy, 2024 to 2034

        14.2.1. By Country

            14.2.1.1. GCC Countries

            14.2.1.2. South Africa

            14.2.1.3. Israel

            14.2.1.4. Rest of MEA

        14.2.2. By Product Type

        14.2.3. By End-Use Sector

    14.3. Market Attractiveness Analysis

        14.3.1. By Country

        14.3.2. By Product Type

        14.3.3. By End-Use Sector

    14.4. Key Takeaways

15. Key Countries Market Analysis

    15.1. USA

        15.1.1. Pricing Analysis

        15.1.2. Market Share Analysis, 2023

            15.1.2.1. By Product Type

            15.1.2.2. By End-Use Sector

    15.2. Canada

        15.2.1. Pricing Analysis

        15.2.2. Market Share Analysis, 2023

            15.2.2.1. By Product Type

            15.2.2.2. By End-Use Sector

    15.3. Brazil

        15.3.1. Pricing Analysis

        15.3.2. Market Share Analysis, 2023

            15.3.2.1. By Product Type

            15.3.2.2. By End-Use Sector

    15.4. Mexico

        15.4.1. Pricing Analysis

        15.4.2. Market Share Analysis, 2023

            15.4.2.1. By Product Type

            15.4.2.2. By End-Use Sector

    15.5. Germany

        15.5.1. Pricing Analysis

        15.5.2. Market Share Analysis, 2023

            15.5.2.1. By Product Type

            15.5.2.2. By End-Use Sector

    15.6. UK

        15.6.1. Pricing Analysis

        15.6.2. Market Share Analysis, 2023

            15.6.2.1. By Product Type

            15.6.2.2. By End-Use Sector

    15.7. France

        15.7.1. Pricing Analysis

        15.7.2. Market Share Analysis, 2023

            15.7.2.1. By Product Type

            15.7.2.2. By End-Use Sector

    15.8. Spain

        15.8.1. Pricing Analysis

        15.8.2. Market Share Analysis, 2023

            15.8.2.1. By Product Type

            15.8.2.2. By End-Use Sector

    15.9. Italy

        15.9.1. Pricing Analysis

        15.9.2. Market Share Analysis, 2023

            15.9.2.1. By Product Type

            15.9.2.2. By End-Use Sector

    15.10. Poland

        15.10.1. Pricing Analysis

        15.10.2. Market Share Analysis, 2023

            15.10.2.1. By Product Type

            15.10.2.2. By End-Use Sector

    15.11. Russia

        15.11.1. Pricing Analysis

        15.11.2. Market Share Analysis, 2023

            15.11.2.1. By Product Type

            15.11.2.2. By End-Use Sector

    15.12. Czech Republic

        15.12.1. Pricing Analysis

        15.12.2. Market Share Analysis, 2023

            15.12.2.1. By Product Type

            15.12.2.2. By End-Use Sector

    15.13. Romania

        15.13.1. Pricing Analysis

        15.13.2. Market Share Analysis, 2023

            15.13.2.1. By Product Type

            15.13.2.2. By End-Use Sector

    15.14. India

        15.14.1. Pricing Analysis

        15.14.2. Market Share Analysis, 2023

            15.14.2.1. By Product Type

            15.14.2.2. By End-Use Sector

    15.15. Bangladesh

        15.15.1. Pricing Analysis

        15.15.2. Market Share Analysis, 2023

            15.15.2.1. By Product Type

            15.15.2.2. By End-Use Sector

    15.16. Australia

        15.16.1. Pricing Analysis

        15.16.2. Market Share Analysis, 2023

            15.16.2.1. By Product Type

            15.16.2.2. By End-Use Sector

    15.17. New Zealand

        15.17.1. Pricing Analysis

        15.17.2. Market Share Analysis, 2023

            15.17.2.1. By Product Type

            15.17.2.2. By End-Use Sector

    15.18. China

        15.18.1. Pricing Analysis

        15.18.2. Market Share Analysis, 2023

            15.18.2.1. By Product Type

            15.18.2.2. By End-Use Sector

    15.19. Japan

        15.19.1. Pricing Analysis

        15.19.2. Market Share Analysis, 2023

            15.19.2.1. By Product Type

            15.19.2.2. By End-Use Sector

    15.20. South Korea

        15.20.1. Pricing Analysis

        15.20.2. Market Share Analysis, 2023

            15.20.2.1. By Product Type

            15.20.2.2. By End-Use Sector

    15.21. GCC Countries

        15.21.1. Pricing Analysis

        15.21.2. Market Share Analysis, 2023

            15.21.2.1. By Product Type

            15.21.2.2. By End-Use Sector

    15.22. South Africa

        15.22.1. Pricing Analysis

        15.22.2. Market Share Analysis, 2023

            15.22.2.1. By Product Type

            15.22.2.2. By End-Use Sector

    15.23. Israel

        15.23.1. Pricing Analysis

        15.23.2. Market Share Analysis, 2023

            15.23.2.1. By Product Type

            15.23.2.2. By End-Use Sector

16. Market Structure Analysis

    16.1. Competition Dashboard

    16.2. Competition Benchmarking

    16.3. Market Share Analysis of Top Players

        16.3.1. By Regional

        16.3.2. By Product Type

        16.3.3. By End-Use Sector

17. Competition Analysis

    17.1. Competition Deep Dive

        17.1.1. Crown Holdings, Inc

            17.1.1.1. Overview

            17.1.1.2. Product Portfolio

            17.1.1.3. Profitability by Market Segments

            17.1.1.4. Sales Footprint

            17.1.1.5. Strategy Overview

                17.1.1.5.1. Marketing Strategy

                17.1.1.5.2. Product Strategy

                17.1.1.5.3. Channel Strategy

        17.1.2. Silgan Holdings

            17.1.2.1. Overview

            17.1.2.2. Product Portfolio

            17.1.2.3. Profitability by Market Segments

            17.1.2.4. Sales Footprint

            17.1.2.5. Strategy Overview

                17.1.2.5.1. Marketing Strategy

                17.1.2.5.2. Product Strategy

                17.1.2.5.3. Channel Strategy

        17.1.3. Amcor

            17.1.3.1. Overview

            17.1.3.2. Product Portfolio

            17.1.3.3. Profitability by Market Segments

            17.1.3.4. Sales Footprint

            17.1.3.5. Strategy Overview

                17.1.3.5.1. Marketing Strategy

                17.1.3.5.2. Product Strategy

                17.1.3.5.3. Channel Strategy

        17.1.4. Guala Closure

            17.1.4.1. Overview

            17.1.4.2. Product Portfolio

            17.1.4.3. Profitability by Market Segments

            17.1.4.4. Sales Footprint

            17.1.4.5. Strategy Overview

                17.1.4.5.1. Marketing Strategy

                17.1.4.5.2. Product Strategy

                17.1.4.5.3. Channel Strategy

        17.1.5. Alcopack

            17.1.5.1. Overview

            17.1.5.2. Product Portfolio

            17.1.5.3. Profitability by Market Segments

            17.1.5.4. Sales Footprint

            17.1.5.5. Strategy Overview

                17.1.5.5.1. Marketing Strategy

                17.1.5.5.2. Product Strategy

                17.1.5.5.3. Channel Strategy

        17.1.6. Herti JSC

            17.1.6.1. Overview

            17.1.6.2. Product Portfolio

            17.1.6.3. Profitability by Market Segments

            17.1.6.4. Sales Footprint

            17.1.6.5. Strategy Overview

                17.1.6.5.1. Marketing Strategy

                17.1.6.5.2. Product Strategy

                17.1.6.5.3. Channel Strategy

        17.1.7. Torrent Closures

            17.1.7.1. Overview

            17.1.7.2. Product Portfolio

            17.1.7.3. Profitability by Market Segments

            17.1.7.4. Sales Footprint

            17.1.7.5. Strategy Overview

                17.1.7.5.1. Marketing Strategy

                17.1.7.5.2. Product Strategy

                17.1.7.5.3. Channel Strategy

        17.1.8. Cap & Seal Pvt Ltd

            17.1.8.1. Overview

            17.1.8.2. Product Portfolio

            17.1.8.3. Profitability by Market Segments

            17.1.8.4. Sales Footprint

            17.1.8.5. Strategy Overview

                17.1.8.5.1. Marketing Strategy

                17.1.8.5.2. Product Strategy

                17.1.8.5.3. Channel Strategy

        17.1.9. Federfin Tech S.R.L

            17.1.9.1. Overview

            17.1.9.2. Product Portfolio

            17.1.9.3. Profitability by Market Segments

            17.1.9.4. Sales Footprint

            17.1.9.5. Strategy Overview

                17.1.9.5.1. Marketing Strategy

                17.1.9.5.2. Product Strategy

                17.1.9.5.3. Channel Strategy

        17.1.10. ITC Packaging

            17.1.10.1. Overview

            17.1.10.2. Product Portfolio

            17.1.10.3. Profitability by Market Segments

            17.1.10.4. Sales Footprint

            17.1.10.5. Strategy Overview

                17.1.10.5.1. Marketing Strategy

                17.1.10.5.2. Product Strategy

                17.1.10.5.3. Channel Strategy

        17.1.11. Alutop

            17.1.11.1. Overview

            17.1.11.2. Product Portfolio

            17.1.11.3. Profitability by Market Segments

            17.1.11.4. Sales Footprint

            17.1.11.5. Strategy Overview

                17.1.11.5.1. Marketing Strategy

                17.1.11.5.2. Product Strategy

                17.1.11.5.3. Channel Strategy

18. Assumptions & Acronyms Used

19. Research Methodology

List of Tables

Table 1: Global Market Value (US$ Million) Forecast by Region, 2019 to 2034

Table 2: Global Market Volume (Units) Forecast by Region, 2019 to 2034

Table 3: Global Market Value (US$ Million) Forecast by Product Type, 2019 to 2034

Table 4: Global Market Volume (Units) Forecast by Product Type, 2019 to 2034

Table 5: Global Market Value (US$ Million) Forecast by End-Use Sector, 2019 to 2034

Table 6: Global Market Volume (Units) Forecast by End-Use Sector, 2019 to 2034

Table 7: North America Market Value (US$ Million) Forecast by Country, 2019 to 2034

Table 8: North America Market Volume (Units) Forecast by Country, 2019 to 2034

Table 9: North America Market Value (US$ Million) Forecast by Product Type, 2019 to 2034

Table 10: North America Market Volume (Units) Forecast by Product Type, 2019 to 2034

Table 11: North America Market Value (US$ Million) Forecast by End-Use Sector, 2019 to 2034

Table 12: North America Market Volume (Units) Forecast by End-Use Sector, 2019 to 2034

Table 13: Latin America Market Value (US$ Million) Forecast by Country, 2019 to 2034

Table 14: Latin America Market Volume (Units) Forecast by Country, 2019 to 2034

Table 15: Latin America Market Value (US$ Million) Forecast by Product Type, 2019 to 2034

Table 16: Latin America Market Volume (Units) Forecast by Product Type, 2019 to 2034

Table 17: Latin America Market Value (US$ Million) Forecast by End-Use Sector, 2019 to 2034

Table 18: Latin America Market Volume (Units) Forecast by End-Use Sector, 2019 to 2034

Table 19: Western Europe Market Value (US$ Million) Forecast by Country, 2019 to 2034

Table 20: Western Europe Market Volume (Units) Forecast by Country, 2019 to 2034

Table 21: Western Europe Market Value (US$ Million) Forecast by Product Type, 2019 to 2034

Table 22: Western Europe Market Volume (Units) Forecast by Product Type, 2019 to 2034

Table 23: Western Europe Market Value (US$ Million) Forecast by End-Use Sector, 2019 to 2034

Table 24: Western Europe Market Volume (Units) Forecast by End-Use Sector, 2019 to 2034

Table 25: Eastern Europe Market Value (US$ Million) Forecast by Country, 2019 to 2034

Table 26: Eastern Europe Market Volume (Units) Forecast by Country, 2019 to 2034

Table 27: Eastern Europe Market Value (US$ Million) Forecast by Product Type, 2019 to 2034

Table 28: Eastern Europe Market Volume (Units) Forecast by Product Type, 2019 to 2034

Table 29: Eastern Europe Market Value (US$ Million) Forecast by End-Use Sector, 2019 to 2034

Table 30: Eastern Europe Market Volume (Units) Forecast by End-Use Sector, 2019 to 2034

Table 31: South Asia and Pacific Market Value (US$ Million) Forecast by Country, 2019 to 2034

Table 32: South Asia and Pacific Market Volume (Units) Forecast by Country, 2019 to 2034

Table 33: South Asia and Pacific Market Value (US$ Million) Forecast by Product Type, 2019 to 2034

Table 34: South Asia and Pacific Market Volume (Units) Forecast by Product Type, 2019 to 2034

Table 35: South Asia and Pacific Market Value (US$ Million) Forecast by End-Use Sector, 2019 to 2034

Table 36: South Asia and Pacific Market Volume (Units) Forecast by End-Use Sector, 2019 to 2034

Table 37: East Asia Market Value (US$ Million) Forecast by Country, 2019 to 2034

Table 38: East Asia Market Volume (Units) Forecast by Country, 2019 to 2034

Table 39: East Asia Market Value (US$ Million) Forecast by Product Type, 2019 to 2034

Table 40: East Asia Market Volume (Units) Forecast by Product Type, 2019 to 2034

Table 41: East Asia Market Value (US$ Million) Forecast by End-Use Sector, 2019 to 2034

Table 42: East Asia Market Volume (Units) Forecast by End-Use Sector, 2019 to 2034

Table 43: Middle East and Africa Market Value (US$ Million) Forecast by Country, 2019 to 2034

Table 44: Middle East and Africa Market Volume (Units) Forecast by Country, 2019 to 2034

Table 45: Middle East and Africa Market Value (US$ Million) Forecast by Product Type, 2019 to 2034

Table 46: Middle East and Africa Market Volume (Units) Forecast by Product Type, 2019 to 2034

Table 47: Middle East and Africa Market Value (US$ Million) Forecast by End-Use Sector, 2019 to 2034

Table 48: Middle East and Africa Market Volume (Units) Forecast by End-Use Sector, 2019 to 2034

List of Charts

Figure 1: Global Market Value (US$ Million) by Product Type, 2024 to 2034

Figure 2: Global Market Value (US$ Million) by End-Use Sector, 2024 to 2034

Figure 3: Global Market Value (US$ Million) by Region, 2024 to 2034

Figure 4: Global Market Value (US$ Million) Analysis by Region, 2019 to 2034

Figure 5: Global Market Volume (Units) Analysis by Region, 2019 to 2034

Figure 6: Global Market Value Share (%) and BPS Analysis by Region, 2024 to 2034

Figure 7: Global Market Y-o-Y Growth (%) Projections by Region, 2024 to 2034

Figure 8: Global Market Value (US$ Million) Analysis by Product Type, 2019 to 2034

Figure 9: Global Market Volume (Units) Analysis by Product Type, 2019 to 2034

Figure 10: Global Market Value Share (%) and BPS Analysis by Product Type, 2024 to 2034

Figure 11: Global Market Y-o-Y Growth (%) Projections by Product Type, 2024 to 2034

Figure 12: Global Market Value (US$ Million) Analysis by End-Use Sector, 2019 to 2034

Figure 13: Global Market Volume (Units) Analysis by End-Use Sector, 2019 to 2034

Figure 14: Global Market Value Share (%) and BPS Analysis by End-Use Sector, 2024 to 2034

Figure 15: Global Market Y-o-Y Growth (%) Projections by End-Use Sector, 2024 to 2034

Figure 16: Global Market Attractiveness by Product Type, 2024 to 2034

Figure 17: Global Market Attractiveness by End-Use Sector, 2024 to 2034

Figure 18: Global Market Attractiveness by Region, 2024 to 2034

Figure 19: North America Market Value (US$ Million) by Product Type, 2024 to 2034

Figure 20: North America Market Value (US$ Million) by End-Use Sector, 2024 to 2034

Figure 21: North America Market Value (US$ Million) by Country, 2024 to 2034

Figure 22: North America Market Value (US$ Million) Analysis by Country, 2019 to 2034

Figure 23: North America Market Volume (Units) Analysis by Country, 2019 to 2034

Figure 24: North America Market Value Share (%) and BPS Analysis by Country, 2024 to 2034

Figure 25: North America Market Y-o-Y Growth (%) Projections by Country, 2024 to 2034

Figure 26: North America Market Value (US$ Million) Analysis by Product Type, 2019 to 2034

Figure 27: North America Market Volume (Units) Analysis by Product Type, 2019 to 2034

Figure 28: North America Market Value Share (%) and BPS Analysis by Product Type, 2024 to 2034

Figure 29: North America Market Y-o-Y Growth (%) Projections by Product Type, 2024 to 2034

Figure 30: North America Market Value (US$ Million) Analysis by End-Use Sector, 2019 to 2034

Figure 31: North America Market Volume (Units) Analysis by End-Use Sector, 2019 to 2034

Figure 32: North America Market Value Share (%) and BPS Analysis by End-Use Sector, 2024 to 2034

Figure 33: North America Market Y-o-Y Growth (%) Projections by End-Use Sector, 2024 to 2034

Figure 34: North America Market Attractiveness by Product Type, 2024 to 2034

Figure 35: North America Market Attractiveness by End-Use Sector, 2024 to 2034

Figure 36: North America Market Attractiveness by Country, 2024 to 2034

Figure 37: Latin America Market Value (US$ Million) by Product Type, 2024 to 2034

Figure 38: Latin America Market Value (US$ Million) by End-Use Sector, 2024 to 2034

Figure 39: Latin America Market Value (US$ Million) by Country, 2024 to 2034

Figure 40: Latin America Market Value (US$ Million) Analysis by Country, 2019 to 2034

Figure 41: Latin America Market Volume (Units) Analysis by Country, 2019 to 2034

Figure 42: Latin America Market Value Share (%) and BPS Analysis by Country, 2024 to 2034

Figure 43: Latin America Market Y-o-Y Growth (%) Projections by Country, 2024 to 2034

Figure 44: Latin America Market Value (US$ Million) Analysis by Product Type, 2019 to 2034

Figure 45: Latin America Market Volume (Units) Analysis by Product Type, 2019 to 2034

Figure 46: Latin America Market Value Share (%) and BPS Analysis by Product Type, 2024 to 2034

Figure 47: Latin America Market Y-o-Y Growth (%) Projections by Product Type, 2024 to 2034

Figure 48: Latin America Market Value (US$ Million) Analysis by End-Use Sector, 2019 to 2034

Figure 49: Latin America Market Volume (Units) Analysis by End-Use Sector, 2019 to 2034

Figure 50: Latin America Market Value Share (%) and BPS Analysis by End-Use Sector, 2024 to 2034

Figure 51: Latin America Market Y-o-Y Growth (%) Projections by End-Use Sector, 2024 to 2034

Figure 52: Latin America Market Attractiveness by Product Type, 2024 to 2034

Figure 53: Latin America Market Attractiveness by End-Use Sector, 2024 to 2034

Figure 54: Latin America Market Attractiveness by Country, 2024 to 2034

Figure 55: Western Europe Market Value (US$ Million) by Product Type, 2024 to 2034

Figure 56: Western Europe Market Value (US$ Million) by End-Use Sector, 2024 to 2034

Figure 57: Western Europe Market Value (US$ Million) by Country, 2024 to 2034

Figure 58: Western Europe Market Value (US$ Million) Analysis by Country, 2019 to 2034

Figure 59: Western Europe Market Volume (Units) Analysis by Country, 2019 to 2034

Figure 60: Western Europe Market Value Share (%) and BPS Analysis by Country, 2024 to 2034

Figure 61: Western Europe Market Y-o-Y Growth (%) Projections by Country, 2024 to 2034

Figure 62: Western Europe Market Value (US$ Million) Analysis by Product Type, 2019 to 2034

Figure 63: Western Europe Market Volume (Units) Analysis by Product Type, 2019 to 2034

Figure 64: Western Europe Market Value Share (%) and BPS Analysis by Product Type, 2024 to 2034

Figure 65: Western Europe Market Y-o-Y Growth (%) Projections by Product Type, 2024 to 2034

Figure 66: Western Europe Market Value (US$ Million) Analysis by End-Use Sector, 2019 to 2034

Figure 67: Western Europe Market Volume (Units) Analysis by End-Use Sector, 2019 to 2034

Figure 68: Western Europe Market Value Share (%) and BPS Analysis by End-Use Sector, 2024 to 2034

Figure 69: Western Europe Market Y-o-Y Growth (%) Projections by End-Use Sector, 2024 to 2034

Figure 70: Western Europe Market Attractiveness by Product Type, 2024 to 2034

Figure 71: Western Europe Market Attractiveness by End-Use Sector, 2024 to 2034

Figure 72: Western Europe Market Attractiveness by Country, 2024 to 2034

Figure 73: Eastern Europe Market Value (US$ Million) by Product Type, 2024 to 2034

Figure 74: Eastern Europe Market Value (US$ Million) by End-Use Sector, 2024 to 2034

Figure 75: Eastern Europe Market Value (US$ Million) by Country, 2024 to 2034

Figure 76: Eastern Europe Market Value (US$ Million) Analysis by Country, 2019 to 2034

Figure 77: Eastern Europe Market Volume (Units) Analysis by Country, 2019 to 2034

Figure 78: Eastern Europe Market Value Share (%) and BPS Analysis by Country, 2024 to 2034

Figure 79: Eastern Europe Market Y-o-Y Growth (%) Projections by Country, 2024 to 2034

Figure 80: Eastern Europe Market Value (US$ Million) Analysis by Product Type, 2019 to 2034

Figure 81: Eastern Europe Market Volume (Units) Analysis by Product Type, 2019 to 2034

Figure 82: Eastern Europe Market Value Share (%) and BPS Analysis by Product Type, 2024 to 2034

Figure 83: Eastern Europe Market Y-o-Y Growth (%) Projections by Product Type, 2024 to 2034

Figure 84: Eastern Europe Market Value (US$ Million) Analysis by End-Use Sector, 2019 to 2034

Figure 85: Eastern Europe Market Volume (Units) Analysis by End-Use Sector, 2019 to 2034

Figure 86: Eastern Europe Market Value Share (%) and BPS Analysis by End-Use Sector, 2024 to 2034

Figure 87: Eastern Europe Market Y-o-Y Growth (%) Projections by End-Use Sector, 2024 to 2034

Figure 88: Eastern Europe Market Attractiveness by Product Type, 2024 to 2034

Figure 89: Eastern Europe Market Attractiveness by End-Use Sector, 2024 to 2034

Figure 90: Eastern Europe Market Attractiveness by Country, 2024 to 2034

Figure 91: South Asia and Pacific Market Value (US$ Million) by Product Type, 2024 to 2034

Figure 92: South Asia and Pacific Market Value (US$ Million) by End-Use Sector, 2024 to 2034

Figure 93: South Asia and Pacific Market Value (US$ Million) by Country, 2024 to 2034

Figure 94: South Asia and Pacific Market Value (US$ Million) Analysis by Country, 2019 to 2034

Figure 95: South Asia and Pacific Market Volume (Units) Analysis by Country, 2019 to 2034

Figure 96: South Asia and Pacific Market Value Share (%) and BPS Analysis by Country, 2024 to 2034

Figure 97: South Asia and Pacific Market Y-o-Y Growth (%) Projections by Country, 2024 to 2034

Figure 98: South Asia and Pacific Market Value (US$ Million) Analysis by Product Type, 2019 to 2034

Figure 99: South Asia and Pacific Market Volume (Units) Analysis by Product Type, 2019 to 2034

Figure 100: South Asia and Pacific Market Value Share (%) and BPS Analysis by Product Type, 2024 to 2034

Figure 101: South Asia and Pacific Market Y-o-Y Growth (%) Projections by Product Type, 2024 to 2034

Figure 102: South Asia and Pacific Market Value (US$ Million) Analysis by End-Use Sector, 2019 to 2034

Figure 103: South Asia and Pacific Market Volume (Units) Analysis by End-Use Sector, 2019 to 2034

Figure 104: South Asia and Pacific Market Value Share (%) and BPS Analysis by End-Use Sector, 2024 to 2034

Figure 105: South Asia and Pacific Market Y-o-Y Growth (%) Projections by End-Use Sector, 2024 to 2034

Figure 106: South Asia and Pacific Market Attractiveness by Product Type, 2024 to 2034

Figure 107: South Asia and Pacific Market Attractiveness by End-Use Sector, 2024 to 2034

Figure 108: South Asia and Pacific Market Attractiveness by Country, 2024 to 2034

Figure 109: East Asia Market Value (US$ Million) by Product Type, 2024 to 2034

Figure 110: East Asia Market Value (US$ Million) by End-Use Sector, 2024 to 2034

Figure 111: East Asia Market Value (US$ Million) by Country, 2024 to 2034

Figure 112: East Asia Market Value (US$ Million) Analysis by Country, 2019 to 2034

Figure 113: East Asia Market Volume (Units) Analysis by Country, 2019 to 2034

Figure 114: East Asia Market Value Share (%) and BPS Analysis by Country, 2024 to 2034

Figure 115: East Asia Market Y-o-Y Growth (%) Projections by Country, 2024 to 2034

Figure 116: East Asia Market Value (US$ Million) Analysis by Product Type, 2019 to 2034

Figure 117: East Asia Market Volume (Units) Analysis by Product Type, 2019 to 2034

Figure 118: East Asia Market Value Share (%) and BPS Analysis by Product Type, 2024 to 2034

Figure 119: East Asia Market Y-o-Y Growth (%) Projections by Product Type, 2024 to 2034

Figure 120: East Asia Market Value (US$ Million) Analysis by End-Use Sector, 2019 to 2034

Figure 121: East Asia Market Volume (Units) Analysis by End-Use Sector, 2019 to 2034

Figure 122: East Asia Market Value Share (%) and BPS Analysis by End-Use Sector, 2024 to 2034

Figure 123: East Asia Market Y-o-Y Growth (%) Projections by End-Use Sector, 2024 to 2034

Figure 124: East Asia Market Attractiveness by Product Type, 2024 to 2034

Figure 125: East Asia Market Attractiveness by End-Use Sector, 2024 to 2034

Figure 126: East Asia Market Attractiveness by Country, 2024 to 2034

Figure 127: Middle East and Africa Market Value (US$ Million) by Product Type, 2024 to 2034

Figure 128: Middle East and Africa Market Value (US$ Million) by End-Use Sector, 2024 to 2034

Figure 129: Middle East and Africa Market Value (US$ Million) by Country, 2024 to 2034

Figure 130: Middle East and Africa Market Value (US$ Million) Analysis by Country, 2019 to 2034

Figure 131: Middle East and Africa Market Volume (Units) Analysis by Country, 2019 to 2034

Figure 132: Middle East and Africa Market Value Share (%) and BPS Analysis by Country, 2024 to 2034

Figure 133: Middle East and Africa Market Y-o-Y Growth (%) Projections by Country, 2024 to 2034

Figure 134: Middle East and Africa Market Value (US$ Million) Analysis by Product Type, 2019 to 2034

Figure 135: Middle East and Africa Market Volume (Units) Analysis by Product Type, 2019 to 2034

Figure 136: Middle East and Africa Market Value Share (%) and BPS Analysis by Product Type, 2024 to 2034

Figure 137: Middle East and Africa Market Y-o-Y Growth (%) Projections by Product Type, 2024 to 2034

Figure 138: Middle East and Africa Market Value (US$ Million) Analysis by End-Use Sector, 2019 to 2034

Figure 139: Middle East and Africa Market Volume (Units) Analysis by End-Use Sector, 2019 to 2034

Figure 140: Middle East and Africa Market Value Share (%) and BPS Analysis by End-Use Sector, 2024 to 2034

Figure 141: Middle East and Africa Market Y-o-Y Growth (%) Projections by End-Use Sector, 2024 to 2034

Figure 142: Middle East and Africa Market Attractiveness by Product Type, 2024 to 2034

Figure 143: Middle East and Africa Market Attractiveness by End-Use Sector, 2024 to 2034

Figure 144: Middle East and Africa Market Attractiveness by Country, 2024 to 2034

Recommendations

Packaging

Aluminum Foil Market

Published : April 2024

Chemicals & Materials

Aluminum Market

Published : July 2023

Explore Packaging Insights

View Reports

Aluminum Cap & Closure Market