Aluminum-free Natural Food Color Market Outlook (2022 to 2032)

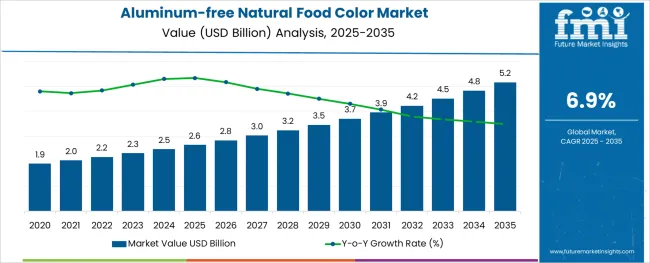
The global aluminum-free natural food color market is forecasted to be appraised at US$ 4.08 billion by 2032, up from US$ 2.17 billion in 2022, advancing at a CAGR of 6.88% during the forecast period.

Aluminum-free food colors are pigments, dyes, and substances that impart color to food and beverages and are known as food colors or coloring additives.

Aluminum-free food colors are available in the form of liquids, gels, and powder food coloring, which is used in both domestic and commercial production of eatables and beverages.

Consumers have a tendency to associate the taste of food products with their color, which serves as a vital factor for food and beverage companies, increasingly using aluminum-free natural food coloring to make their products more marketable and presentable.

Increased awareness and rising demand for clean-label foods amongst consumers are likely to spur global sales of aluminum-free natural food colors, with significant growth of the market size during the forecast period.

Report Attribute Details
Aluminum-free Natural Food Color Market Value (2022) US$ 2.17 Billion
Aluminum-free Natural Food Color Market Anticipated Value (2032) US$ 4.08 Billion
Aluminum-free Natural Food Color Projected Growth Rate (2032) 6.88%

Don't pay for what you don't need

Customize your report by selecting specific countries or regions and save 30%!

What are the Key Dynamics for the Aluminum-free Natural Food Color Market?

The market size of aluminum-free natural food colors is projected to show impressive growth during the forecast period. The growth is primarily attributed to the fact that there is a constant rise in consumer preference for consuming clean-labeled products.

Rising concerns over health hazards associated with the intake of synthetic food colors are amplifying the demand for aluminum-free natural food colors in many parts of the world.

Aluminum is identified as a neurotoxin that can affect over 200 biological functions of the body. Prolonged accumulation in the human system over periods of time can have adverse consequences, potentially causing neurodegenerative diseases like dementia, Alzheimer’s disease, Parkinson’s, and amyotrophic lateral sclerosis (ALS).

Aluminum competes with other minerals for absorption into the bloodstream, significantly deterring calcium absorption in bones, and impacting skeletal mineralization. Accumulation of aluminum can develop autism and slow down growth in kids.

Growing awareness about the adverse impact of aluminum on human health is fueling the food and beverage industry to seek alternatives to food coloring containing aluminum.

A recent survey of Germany, conducted by the Federal Institute of Risk Assessment has revealed that half of the German populace avoids the use of aluminum-based products. This factor is estimated to play a vital driver in the aluminum-free natural food color market growth.

Mindful choices are gaining traction with a burgeoning demand for naturally sourced ingredients for food products, associating natural with healthy is driving manufacturers to adopt aluminum-free natural food colors for their products.

However, natural food colors have a very less shelf life and inefficient functionality. In addition, coloring can fade easily and undergo a change in properties when subjected to different pH levels and light.

The overall cost of production of natural food colors is higher than that of synthetic counterparts. The requirement for the vast amount of raw materials in fruits, plants, and other natural sources for the production of aluminum-free natural food colors is non-sustainable and expensive.

These factors are restraining the widespread adoption of aluminum-free natural food colors and are continuing to pose a daunting challenge in the aluminum-free natural food color market.
What is the Regional Outlook for Aluminum-free Natural Food Colors Market?

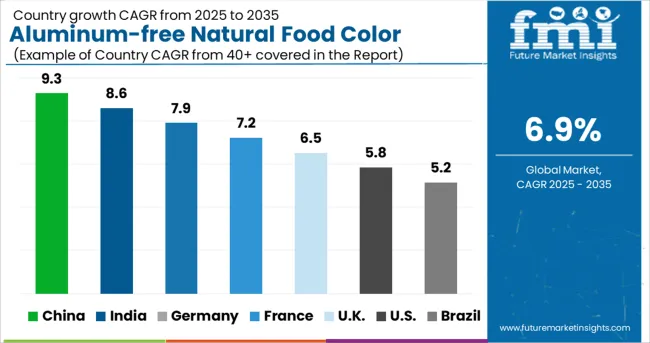
At present, the North American and European regions are anticipated to hold the major shares in the global market of aluminum-free natural food color market. There are stringent regulations across many countries in these regions regarding the usage of aluminum-free natural food colors.

However, on the other hand, the Asia-Pacific region is projected to show lucrative growth opportunities for the market players. The demand for aluminum-free natural food colors is increasing due to increased purchasing power coupled with the growing consumer preference for natural ingredients.

The rising consumption of organic food products has necessitated a shift towards natural and healthier alternatives. The demand for aluminum-free natural food colors is bolstering across these regions and playing a significant role in shaping the aluminum-free natural food colors market growth during the forecast period.

Nandini Roy Choudhury

Principal Consultant

Talk to Analyst

Find your sweet spots for generating winning opportunities in this market.

Key developments and notable factors in the Aluminum-free Natural Food Color Market

Some of the notable developments in the aluminum-free natural food color market are
  • In May 2020, GNT Foods, one of the leading manufacturers of cutting-edge food ingredients based in the USA of America, announced the launch of its two new EXBERRY food colorings which will deliver bright shades of orange in powder and oil-dispersible formats. These colors will be made from carrots and paprika.
  • In October 2021, Givaudan announced its acquisition plans of DDW, The Color House, a US-based natural color company. This acquisition was in line with the former's 2025 strategy to expand its global Taste & Wellbeing business portfolio. Givaudan will become a global leader in natural colors as a result of the acquisition, enhancing its ability to create "Feel Good" Food Experiences via its comprehensive portfolio of flavor and sense solutions.
  • In September 2021, Oterra acquired Diana Food's natural food coloring business. After the acquisition, Oterra fully integrated Diana Food's natural coloring business into its offering. Symrise AG, a leading supplier of flavors, fragrances, nutrition, food, and cosmetic ingredients, currently owns Diana Food. This was Oterra's second acquisition in a short period after acquiring SECNA Natural Ingredients Group in June of the same year.
  • In January 2021, GNT added a pink shade made from fruit and vegetables to its Exberry line of oil-dispersible Coloring Foods. In October of the same year, GNT Group established a number of new sustainability targets as part of its long-term goal of producing zero-carbon emissions from its international operations. The Dutch company revealed seventeen goals for 2030 in its first sustainability report, including plans to reduce the environmental footprint of its Exberry natural food coloring portfolio by 25% and also to deliver comprehensive emissions data for the complete product range. GNT has also set a goal of using 75 percent of its side streams, i.e., the leftover raw material from the production of color concentrates, for human consumption by 2026. It intends to launch a carrot-based offer with an ingredient derived from byproducts by 2023.

Who are some of the notable players in the Aluminum-free Natural Food Color Market?

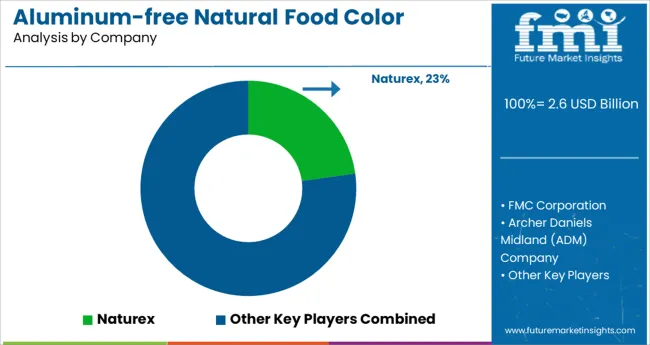
Some of the notable players in the Aluminum-free natural food color market are ADM, NATUREX, Hansen A/S, Döhler GmbH, McCormick & Company, Inc., Kalsec Inc., ROHA Dyechem Pvt. Ltd., San-Ei GEN FFI Inc., DDW The Color House, Diana Food S.A.S., GNT Group B.V., Synthite Industries Ltd.

Get the data you need at a Fraction of the cost

Personalize your report by choosing insights you need
and save 40%!

Report Scope

Report Attribute Details
Growth Rate CAGR of 6.88% from 2022 to 2032
Base Year for Estimation 2021
Historical Data 2015 to 2021
Forecast Period 2022 to 2032
Quantitative Units Revenue in USD Million and CAGR from 2022 to 2032
Report Coverage Revenue Forecast, Volume Forecast, Company Ranking, Competitive Landscape, Growth Factors, Trends, and Pricing Analysis
Segments Covered
  • Type
  • Source
  • Form
  • Application
  • Region
Regions Covered
  • North America
  • Latin America
  • Europe
  • East Asia
  • South Asia
  • Oceania
  • Middle East and Africa
Key Countries Profiled
  • USA
  • Canada
  • Brazil
  • Argentina
  • Germany
  • United Kingdom
  • France
  • Spain
  • Italy
  • Nordics
  • BENELUX
  • Australia & New Zealand
  • China
  • India
  • ASIAN
  • GCC Countries
  • South Africa
Key Companies Profiled
  • ADM
  • NATUREX
  • Hansen A/S
  • Döhler GmbH
  • McCormick & Company, Inc.
  • Kalsec Inc.
  • ROHA Dyechem Pvt. Ltd.
  • San-Ei GEN FFI Inc
  • DDW The Color House
  • Diana Food S.A.S.
  • GNT Group B.V.
  • Synthite Industries Ltd.
Customization Available Upon Request

Key segments profiled in the Aluminum-free Natural Food Color Market

By Type:

  • Anthocyanin
  • Curcumin
  • Carotenoid
  • Others

By Source:

  • Plant
  • Animal
  • Minerals

By Form:

  • Liquid
  • Powder
  • Gel
  • Others

By Application:

  • Dairy
  • Beverages
  • Bakery and Confectionery
  • Others

Frequently Asked Questions

What is the Growth Outlook for the Aluminum-free Natural Food Color Market?

The global aluminum-free natural food color market is projected to advance at a CAGR of 6.88% during the forecast period (2022 to 2032)

What is the major driver contributing to the Aluminum-free Natural Food Color market share of the European and North American countries?

As several countries in the Asia Pacific and North American regions are paying attention to health concerns and are getting more inclined toward consuming food that is free from synthetic ingredients, the aluminum-free natural food color market size of these regions is expanding.

Who are a few key players in the Aluminum0free Natural Food Color Market?

Some of the notable players in the aluminum-free natural food color market are ADM, NATUREX, Hansen A/S, Döhler GmbH, McCormick & Company, Inc., Kalsec Inc., ROHA Dyechem Pvt. Ltd., San-Ei GEN FFI Inc., DDW The Color House, Diana Food S.A.S., GNT Group B.V., and Synthite Industries Ltd.

Table of Content
1. Executive Summary | Aluminum-free Natural Food Color Market
    1.1. Global Market Outlook
    1.2. Demand-side Trends
    1.3. Supply-side Trends
    1.4. Technology Roadmap Analysis
    1.5. Analysis and Recommendations
2. Market Overview
    2.1. Market Coverage / Taxonomy
    2.2. Market Definition / Scope / Limitations
3. Market Background
    3.1. Market Dynamics
        3.1.1. Drivers
        3.1.2. Restraints
        3.1.3. Opportunity
        3.1.4. Trends
    3.2. Scenario Forecast
        3.2.1. Demand in Optimistic Scenario
        3.2.2. Demand in Likely Scenario
        3.2.3. Demand in Conservative Scenario
    3.3. Opportunity Map Analysis
    3.4. Product Life Cycle Analysis
    3.5. Supply Chain Analysis
        3.5.1. Supply Side Participants and Their Roles
            3.5.1.1. Producers
            3.5.1.2. Mid-Level Participants (Traders/ Agents/ Brokers)
            3.5.1.3. Wholesalers and Distributors
        3.5.2. Value Added and Value Created at Node in the Supply Chain
        3.5.3. List of Raw Material Suppliers
        3.5.4. List of Existing and Potential Buyers
    3.6. Investment Feasibility Matrix
    3.7. Value Chain Analysis
        3.7.1. Profit Margin Analysis
        3.7.2. Wholesalers and Distributors
        3.7.3. Retailers
    3.8. PESTLE and Porter’s Analysis
    3.9. Regulatory Landscape
        3.9.1. By Key Regions
        3.9.2. By Key Countries
    3.10. Regional Parent Market Outlook
    3.11. Production and Consumption Statistics
    3.12. Import and Export Statistics
4. Global Market Analysis 2017 to 2021 and Forecast, 2022 to 2032
    4.1. Historical Market Size Value (US$ Million) & Volume (Tons) Analysis, 2017 to 2021
    4.2. Current and Future Market Size Value (US$ Million) & Volume (Tons) Projections, 2022 to 2032
        4.2.1. Y-o-Y Growth Trend Analysis
        4.2.2. Absolute $ Opportunity Analysis
5. Global Market Analysis 2017 to 2021 and Forecast 2022 to 2032, By Type
    5.1. Introduction / Key Findings
    5.2. Historical Market Size Value (US$ Million) & Volume (Tons) Analysis By Type, 2017 to 2021
    5.3. Current and Future Market Size Value (US$ Million) & Volume (Tons) Analysis and Forecast By Type, 2022 to 2032
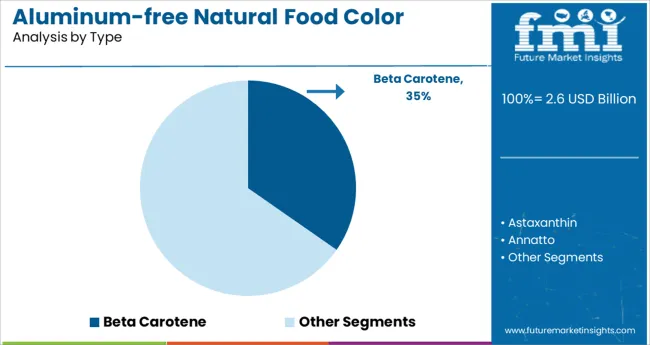
        5.3.1. Beta Carotene
        5.3.2. Astaxanthin
        5.3.3. Annatto
        5.3.4. Curcumin
        5.3.5. Spirulina
        5.3.6. Carmine
    5.4. Y-o-Y Growth Trend Analysis By Type, 2017 to 2021
    5.5. Absolute $ Opportunity Analysis By Type, 2022 to 2032
6. Global Market Analysis 2017 to 2021 and Forecast 2022 to 2032, By End-use Application
    6.1. Introduction / Key Findings
    6.2. Historical Market Size Value (US$ Million) & Volume (Tons) Analysis By End-use Application, 2017 to 2021
    6.3. Current and Future Market Size Value (US$ Million) & Volume (Tons) Analysis and Forecast By End-use Application, 2022 to 2032
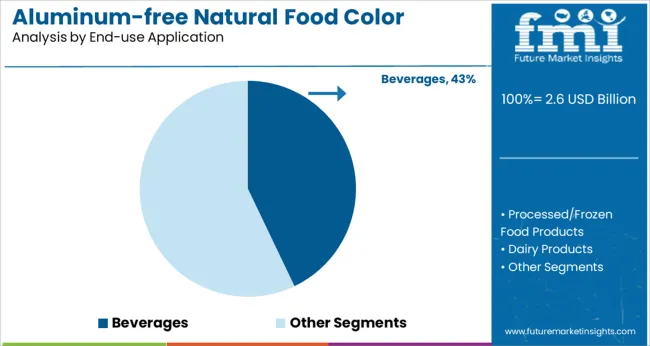
        6.3.1. Processed/Frozen Food Products
        6.3.2. Beverages
        6.3.3. Dairy Products
        6.3.4. Bakery and Confectionary Products
        6.3.5. Others
    6.4. Y-o-Y Growth Trend Analysis By End-use Application, 2017 to 2021
    6.5. Absolute $ Opportunity Analysis By End-use Application, 2022 to 2032
7. Global Market Analysis 2017 to 2021 and Forecast 2022 to 2032, By Region
    7.1. Introduction
    7.2. Historical Market Size Value (US$ Million) & Volume (Tons) Analysis By Region, 2017 to 2021
    7.3. Current Market Size Value (US$ Million) & Volume (Tons) Analysis and Forecast By Region, 2022 to 2032
        7.3.1. North America
        7.3.2. Latin America
        7.3.3. Europe
        7.3.4. Asia Pacific
        7.3.5. Middle East and Africa
    7.4. Market Attractiveness Analysis By Region
8. North America Market Analysis 2017 to 2021 and Forecast 2022 to 2032, By Country
    8.1. Historical Market Size Value (US$ Million) & Volume (Tons) Trend Analysis By Market Taxonomy, 2017 to 2021
    8.2. Market Size Value (US$ Million) & Volume (Tons) Forecast By Market Taxonomy, 2022 to 2032
        8.2.1. By Country
            8.2.1.1. USA
            8.2.1.2. Canada
        8.2.2. By Type
        8.2.3. By End-use Application
    8.3. Market Attractiveness Analysis
        8.3.1. By Country
        8.3.2. By Type
        8.3.3. By End-use Application
    8.4. Key Takeaways
9. Latin America Market Analysis 2017 to 2021 and Forecast 2022 to 2032, By Country
    9.1. Historical Market Size Value (US$ Million) & Volume (Tons) Trend Analysis By Market Taxonomy, 2017 to 2021
    9.2. Market Size Value (US$ Million) & Volume (Tons) Forecast By Market Taxonomy, 2022 to 2032
        9.2.1. By Country
            9.2.1.1. Brazil
            9.2.1.2. Mexico
            9.2.1.3. Rest of Latin America
        9.2.2. By Type
        9.2.3. By End-use Application
    9.3. Market Attractiveness Analysis
        9.3.1. By Country
        9.3.2. By Type
        9.3.3. By End-use Application
    9.4. Key Takeaways
10. Europe Market Analysis 2017 to 2021 and Forecast 2022 to 2032, By Country
    10.1. Historical Market Size Value (US$ Million) & Volume (Tons) Trend Analysis By Market Taxonomy, 2017 to 2021
    10.2. Market Size Value (US$ Million) & Volume (Tons) Forecast By Market Taxonomy, 2022 to 2032
        10.2.1. By Country
            10.2.1.1. Germany
            10.2.1.2. United Kingdom
            10.2.1.3. France
            10.2.1.4. Spain
            10.2.1.5. Italy
            10.2.1.6. Rest of Europe
        10.2.2. By Type
        10.2.3. By End-use Application
    10.3. Market Attractiveness Analysis
        10.3.1. By Country
        10.3.2. By Type
        10.3.3. By End-use Application
    10.4. Key Takeaways
11. Asia Pacific Market Analysis 2017 to 2021 and Forecast 2022 to 2032, By Country
    11.1. Historical Market Size Value (US$ Million) & Volume (Tons) Trend Analysis By Market Taxonomy, 2017 to 2021
    11.2. Market Size Value (US$ Million) & Volume (Tons) Forecast By Market Taxonomy, 2022 to 2032
        11.2.1. By Country
            11.2.1.1. China
            11.2.1.2. Japan
            11.2.1.3. South Korea
            11.2.1.4. Malaysia
            11.2.1.5. Singapore
            11.2.1.6. Australia
            11.2.1.7. New Zealand
            11.2.1.8. Rest of Asia Pacific
        11.2.2. By Type
        11.2.3. By End-use Application
    11.3. Market Attractiveness Analysis
        11.3.1. By Country
        11.3.2. By Type
        11.3.3. By End-use Application
    11.4. Key Takeaways
12. Middle East and Africa Market Analysis 2017 to 2021 and Forecast 2022 to 2032, By Country
    12.1. Historical Market Size Value (US$ Million) & Volume (Tons) Trend Analysis By Market Taxonomy, 2017 to 2021
    12.2. Market Size Value (US$ Million) & Volume (Tons) Forecast By Market Taxonomy, 2022 to 2032
        12.2.1. By Country
            12.2.1.1. GCC Countries
            12.2.1.2. South Africa
            12.2.1.3. Israel
            12.2.1.4. Rest of Middle East and Africa
        12.2.2. By Type
        12.2.3. By End-use Application
    12.3. Market Attractiveness Analysis
        12.3.1. By Country
        12.3.2. By Type
        12.3.3. By End-use Application
    12.4. Key Takeaways
13. Key Countries Market Analysis
    13.1. USA
        13.1.1. Pricing Analysis
        13.1.2. Market Share Analysis, 2021
            13.1.2.1. By Type
            13.1.2.2. By End-use Application
    13.2. Canada
        13.2.1. Pricing Analysis
        13.2.2. Market Share Analysis, 2021
            13.2.2.1. By Type
            13.2.2.2. By End-use Application
    13.3. Brazil
        13.3.1. Pricing Analysis
        13.3.2. Market Share Analysis, 2021
            13.3.2.1. By Type
            13.3.2.2. By End-use Application
    13.4. Mexico
        13.4.1. Pricing Analysis
        13.4.2. Market Share Analysis, 2021
            13.4.2.1. By Type
            13.4.2.2. By End-use Application
    13.5. Germany
        13.5.1. Pricing Analysis
        13.5.2. Market Share Analysis, 2021
            13.5.2.1. By Type
            13.5.2.2. By End-use Application
    13.6. United Kingdom
        13.6.1. Pricing Analysis
        13.6.2. Market Share Analysis, 2021
            13.6.2.1. By Type
            13.6.2.2. By End-use Application
    13.7. France
        13.7.1. Pricing Analysis
        13.7.2. Market Share Analysis, 2021
            13.7.2.1. By Type
            13.7.2.2. By End-use Application
    13.8. Spain
        13.8.1. Pricing Analysis
        13.8.2. Market Share Analysis, 2021
            13.8.2.1. By Type
            13.8.2.2. By End-use Application
    13.9. Italy
        13.9.1. Pricing Analysis
        13.9.2. Market Share Analysis, 2021
            13.9.2.1. By Type
            13.9.2.2. By End-use Application
    13.10. China
        13.10.1. Pricing Analysis
        13.10.2. Market Share Analysis, 2021
            13.10.2.1. By Type
            13.10.2.2. By End-use Application
    13.11. Japan
        13.11.1. Pricing Analysis
        13.11.2. Market Share Analysis, 2021
            13.11.2.1. By Type
            13.11.2.2. By End-use Application
    13.12. South Korea
        13.12.1. Pricing Analysis
        13.12.2. Market Share Analysis, 2021
            13.12.2.1. By Type
            13.12.2.2. By End-use Application
    13.13. Malaysia
        13.13.1. Pricing Analysis
        13.13.2. Market Share Analysis, 2021
            13.13.2.1. By Type
            13.13.2.2. By End-use Application
    13.14. Singapore
        13.14.1. Pricing Analysis
        13.14.2. Market Share Analysis, 2021
            13.14.2.1. By Type
            13.14.2.2. By End-use Application
    13.15. Australia
        13.15.1. Pricing Analysis
        13.15.2. Market Share Analysis, 2021
            13.15.2.1. By Type
            13.15.2.2. By End-use Application
    13.16. New Zealand
        13.16.1. Pricing Analysis
        13.16.2. Market Share Analysis, 2021
            13.16.2.1. By Type
            13.16.2.2. By End-use Application
    13.17. GCC Countries
        13.17.1. Pricing Analysis
        13.17.2. Market Share Analysis, 2021
            13.17.2.1. By Type
            13.17.2.2. By End-use Application
    13.18. South Africa
        13.18.1. Pricing Analysis
        13.18.2. Market Share Analysis, 2021
            13.18.2.1. By Type
            13.18.2.2. By End-use Application
    13.19. Israel
        13.19.1. Pricing Analysis
        13.19.2. Market Share Analysis, 2021
            13.19.2.1. By Type
            13.19.2.2. By End-use Application
14. Market Structure Analysis
    14.1. Competition Dashboard
    14.2. Competition Benchmarking
    14.3. Market Share Analysis of Top Players
        14.3.1. By Regional
        14.3.2. By Type
        14.3.3. By End-use Application
15. Competition Analysis
    15.1. Competition Deep Dive
        15.1.1. Naturex
            15.1.1.1. Overview
            15.1.1.2. Product Portfolio
            15.1.1.3. Profitability by Market Segments
            15.1.1.4. Sales Footprint
            15.1.1.5. Strategy Overview
                15.1.1.5.1. Marketing Strategy
                15.1.1.5.2. Product Strategy
                15.1.1.5.3. Channel Strategy
        15.1.2. FMC Corporation
            15.1.2.1. Overview
            15.1.2.2. Product Portfolio
            15.1.2.3. Profitability by Market Segments
            15.1.2.4. Sales Footprint
            15.1.2.5. Strategy Overview
                15.1.2.5.1. Marketing Strategy
                15.1.2.5.2. Product Strategy
                15.1.2.5.3. Channel Strategy
        15.1.3. Archer Daniels Midland (ADM) Company
            15.1.3.1. Overview
            15.1.3.2. Product Portfolio
            15.1.3.3. Profitability by Market Segments
            15.1.3.4. Sales Footprint
            15.1.3.5. Strategy Overview
                15.1.3.5.1. Marketing Strategy
                15.1.3.5.2. Product Strategy
                15.1.3.5.3. Channel Strategy
        15.1.4. Roha Dyechem Pvt. Ltd.
            15.1.4.1. Overview
            15.1.4.2. Product Portfolio
            15.1.4.3. Profitability by Market Segments
            15.1.4.4. Sales Footprint
            15.1.4.5. Strategy Overview
                15.1.4.5.1. Marketing Strategy
                15.1.4.5.2. Product Strategy
                15.1.4.5.3. Channel Strategy
        15.1.5. DDW The Colour House
            15.1.5.1. Overview
            15.1.5.2. Product Portfolio
            15.1.5.3. Profitability by Market Segments
            15.1.5.4. Sales Footprint
            15.1.5.5. Strategy Overview
                15.1.5.5.1. Marketing Strategy
                15.1.5.5.2. Product Strategy
                15.1.5.5.3. Channel Strategy
        15.1.6. Chr. Hansen A/S
            15.1.6.1. Overview
            15.1.6.2. Product Portfolio
            15.1.6.3. Profitability by Market Segments
            15.1.6.4. Sales Footprint
            15.1.6.5. Strategy Overview
                15.1.6.5.1. Marketing Strategy
                15.1.6.5.2. Product Strategy
                15.1.6.5.3. Channel Strategy
        15.1.7. BASF SE
            15.1.7.1. Overview
            15.1.7.2. Product Portfolio
            15.1.7.3. Profitability by Market Segments
            15.1.7.4. Sales Footprint
            15.1.7.5. Strategy Overview
                15.1.7.5.1. Marketing Strategy
                15.1.7.5.2. Product Strategy
                15.1.7.5.3. Channel Strategy
        15.1.8. Sensient Technologies Corporation
            15.1.8.1. Overview
            15.1.8.2. Product Portfolio
            15.1.8.3. Profitability by Market Segments
            15.1.8.4. Sales Footprint
            15.1.8.5. Strategy Overview
                15.1.8.5.1. Marketing Strategy
                15.1.8.5.2. Product Strategy
                15.1.8.5.3. Channel Strategy
        15.1.9. Allied Biotech Corporation
            15.1.9.1. Overview
            15.1.9.2. Product Portfolio
            15.1.9.3. Profitability by Market Segments
            15.1.9.4. Sales Footprint
            15.1.9.5. Strategy Overview
                15.1.9.5.1. Marketing Strategy
                15.1.9.5.2. Product Strategy
                15.1.9.5.3. Channel Strategy
        15.1.10. Diana Naturals
            15.1.10.1. Overview
            15.1.10.2. Product Portfolio
            15.1.10.3. Profitability by Market Segments
            15.1.10.4. Sales Footprint
            15.1.10.5. Strategy Overview
                15.1.10.5.1. Marketing Strategy
                15.1.10.5.2. Product Strategy
                15.1.10.5.3. Channel Strategy
16. Assumptions & Acronyms Used
17. Research Methodology
Recommendations

Food and Beverage

Food Color Market

March 2024

REP-GB-14818

250 pages

Food and Beverage

Natural Food Colors Market

February 2023

REP-GB-35

350 pages

Food and Beverage

Plant Based Food Colors Market

June 2022

REP-GB-9441

343 pages

Explore Food and Beverage Insights

View Reports
Future Market Insights

Aluminum-free Natural Food Color Market

Schedule a Call