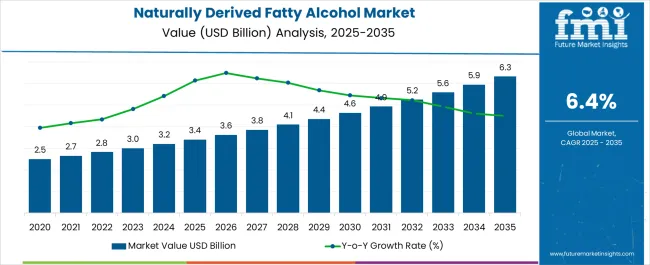
The Naturally Derived Fatty Alcohol Market is estimated to be valued at USD 3.4 billion in 2025 and is projected to reach USD 6.3 billion by 2035, registering a compound annual growth rate (CAGR) of 6.4% over the forecast period.

| Metric | Value |
|---|---|
| Naturally Derived Fatty Alcohol Market Estimated Value in (2025 E) | USD 3.4 billion |
| Naturally Derived Fatty Alcohol Market Forecast Value in (2035 F) | USD 6.3 billion |
| Forecast CAGR (2025 to 2035) | 6.4% |
The naturally derived fatty alcohol market is witnessing consistent expansion, supported by rising demand for bio-based and biodegradable ingredients in home care, personal care, and industrial formulations. Increasing regulatory scrutiny on petrochemical-derived surfactants and a global shift toward sustainable chemical sourcing are contributing to this growth.
Advancements in oleochemical processing, particularly in enzymatic and green chemistry techniques, have enabled efficient extraction and purification of fatty alcohols from renewable feedstocks. Major consumer goods manufacturers are investing in transparent, traceable supply chains to meet sustainability targets, which has further propelled interest in naturally derived raw materials.
As global economies continue to enforce stricter environmental compliance and carbon reduction goals, the market is expected to benefit from greater adoption in both emerging and developed regions across value-added applications.
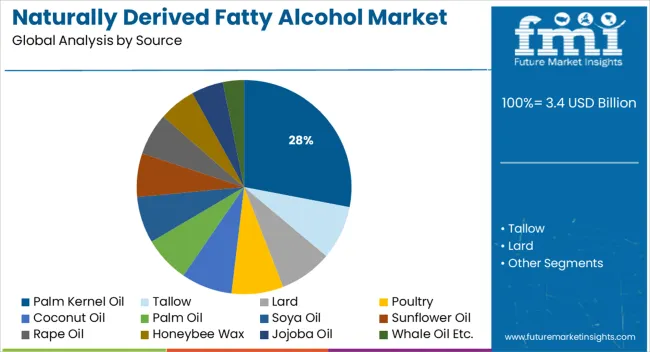
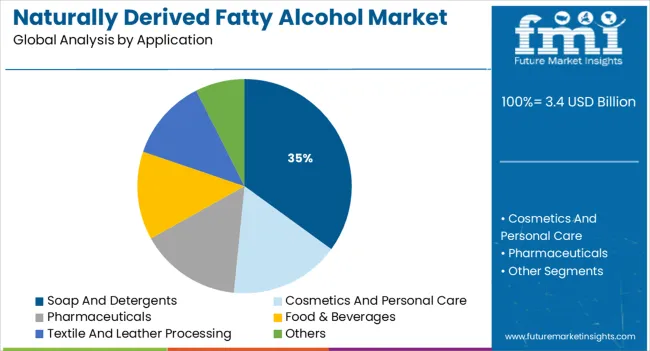
The market is segmented by Source and Application and region. By Source, the market is divided into Palm Kernel Oil, Tallow, Lard, Poultry, Coconut Oil, Palm Oil, Soya Oil, Sunflower Oil, Rape Oil, Honeybee Wax, Jojoba Oil, and Whale Oil Etc.. In terms of Application, the market is classified into Soap And Detergents, Cosmetics And Personal Care, Pharmaceuticals, Food & Beverages, Textile And Leather Processing, and Others. Regionally, the market is classified into North America, Latin America, Western Europe, Eastern Europe, Balkan & Baltic Countries, Russia & Belarus, Central Asia, East Asia, South Asia & Pacific, and the Middle East & Africa.

Palm kernel oil is projected to contribute 28.0% of the total market share in 2025, making it the leading natural source for fatty alcohol production. Its dominance is being driven by high lauric acid content, which allows for efficient conversion into medium-chain fatty alcohols suitable for detergents, emulsifiers, and personal care formulations.
Widespread cultivation in key tropical regions, combined with its cost competitiveness and established supply infrastructure, has strengthened its commercial viability. Sustainable palm sourcing initiatives and RSPO (Roundtable on Sustainable Palm Oil) certifications have improved industry perception and regulatory acceptance of palm-derived inputs.
Its compatibility with continuous processing and ability to yield a consistent quality profile have made palm kernel oil a preferred choice for high-volume manufacturers focused on scalability and formulation reliability.

Soap and detergents are expected to account for 35.0% of the overall market share in 2025, establishing this segment as the dominant application for naturally derived fatty alcohols. This leadership is being supported by growing consumer demand for non-toxic, eco-friendly cleaning products and shifts in formulation standards within the home and fabric care industries.
Naturally derived fatty alcohols serve as key intermediates in the production of fatty alcohol ethoxylates and sulfates—commonly used biodegradable surfactants in soaps and liquid detergents. Heightened environmental awareness, along with stricter ingredient labeling norms, is encouraging major FMCG brands to reformulate existing product lines with renewable feedstocks.
Additionally, favorable pricing trends for natural alcohols and the expansion of green chemistry production facilities have further contributed to their increased adoption across detergent manufacturing globally.
A large portion of the naturally derived fatty alcohol market's revenue is anticipated to come from sales of soaps and detergents. The rising importance of personal hygiene and the rising standard of living in developing nations are expected to fuel the expansion of this naturally derived fatty alcohol market. Additionally, the industry is anticipated to benefit from the growing interest in both household and industrial cleaning products to promote health and safety.
During the foreseen time period, the personal care market is expected to grow into the naturally derived fatty alcohol market's second-largest subsector. The increasing purchasing power of consumers in Asia and the Pacific has led to a surge in demand for luxury personal care items.
The pure and mid-cut section of the naturally derived fatty alcohol market is expected to be worth USD 3.4 billion by the year 2025. The market for product segments is expected to be driven by the increasing demand for pure and mid-cut alcohol, particularly in the Asia-Pacific region.
Sodium Laureth ether sulfate (SLES) is a significant foaming agent used in the production of shampoos and body washes and is derived from fatty alcohols.
The demand for sustainable products has increased around the world as people become more aware of the hazards posed by petroleum-based goods. Companies have started using more sustainable materials in response to rising consumer demand for bio-based products.
Alcohols made from bio-based oleochemicals are recyclable and have a lower toxicity profile than their traditional counterparts. As a result of their low toxicity, these alcohols are in high demand in the cosmetics and pharmaceutical sectors.
One such palm oil and palm kernel oil alcohol is WILFAROL 1698, which is sold by Wilmar International. KLK OLEO, another major producer, sells a line of fatty alcohols made from vegetable oils under the brand name PALMEROL. REACH, and other regulatory agencies efforts to limit the negative environmental impacts of petroleum-based products are another factor expected to fuel the demand for naturally derived fatty alcohol.
Rising demand for surfactants is expected to fuel the naturally derived fatty alcohol industry expansion
Soaps and detergents, which rely on surfactants, are experiencing meteoric growth in demand for naturally derived fatty alcohol. Fatty alcohol surfactants have several applications in the food, fiber, and beauty industries. They serve a variety of purposes, including wetting and cleansing, solubilizing, and emulsifying.
Raw material cost volatility is likely to stunt the development
Tallow, palm oil, rapeseed oil, and others are used in the production of fatty alcohols. Countries in the Asia-Pacific region, such as Indonesia and Malaysia, are important sources of this commodity. Raw materials for other parts of the world, such as North America and Europe, come primarily from Asian countries.
Thus, raw material price swings are sensitive to the trade situations in these areas. Another factor working against the expansion of the naturally derived fatty alcohol market is the Indian government's recent decision to impose limitations on the import of refined palm oil.
In 2024, the Asia Pacific naturally derived fatty alcohol market was worth USD 1.47 billion. As the demand from the personal care & cosmetics, and surfactant sectors continues to rise, it is the primary factor driving naturally derived fatty alcohol market expansion.
The naturally derived fatty alcohol market would expand thanks to the rising middle classes in emerging economies like India, China, and South Korea. Not only is that, but an increase in the usage of soaps and detergents is also being seen in China, the world's largest producer of such products.
The increasing need for surfactants is a major factor in the expansion of the naturally derived fatty alcohol market in North America. Because of the COVID-19 pandemic, there is expected to be a surge in demand for disinfectants and other cleaning supplies in this area. For the duration of the forecast, North America is projected to account for 34.8% of the naturally derived fatty alcohol market.
Demand from the personal care sector is skyrocketing in Europe, shaping the naturally derived fatty alcohol market. Moreover, the rising demand for liquid soaps is another factor driving the expansion of the naturally derived fatty alcohol market.
Nearly 2.5 million tons of soaps and detergents were produced in the European Union in 2020, with detergents and washing preparations accounting for 81% and soap and organic surface-active products accounting for 19%. High demand from a wide variety of lubricant manufacturers is expected to fuel the demand for naturally derived fatty alcohol in Latin America and, the Middle East & Africa.
With the expanding naturally derived fatty alcohol market, both new and established players are beginning to turn their focus to the production of bio-based products. Market leaders for naturally derived fatty alcohols include companies like BASF, P&G, Sasol, Shell Chemicals, Ecogreen oliochemicals, Kao chemicals, Willmar oleo, Musim Mass, Emery Oleo, Oxiteno, Jiahua, etc.
| Report Attribute | Details |
|---|---|
| Growth Rate | 6.4% |
| Base Year for Estimation | 2024 |
| Historical Data | 2020 to 2024 |
| Forecast Period | 2025 to 2035 |
| Quantitative Units | Revenue in USD million and CAGR from 2025 to 2035 |
| Report Coverage | Revenue Forecast, Volume Forecast, Company Ranking, Competitive Landscape, Growth Factors, Trends, and Pricing Analysis |
| Segments Covered | Sources, Application, Region |
| Regions Covered | North America; Latin America; Europe; East Asia; South Asia; Oceania; Middle East and Africa |
| Key Countries Profiled | USA; Canada; Brazil; Argentina; Germany; United Kingdom; France; Spain; Italy; Nordics; BENELUX; Australia & New Zealand; China; India; ASEAN; GCC Countries; South Africa |
| Key Companies Profiled | BASF, Procter & Gamble (P&G), Sasol, Shell Chemicals, Ecogreen oliochemicals, Kao chemicals, Willmar oleo, Musim Mass, Emery Oleo, Oxiteno, Jiahua |
| Customization | Available Upon Request |
The global naturally derived fatty alcohol market is estimated to be valued at USD 3.4 billion in 2025.
The market size for the naturally derived fatty alcohol market is projected to reach USD 6.3 billion by 2035.
The naturally derived fatty alcohol market is expected to grow at a 6.4% CAGR between 2025 and 2035.
The key product types in naturally derived fatty alcohol market are palm kernel oil, tallow, lard, poultry, coconut oil, palm oil, soya oil, sunflower oil, rape oil, honeybee wax, jojoba oil and whale oil etc..
In terms of application, soap and detergents segment to command 35.0% share in the naturally derived fatty alcohol market in 2025.


Our Research Products

The "Full Research Suite" delivers actionable market intel, deep dives on markets or technologies, so clients act faster, cut risk, and unlock growth.

The Leaderboard benchmarks and ranks top vendors, classifying them as Established Leaders, Leading Challengers, or Disruptors & Challengers.

Locates where complements amplify value and substitutes erode it, forecasting net impact by horizon

We deliver granular, decision-grade intel: market sizing, 5-year forecasts, pricing, adoption, usage, revenue, and operational KPIs—plus competitor tracking, regulation, and value chains—across 60 countries broadly.

Spot the shifts before they hit your P&L. We track inflection points, adoption curves, pricing moves, and ecosystem plays to show where demand is heading, why it is changing, and what to do next across high-growth markets and disruptive tech

Real-time reads of user behavior. We track shifting priorities, perceptions of today’s and next-gen services, and provider experience, then pace how fast tech moves from trial to adoption, blending buyer, consumer, and channel inputs with social signals (#WhySwitch, #UX).

Partner with our analyst team to build a custom report designed around your business priorities. From analysing market trends to assessing competitors or crafting bespoke datasets, we tailor insights to your needs.
Supplier Intelligence
Discovery & Profiling
Capacity & Footprint
Performance & Risk
Compliance & Governance
Commercial Readiness
Who Supplies Whom
Scorecards & Shortlists
Playbooks & Docs
Category Intelligence
Definition & Scope
Demand & Use Cases
Cost Drivers
Market Structure
Supply Chain Map
Trade & Policy
Operating Norms
Deliverables
Buyer Intelligence
Account Basics
Spend & Scope
Procurement Model
Vendor Requirements
Terms & Policies
Entry Strategy
Pain Points & Triggers
Outputs
Pricing Analysis
Benchmarks
Trends
Should-Cost
Indexation
Landed Cost
Commercial Terms
Deliverables
Brand Analysis
Positioning & Value Prop
Share & Presence
Customer Evidence
Go-to-Market
Digital & Reputation
Compliance & Trust
KPIs & Gaps
Outputs
Full Research Suite comprises of:
Market outlook & trends analysis
Interviews & case studies
Strategic recommendations
Vendor profiles & capabilities analysis
5-year forecasts
8 regions and 60+ country-level data splits
Market segment data splits
12 months of continuous data updates
DELIVERED AS:
PDF EXCEL ONLINE
Naturally Fermented Food Market Size and Share Forecast Outlook 2025 to 2035
Naturally Cultured Beverages Market
Naturally Derived Sweeteners Market Size and Share Forecast Outlook 2025 to 2035
Analysis and Growth Projections for Pine-derived Chemicals Market
Plant Derived Analgesics Market Size and Share Forecast Outlook 2025 to 2035
Waste-derived Pyrolysis Oil Market Size and Share Forecast Outlook 2025 to 2035
Plant-Derived Hyaluronic Acid Alternatives Market Analysis - Size, Share, and Forecast Outlook 2025 to 2035
Plant-Derived Ceramide Alternatives Market Analysis - Size and Share Forecast Outlook 2025 to 2035
Cocoa-Derived Peptides For Skin Repair Market Size and Share Forecast Outlook 2025 to 2035
Plant Derived Proteins Market Size and Share Forecast Outlook 2025 to 2035
Yeast-derived Collagen Market Analysis – Size, Share, and Forecast Outlook 2025 to 2035
Insect-Derived Proteins in Skincare Market Analysis - Size and Share Forecast Outlook 2025 to 2035
Starch-derived Fiber Market Size and Share Forecast Outlook 2025 to 2035
Marine Derived Proteins Market Size and Share Forecast Outlook 2025 to 2035
Marine-derived Protein Market Analysis - Size, Share and Forecast Outlook 2025 to 2035
Plasma-Derived Drugs Market
Plasma-derived Protein Therapies Market
Coconut Derived Surfactants Market Size and Share Forecast Outlook 2025 to 2035
Seaweed Derived Minerals Market Size and Share Forecast Outlook 2025 to 2035
Sugarcane-Derived Squalane Market Size and Share Forecast Outlook 2025 to 2035

Thank you!
You will receive an email from our Business Development Manager. Please be sure to check your SPAM/JUNK folder too.
Chat With
MaRIA