Yeast-derived Collagen Market Size and Share Forecast Outlook 2025 to 2035

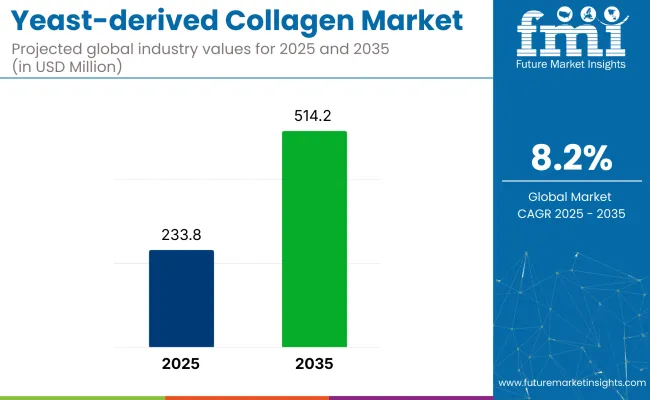
The yeast-derived collagen market is projected to grow from USD 233.8 million in 2025 to USD 514.2 million by 2035, expanding at a CAGR of 8.2%.
Quick Stats for Yeast-Derived Collagen Market

  • Market Value (2025): USD 233.8 million
  • Forecast Value (2035): USD 514.2 million
  • Forecast CAGR (2025-2035): 8.2%
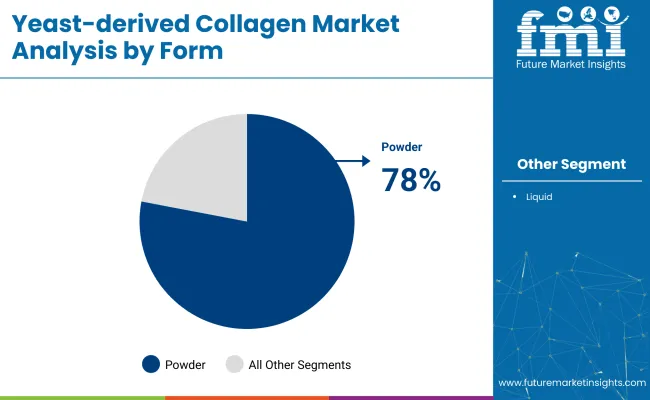
  • Product Leader in 2025: Powder form (78% market share)
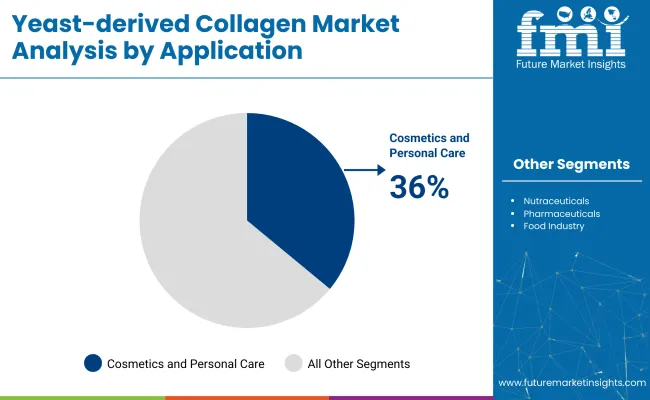
  • Top Distribution Channel: Cosmetics and Personal Care segment (36% application share)
  • Key Growth Region: India (9.6% CAGR)
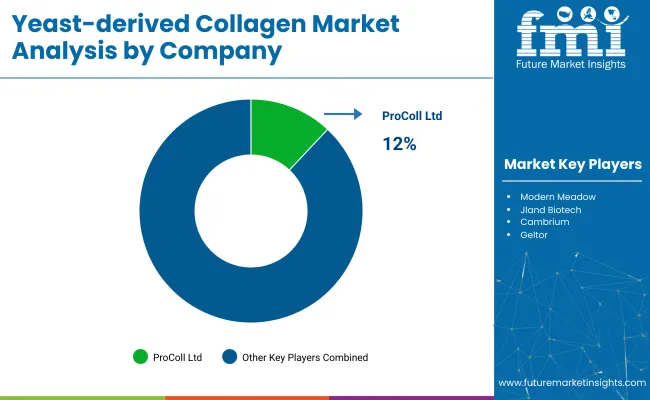
  • Leading Player: ProColl Ltd. (12% market share)

Yeast Derived Collagen Market

Attribute Value
Industry Value (2025) USD 233.8 million
Industry Value (2035) USD 514.2 million
CAGR (2025 to 2035) 8.2%

Demand is being shaped by a shift toward ethical, non-animal collagen alternatives across nutraceutical, cosmetic, and personal care applications. Known for its purity, compatibility, and bio activity, yeast-derived collagen is gaining traction for its benefits in skin elasticity, joint support, and digestive health.

In 2025, powdered forms dominate with a 78% market share due to their ease of formulation. Cosmetics and personal care lead end-use demand with 36% share, while India stands out as the top growth market, advancing at 9.6% CAGR. Leading producers such as ProColl Ltd. hold a 12% share, focusing on bioengineered solutions to meet clean-label and cruelty-free consumer expectations.

Within its parent categories, yeast-derived collagen accounts for 3-4% of the cosmetics and personal care market, roughly 2% of the nutraceuticals segment, and 1.5-2% in biotechnology. Penetration in pharmaceuticals and food ingredients remains below 1%, though functional nutrition use is rising gradually. CEO Alex Lorestani of Geltor notes that its product PrimaColl-classified as Type 21 collagen-delivers high potency in smaller doses, giving it a cost-performance advantage over animal-based counterparts.

Strategic partnerships, such as the Evonik-Jland Biotech collaboration, are helping scale production and expand commercial use in anti-aging and hydrating skincare. This positions yeast-derived collagen as a key innovation across sustainable beauty and wellness platforms.

Alex Lorestani, CEO of Geltor, commented on the company’s yeast-derived offering PrimaColl, stating, “Customers love that it's a Type 21 collagen and therefore a concentrated bioactive, meaning the beneficial effects can be accessed by using less of it in a formulation than you would with an animal-derived collagen.”.

The global cosmetics industry has taken strategic steps to commercialize yeast-derived collagen, as demonstrated by Evonik’s partnership with Jland Biotech. Through this alliance, Evonik aims to supply vegan collagen in commercial volumes for cosmetic applications such as anti-aging and hydrating skincare products. With its compatibility across formulations and rising demand for cruelty-free wellness solutions, yeast-derived collagen is being positioned as a central innovation in the future of sustainable health and beauty markets.

Analysing Yeast-Derived Collagen Market by Top Investment Segments

Global demand for yeast-derived collagen is centered around segments offering plant-based alternatives in cosmetic and supplement applications. The industry is shaped by the popularity of Saccharomyces Cerevisiae, preference for powdered formats, and strong demand from cosmetic formulators targeting collagen-replacement skincare.

Saccharomyces Cerevisiae Emerges as the Preferred Source in 2025

Saccharomyces cerevisiae is projected to lead with a 34% share of the yeast-derived collagen market in 2025. Its well-established role in fermentation, stable protein expression, and compatibility with commercial bioreactors make it the preferred strain for producers.

Firms like Geltor and Evonik use it to create bio-identical collagen suited for skincare, benefiting from smaller peptide chains that support better skin absorption. Its GRAS status across multiple markets also streamlines approvals for nutraceutical applications, helping shorten time-to-market for new product development.
Powder Captures the Bulk of Commercial Demand in 2025

Yeast Derived Collagen Market By Form

Powdered yeast-derived collagen is expected to hold a dominant 78% market share in 2025. Its versatility across formats, extended shelf life, and cost-effective shipping make it ideal for use in cosmetics and dietary supplements.

Players like HumaColl21 and MycoTech supply freeze-dried powders for both contract manufacturing and branded applications, including sachets, creams, and capsules. Powdered forms also suit climate-sensitive regions, ensuring consistent quality in Asia and Africa while supporting private-label expansion in North America and Europe.
Cosmetics Application Leads Market Revenue in 2025

Yeast Derived Collagen Market By Application

Cosmetics are expected to account for 36% of market revenue in 2025, driven by strong demand for cruelty-free and vegan alternatives in beauty care. Yeast-derived collagen is being used in anti-aging creams, serums, and masks that target ingredient transparency and clean-label claims.

Leading beauty companies like L’Oréal and Beiersdorf are integrating microbial collagen into their skincare innovation pipelines to phase out animal-based inputs. Products aimed at the 25-40 demographic increasingly rely on yeast-sourced collagen to anchor "clean beauty" positioning.

Top Yeast-derived Collagen Market Dynamics

Yeast-derived collagen’s market share rose from 8.1% in 2022 to 12.4% in 2025, driven by cosmetics and supplement demand. Production costs exceed animal-derived collagen by 28-35%, while regulatory restrictions and concentrated patent ownership limit wider adoption and industry entry, mainly outside North America and Europe.

Recent Trends in the Yeast-derived Collagen Market

Between 2023 and 2025, yeast-derived collagen expanded its share in the alternative collagen segment from 8.1% to 12.4%. Powder-based formats reached 78% of global product volume, favored by manufacturers for their compatibility with existing supplement delivery systems.

Demand from cosmetics applications accounted for 36% of overall usage in 2025, driven by interest in plant-origin peptides for topical formulations. Products developed using Saccharomyces cerevisiae comprised 34% of global supply, due to its consistent yield in fermentation cycles. Online collagen offerings containing yeast-derived variants recorded a 31.2% increase in SKUs, led by skincare and joint health categories.

Top Yeast-derived Collagen Market Challenge

Cost efficiency remains a constraint, with yeast-derived collagen production priced 28-35% above bovine equivalents due to upstream fermentation scale and downstream protein purification. Regulatory frameworks in markets such as the EU and Japan restrict collagen labeling for non-animal sources, limiting retail flexibility.

Over 60% of related patents are held by a small cluster of firms, raising entry barriers for new players. Access to bioreactors and purification infrastructure is concentrated in North America and Western Europe, limiting production growth in other regions and constraining supply-chain expansion beyond niche or premium-priced segments.
Top Countries Leading Production, Innovation, Distribution, and Demand for Yeast-Derived Collagen

Country Wise Analysis Of Yeast Derived Collagen Market

The report covers detailed analysis of 40+ countries, with the top five countries shared as a reference

Countries CAGR Forecast (2025 to 2035)
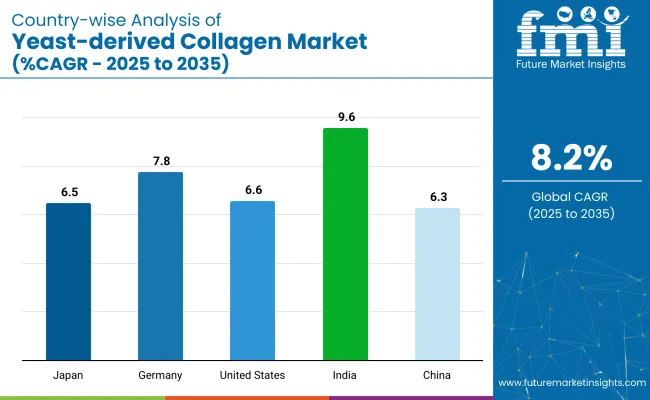
India 9.6%
Germany 7.8%
United States 6.6%
Japan 6.5%
China 6.3%

The global yeast-derived collagen market is set to expand at an 8.2% CAGR between 2025 and 2035. Among the five key markets analyzed from a total of 40, India stands out with the highest growth rate at 9.6%, followed by Germany at 7.8%. The United States, Japan, and China show moderate increases with CAGRs of 6.6%, 6.5%, and 6.3%, respectively.

Compared to the overall average, India exceeds growth expectations by 17%, while Germany, the USA, Japan, and China fall behind by 5% to 23%. This variation stems from India’s rapidly growing biotech industry, Germany’s strong production infrastructure, and steady market demand in the other countries as they adapt to evolving consumer preferences.

India’s Surge in Bioactive Yeast Collagen Applications

India is projected to register the highest CAGR of 9.6% through 2035, with increasing uptake across nutricosmetics, joint health supplements, and functional powders. Between 2023 and 2025, the share of yeast-derived collagen in the ingestible beauty segment grew from 3.1% to 7.4%, driven by D2C brands and Ayurveda-integrated offerings. Market participation expanded across 11 metro clusters, with sachet-based formats priced below ₹60 contributing to over 48% of sales volume in 2024.

  • Online-first collagen SKUs saw a 2.3× increase in monthly active users on Tier I marketplaces.
  • Botanical-collagen combos now account for 38% of India’s yeast collagen-based formulations.
  • Domestic yeast collagen sourcing rose 41% YoY, reducing reliance on imported peptide extracts.

China’s Yeast Collagen Industry Driven by Clean Label Wellness Shift

China’s yeast collagen market is forecast to grow at a CAGR of 6.3% from 2025 to 2035. Functional nutrition products using yeast peptides expanded their category share from 5.8% to 10.6% between 2023 and 2025.

As marine collagen saw a 19% drop in usage due to consumer allergy concerns, yeast-based formats gained traction, particularly in ready-to-consume formats such as gummies and jellies. Zhejiang and Guangdong provinces accounted for 68% of production output in 2024.

  • Yeast collagen gummies recorded a 46% YoY rise in online FMCG orders in 2025.
  • Skin-repair medical supplements using Pichia pastoris collagen expanded by 31% across dermatology chains.
  • Cross-border ecommerceplatforms now list 120+ yeast collagen SKUs, up from 74 in 2022.

The United States Market Trends Centred on Yeast-Based Collagen Alternatives

The industry is set to grow at a CAGR of 6.6% through 2035. Between 2020 and 2024, yeast collagen’s share in vegan collagen supplements rose from 4.2% to 9.1%, driven by athlete-focused formulations and skin health verticals.

California, Oregon, and Colorado host over 65% of yeast collagen biotech fermentation facilities in the USA Average retail pricing of yeast-based collagen fell by 18.4% during 2023, attributed to economies of scale and fermentation tech adoption.

  • Collagen powders with yeast peptides saw 57% shelf penetration in top 3 wellness retail chains.
  • Topical creams using yeast collagen grew at 22% YoY across dermatologist-recommended OTC SKUs.
  • Biotech funding in yeast collagen startups surpassed USD 94 million in 2025.

Functional Collagen Demand Redefining Japan’s Wellness Segment

Japan’s yeast-derived collagen market is projected to grow at 6.5% CAGR from 2025 to 2035. In 2025, 41% of collagen supplements sold in urban pharmacies contained non-animal peptides, up from 27% in 2024.

Product development focused on palatable, low-odor, quick-absorption formats has shortened time-to-consumption across age groups. Yeast peptide jelly sticks and sachets contributed to 53% of all new collagen launches in the past two years.

  • Candida utilis-based peptides achieved 12% market share in Japan’s ingestible collagen segment.
  • Convenience store sales of yeast collagen formats rose 2.1× between 2023 and 2025.
  • Private-label yeast collagen launches increased 38% YoY among domestic supplement firms.

Germany’s Shift Toward Yeast Peptides in Dermatology and Wellness

Germany’s yeast collagen industry is likely to reach at a CAGR of 7.8% through 2035. In 2024, dermatology-focused formulations contributed to 44% of yeast collagen consumption, with the remainder distributed between beverage, snack, and pharma-grade formats.

Germany accounted for 28% of Europe’s yeast collagen production capacity as of Q1 2025. Large pharmacy chains and specialty retailers reported a 3.4× increase in collagen-linked basket value compared to 2025.
  • OTC derma creams with yeast peptides grew 29% YoY in unit sales across 6 major pharmacy chains.
  • Vegan collagen beverages now account for 15.7% of Germany’s functional drink category.
  • Lab-certified yeast collagen SKUs have increased from 47 in 2021 to 113 in 2024.

Leading Yeast-derived Collagen Suppliers

Yeast Derived Collagen Market By Company

ProColl Ltd., Modern Meadow, and Geltor lead the yeast-derived collagen market with distinct product strategies and R&D pipelines. Geltor has developed designer collagen tailored for cosmetics and personal care, while Modern Meadow leverages biofabrication to develop protein materials for skin applications.

Cambrium and Jland Biotech are expanding their reach by investing in formulation partnerships and exploring alternative collagen structures to differentiate their offerings. The space remains moderately consolidated, with a few specialized players driving most of the commercial progress. High R&D costs, IP concentration, and regulatory complexities act as entry barriers for new entrants.

Recent Yeast-derived Collagen Industry News

  • In February 2025, Modern Meadow announced a collaboration with BASF to scale microbial collagen for skincare formulations.
  • Cambrium introduced a proprietary molecular design platform in April 2025, enabling rapid prototyping of collagen variants for biomedical use.
  • In May 2024, Geltor completed the acquisition of a USA-based biofermentationstartup to enhance strain productivity and reduce time-to-market.

Leading Players

  • ProColl Ltd.;
  • Modern Meadow;
  • Jland Biotech;
  • Cambrium;
  • Geltor

Report Scope

Attribute Details
Market Size (2025) USD 233.8 million
Projected Market Size (2035) USD 514.2 million
CAGR (2025 to 2035) 8.2%
Base Year for Estimation 2024
Historical Period 2020 to 2024
Forecast Period 2025 to 2035
Quantitative Units USD million for value
Segments by Source Saccharomyces Cerevisiae, Candida Utilis, Pichia Pastoris, Others
Segments by Form Powder, Liquid
Segments by Application Cosmetics & Personal Care, Nutraceuticals, Pharmaceuticals, Food Industry
Regions Covered North America, Latin America, East Asia, South Asia, Europe, Middle East & Africa
Countries Covered United States, Canada, Brazil, Mexico, United Kingdom, Germany, France, Italy, China, Japan, South Korea, India, Indonesia, UAE, Saudi Arabia, South Africa
Key Manufacturers ProColl Ltd., Modern Meadow, Jland Biotech, Cambrium, Geltor
Additional Attributes Dollar sales, share by application and source, rising demand for animal-free ingredients in skin care and wellness, expanding nutraceutical formulation base, country-specific regulatory drivers and labeling norms

Key Segments

By Source:

The industry has been categorized into Saccharomyces Cerevisiae, Candida Utilis, Pichia Pastoris, Others

By Form:

As per Form, the industry has been categorized into Powder, Liquid

By Application:

As per Application, the industry has been categorized into Cosmetics and Personal Care, Nutraceuticals, Pharmaceuticals, Food Industry

By Region:

Industry analysis has been carried out in key countries of North America, Latin America, East Asia, South Asia Europe and Middle East & Africa.

Table of Content

  1. Executive Summary
    • Global Market Outlook
    • Demand-side Trends
    • Supply-side Trends
    • Technology Roadmap Analysis
    • Analysis and Recommendations
  2. Market Overview
    • Market Coverage/Taxonomy
    • Market Definition/Scope/Limitations
  3. Market Background
    • Market Dynamics
      • Drivers
      • Restraints
      • Opportunity
      • Trends
    • Scenario Forecast
      • Demand in Optimistic Scenario
      • Demand in Likely Scenario
      • Demand in Conservative Scenario
    • Opportunity Map Analysis
    • Product Life Cycle Analysis
    • Supply Chain Analysis
      • Supply Side Participants and their Roles
        • Producers
        • Mid-Level Participants (Traders/ Agents/ Brokers)
        • Wholesalers and Distributors
      • Value Added and Value Created at Node in the Supply Chain
      • List of Raw Material Suppliers
      • List of Existing and Potential Buyer’s
    • Investment Feasibility Matrix
    • Value Chain Analysis
      • Profit Margin Analysis
      • Wholesalers and Distributors
      • Retailers
    • PESTLE and Porter’s Analysis
    • Regulatory Landscape
      • By Key Regions
      • By Key Countries
    • Regional Parent Market Outlook
    • Production and Consumption Statistics
    • Import and Export Statistics
  4. Global Market Analysis 2020 to 2024 and Forecast, 2025 to 2035
    • Historical Market Size Value (USD Billion) & Volume (MT) Analysis, 2020 to 2024
    • Current and Future Market Size Value (USD Billion) & Volume (MT) Projections, 2025 to 2035
      • Y-o-Y Growth Trend Analysis
      • Absolute $ Opportunity Analysis
  5. Global Market Pricing Analysis 2020 to 2024 and Forecast 2025 to 2035
  6. Global Market Analysis 2020 to 2024 and Forecast 2025 to 2035, By Source
    • Introduction/Key Findings
    • Historical Market Size Value (USD Billion) & Volume (MT) Analysis By Source, 2020 to 2024
    • Current and Future Market Size Value (USD Billion) & Volume (MT) Analysis and Forecast By Source, 2025 to 2035
      • Saccharomyces Cerevisiae
      • Candida Utilis
      • Pichia Pastoris
      • Others
    • Y-o-Y Growth Trend Analysis By Source, 2020 to 2024
    • Absolute $ Opportunity Analysis By Source, 2025 to 2035
  7. Global Market Analysis 2020 to 2024 and Forecast 2025 to 2035, By Form
    • Introduction/Key Findings
    • Historical Market Size Value (USD Billion) & Volume (MT) Analysis By Form, 2020 to 2024
    • Current and Future Market Size Value (USD Billion) & Volume (MT) Analysis and Forecast By Form, 2025 to 2035
      • Powder
      • Liquid
    • Y-o-Y Growth Trend Analysis By Form, 2020 to 2024
    • Absolute $ Opportunity Analysis By Form, 2025 to 2035
  8. Global Market Analysis 2020 to 2024 and Forecast 2025 to 2035, By Application
    • Introduction/Key Findings
    • Historical Market Size Value (USD Billion) & Volume (MT) Analysis By Application, 2020 to 2024
    • Current and Future Market Size Value (USD Billion) & Volume (MT) Analysis and Forecast By Application, 2025 to 2035
      • Cosmetics and Personal Care
      • Nutraceuticals
      • Pharmaceuticals
      • Food Industry
    • Y-o-Y Growth Trend Analysis By Application, 2020 to 2024
    • Absolute $ Opportunity Analysis By Application, 2025 to 2035
  9. Global Market Analysis 2020 to 2024 and Forecast 2025 to 2035, By Region
    • Introduction
    • Historical Market Size Value (USD Billion) & Volume (MT) Analysis By Region, 2020 to 2024
    • Current Market Size Value (USD Billion) & Volume (MT) Analysis and Forecast By Region, 2025 to 2035
      • North America
      • Latin America
      • Western Europe
      • Eastern Europe
      • East Asia
      • South Asia & Pacific
      • Middle East and Africa
    • Market Attractiveness Analysis By Region
  10. North America Market Analysis 2020 to 2024 and Forecast 2025 to 2035, By Country
    • Historical Market Size Value (USD Billion) & Volume (MT) Trend Analysis By Market Taxonomy, 2020 to 2024
    • Market Size Value (USD Billion) & Volume (MT) Forecast By Market Taxonomy, 2025 to 2035
      • By Country
        • USA
        • Canada
        • Mexico
      • By Source
      • By Form
      • By Application
    • Market Attractiveness Analysis
      • By Country
      • By Source
      • By Form
      • By Application
    • Key Takeaways
  11. Latin America Market Analysis 2020 to 2024 and Forecast 2025 to 2035, By Country
    • Historical Market Size Value (USD Billion) & Volume (MT) Trend Analysis By Market Taxonomy, 2020 to 2024
    • Market Size Value (USD Billion) & Volume (MT) Forecast By Market Taxonomy, 2025 to 2035
      • By Country
        • Brazil
        • Argentina
        • Rest of LATAM
      • By Source
      • By Form
      • By Application
    • Market Attractiveness Analysis
      • By Country
      • By Source
      • By Form
      • By Application
    • Key Takeaways
  12. Western Europe Market Analysis 2020 to 2024 and Forecast 2025 to 2035, By Country
    • Historical Market Size Value (USD Billion) & Volume (MT) Trend Analysis By Market Taxonomy, 2020 to 2024
    • Market Size Value (USD Billion) & Volume (MT) Forecast By Market Taxonomy, 2025 to 2035
      • By Country
        • Germany
        • Italy
        • France
        • UK
        • Spain
        • BENELUX
        • Nordic
        • Rest of W.Europe
      • By Source
      • By Form
      • By Application
    • Market Attractiveness Analysis
      • By Country
      • By Source
      • By Form
      • By Application
    • Key Takeaways
  13. Eastern Europe Market Analysis 2020 to 2024 and Forecast 2025 to 2035, By Country
    • Historical Market Size Value (USD Billion) & Volume (MT) Trend Analysis By Market Taxonomy, 2020 to 2024
    • Market Size Value (USD Billion) & Volume (MT) Forecast By Market Taxonomy, 2025 to 2035
      • By Country
        • Russia
        • Hungary
        • Poland
        • Balkan & Baltics
        • Rest of E. Europe
      • By Source
      • By Form
      • By Application
    • Market Attractiveness Analysis
      • By Country
      • By Source
      • By Form
      • By Application
    • Key Takeaways
  14. East Asia Market Analysis 2020 to 2024 and Forecast 2025 to 2035, By Country
    • Historical Market Size Value (USD Billion) & Volume (MT) Trend Analysis By Market Taxonomy, 2020 to 2024
    • Market Size Value (USD Billion) & Volume (MT) Forecast By Market Taxonomy, 2025 to 2035
      • By Country
        • China
        • Japan
        • South Korea
      • By Source
      • By Form
      • By Application
    • Market Attractiveness Analysis
      • By Country
      • By Source
      • By Form
      • By Application
    • Key Takeaways
  15. South Asia & Pacific Market Analysis 2020 to 2024 and Forecast 2025 to 2035, By Country
    • Historical Market Size Value (USD Billion) & Volume (MT) Trend Analysis By Market Taxonomy, 2020 to 2024
    • Market Size Value (USD Billion) & Volume (MT) Forecast By Market Taxonomy, 2025 to 2035
      • By Country
        • India
        • Australia & New Zealand
        • ASEAN
        • Rest of SAP
      • By Source
      • By Form
      • By Application
    • Market Attractiveness Analysis
      • By Country
      • By Source
      • By Form
      • By Application
    • Key Takeaways
  16. Middle East and Africa Market Analysis 2020 to 2024 and Forecast 2025 to 2035, By Country
    • Historical Market Size Value (USD Billion) & Volume (MT) Trend Analysis By Market Taxonomy, 2020 to 2024
    • Market Size Value (USD Billion) & Volume (MT) Forecast By Market Taxonomy, 2025 to 2035
      • By Country
        • GCC Countries
        • Northern Africa
        • South Africa
        • Turkiye
        • Rest of MEA
      • By Source
      • By Form
      • By Application
    • Market Attractiveness Analysis
      • By Country
      • By Source
      • By Form
      • By Application
    • Key Takeaways
  17. Key Countries Market Analysis
    • USA
      • Pricing Analysis
      • Market Share Analysis, 2024
        • By Source
        • By Form
        • By Application
    • Canada
      • Pricing Analysis
      • Market Share Analysis, 2024
        • By Source
        • By Form
        • By Application
    • Brazil
      • Pricing Analysis
      • Market Share Analysis, 2024
        • By Source
        • By Form
        • By Application
    • Mexico
      • Pricing Analysis
      • Market Share Analysis, 2024
        • By Source
        • By Form
        • By Application
    • Argentina
      • Pricing Analysis
      • Market Share Analysis, 2024
        • By Source
        • By Form
        • By Application
  18. Market Structure Analysis
    • Competition Dashboard
    • Competition Benchmarking
    • Market Share Analysis of Top Players
      • By Regional
      • By Source
      • By Form
      • By Application
  19. Competition Analysis
    • Competition Deep Dive
      • ProColl Ltd.;
        • Overview
        • Product Portfolio
        • Profitability by Market Segments (Product/Age /Sales Channel/Region)
        • Sales Footprint
        • Strategy Overview
          • Marketing Strategy
          • Product Strategy
          • Channel Strategy
      • Modern Meadow;
        • Overview
        • Product Portfolio
        • Profitability by Market Segments (Product/Age /Sales Channel/Region)
        • Sales Footprint
        • Strategy Overview
          • Marketing Strategy
          • Product Strategy
          • Channel Strategy
      • Jland Biotech;
        • Overview
        • Product Portfolio
        • Profitability by Market Segments (Product/Age /Sales Channel/Region)
        • Sales Footprint
        • Strategy Overview
          • Marketing Strategy
          • Product Strategy
          • Channel Strategy
      • Cambrium;
        • Overview
        • Product Portfolio
        • Profitability by Market Segments (Product/Age /Sales Channel/Region)
        • Sales Footprint
        • Strategy Overview
          • Marketing Strategy
          • Product Strategy
          • Channel Strategy
      • Geltor
        • Overview
        • Product Portfolio
        • Profitability by Market Segments (Product/Age /Sales Channel/Region)
        • Sales Footprint
        • Strategy Overview
          • Marketing Strategy
          • Product Strategy
          • Channel Strategy
  20. Assumptions & Acronyms Used
  21. Research Methodology

List of Tables

  • Table 1: Global Market Value (USD Billion) Forecast by Region, 2020-2035
  • Table 2: Global Market Volume (MT) Forecast by Region, 2020-2035
  • Table 3: Global Market Value (USD Billion) Forecast by Source, 2020-2035
  • Table 4: Global Market Volume (MT) Forecast by Source, 2020-2035
  • Table 5: Global Market Value (USD Billion) Forecast by Form, 2020-2035
  • Table 6: Global Market Volume (MT) Forecast by Form, 2020-2035
  • Table 7: Global Market Value (USD Billion) Forecast by Application, 2020-2035
  • Table 8: Global Market Volume (MT) Forecast by Application, 2020-2035
  • Table 9: North America Market Value (USD Billion) Forecast by Country, 2020-2035
  • Table 10: North America Market Volume (MT) Forecast by Country, 2020-2035
  • Table 11: North America Market Value (USD Billion) Forecast by Source, 2020-2035
  • Table 12: North America Market Volume (MT) Forecast by Source, 2020-2035
  • Table 13: North America Market Value (USD Billion) Forecast by Form, 2020-2035
  • Table 14: North America Market Volume (MT) Forecast by Form, 2020-2035
  • Table 15: North America Market Value (USD Billion) Forecast by Application, 2020-2035
  • Table 16: North America Market Volume (MT) Forecast by Application, 2020-2035
  • Table 17: Latin America Market Value (USD Billion) Forecast by Country, 2020-2035
  • Table 18: Latin America Market Volume (MT) Forecast by Country, 2020-2035
  • Table 19: Latin America Market Value (USD Billion) Forecast by Source, 2020-2035
  • Table 20: Latin America Market Volume (MT) Forecast by Source, 2020-2035
  • Table 21: Latin America Market Value (USD Billion) Forecast by Form, 2020-2035
  • Table 22: Latin America Market Volume (MT) Forecast by Form, 2020-2035
  • Table 23: Latin America Market Value (USD Billion) Forecast by Application, 2020-2035
  • Table 24: Latin America Market Volume (MT) Forecast by Application, 2020-2035
  • Table 25: Western Europe Market Value (USD Billion) Forecast by Country, 2020-2035
  • Table 26: Western Europe Market Volume (MT) Forecast by Country, 2020-2035
  • Table 27: Western Europe Market Value (USD Billion) Forecast by Source, 2020-2035
  • Table 28: Western Europe Market Volume (MT) Forecast by Source, 2020-2035
  • Table 29: Western Europe Market Value (USD Billion) Forecast by Form, 2020-2035
  • Table 30: Western Europe Market Volume (MT) Forecast by Form, 2020-2035
  • Table 31: Western Europe Market Value (USD Billion) Forecast by Application, 2020-2035
  • Table 32: Western Europe Market Volume (MT) Forecast by Application, 2020-2035
  • Table 33: Eastern Europe Market Value (USD Billion) Forecast by Country, 2020-2035
  • Table 34: Eastern Europe Market Volume (MT) Forecast by Country, 2020-2035
  • Table 35: Eastern Europe Market Value (USD Billion) Forecast by Source, 2020-2035
  • Table 36: Eastern Europe Market Volume (MT) Forecast by Source, 2020-2035
  • Table 37: Eastern Europe Market Value (USD Billion) Forecast by Form, 2020-2035
  • Table 38: Eastern Europe Market Volume (MT) Forecast by Form, 2020-2035
  • Table 39: Eastern Europe Market Value (USD Billion) Forecast by Application, 2020-2035
  • Table 40: Eastern Europe Market Volume (MT) Forecast by Application, 2020-2035
  • Table 41: East Asia Market Value (USD Billion) Forecast by Country, 2020-2035
  • Table 42: East Asia Market Volume (MT) Forecast by Country, 2020-2035
  • Table 43: East Asia Market Value (USD Billion) Forecast by Source, 2020-2035
  • Table 44: East Asia Market Volume (MT) Forecast by Source, 2020-2035
  • Table 45: East Asia Market Value (USD Billion) Forecast by Form, 2020-2035
  • Table 46: East Asia Market Volume (MT) Forecast by Form, 2020-2035
  • Table 47: East Asia Market Value (USD Billion) Forecast by Application, 2020-2035
  • Table 48: East Asia Market Volume (MT) Forecast by Application, 2020-2035
  • Table 49: South Asia & Pacific Market Value (USD Billion) Forecast by Country, 2020-2035
  • Table 50: South Asia & Pacific Market Volume (MT) Forecast by Country, 2020-2035
  • Table 51: South Asia & Pacific Market Value (USD Billion) Forecast by Source, 2020-2035
  • Table 52: South Asia & Pacific Market Volume (MT) Forecast by Source, 2020-2035
  • Table 53: South Asia & Pacific Market Value (USD Billion) Forecast by Form, 2020-2035
  • Table 54: South Asia & Pacific Market Volume (MT) Forecast by Form, 2020-2035
  • Table 55: South Asia & Pacific Market Value (USD Billion) Forecast by Application, 2020-2035
  • Table 56: South Asia & Pacific Market Volume (MT) Forecast by Application, 2020-2035
  • Table 57: Middle East and Africa Market Value (USD Billion) Forecast by Country, 2020-2035
  • Table 58: Middle East and Africa Market Volume (MT) Forecast by Country, 2020-2035
  • Table 59: Middle East and Africa Market Value (USD Billion) Forecast by Source, 2020-2035
  • Table 60: Middle East and Africa Market Volume (MT) Forecast by Source, 2020-2035
  • Table 61: Middle East and Africa Market Value (USD Billion) Forecast by Form, 2020-2035
  • Table 62: Middle East and Africa Market Volume (MT) Forecast by Form, 2020-2035
  • Table 63: Middle East and Africa Market Value (USD Billion) Forecast by Application, 2020-2035
  • Table 64: Middle East and Africa Market Volume (MT) Forecast by Application, 2020-2035

List of Figures

  • Figure 1: Global Market Volume (MT) Forecast 2020-2035
  • Figure 2: Global Market Pricing Analysis
  • Figure 3: Global Market Value (USD Billion) Forecast 2020-2035
  • Figure 4: Global Market Value Share and BPS Analysis by Source, 2025 and 2035
  • Figure 5: Global Market Y-o-Y Growth Comparison by Source, 2025-2035
  • Figure 6: Global Market Attractiveness Analysis by Source
  • Figure 7: Global Market Value Share and BPS Analysis by Form, 2025 and 2035
  • Figure 8: Global Market Y-o-Y Growth Comparison by Form, 2025-2035
  • Figure 9: Global Market Attractiveness Analysis by Form
  • Figure 10: Global Market Value Share and BPS Analysis by Application, 2025 and 2035
  • Figure 11: Global Market Y-o-Y Growth Comparison by Application, 2025-2035
  • Figure 12: Global Market Attractiveness Analysis by Application
  • Figure 13: Global Market Value (USD Billion) Share and BPS Analysis by Region, 2025 and 2035
  • Figure 14: Global Market Y-o-Y Growth Comparison by Region, 2025-2035
  • Figure 15: Global Market Attractiveness Analysis by Region
  • Figure 16: North America Market Incremental $ Opportunity, 2025-2035
  • Figure 17: Latin America Market Incremental $ Opportunity, 2025-2035
  • Figure 18: Western Europe Market Incremental $ Opportunity, 2025-2035
  • Figure 19: Eastern Europe Market Incremental $ Opportunity, 2025-2035
  • Figure 20: East Asia Market Incremental $ Opportunity, 2025-2035
  • Figure 21: South Asia & Pacific Market Incremental $ Opportunity, 2025-2035
  • Figure 22: Middle East and Africa Market Incremental $ Opportunity, 2025-2035
  • Figure 23: North America Market Value Share and BPS Analysis by Country, 2025 and 2035
  • Figure 24: North America Market Value Share and BPS Analysis by Source, 2025 and 2035
  • Figure 25: North America Market Y-o-Y Growth Comparison by Source, 2025-2035
  • Figure 26: North America Market Attractiveness Analysis by Source
  • Figure 27: North America Market Value Share and BPS Analysis by Form, 2025 and 2035
  • Figure 28: North America Market Y-o-Y Growth Comparison by Form, 2025-2035
  • Figure 29: North America Market Attractiveness Analysis by Form
  • Figure 30: North America Market Value Share and BPS Analysis by Application, 2025 and 2035
  • Figure 31: North America Market Y-o-Y Growth Comparison by Application, 2025-2035
  • Figure 32: North America Market Attractiveness Analysis by Application
  • Figure 33: Latin America Market Value Share and BPS Analysis by Country, 2025 and 2035
  • Figure 34: Latin America Market Value Share and BPS Analysis by Source, 2025 and 2035
  • Figure 35: Latin America Market Y-o-Y Growth Comparison by Source, 2025-2035
  • Figure 36: Latin America Market Attractiveness Analysis by Source
  • Figure 37: Latin America Market Value Share and BPS Analysis by Form, 2025 and 2035
  • Figure 38: Latin America Market Y-o-Y Growth Comparison by Form, 2025-2035
  • Figure 39: Latin America Market Attractiveness Analysis by Form
  • Figure 40: Latin America Market Value Share and BPS Analysis by Application, 2025 and 2035
  • Figure 41: Latin America Market Y-o-Y Growth Comparison by Application, 2025-2035
  • Figure 42: Latin America Market Attractiveness Analysis by Application
  • Figure 43: Western Europe Market Value Share and BPS Analysis by Country, 2025 and 2035
  • Figure 44: Western Europe Market Value Share and BPS Analysis by Source, 2025 and 2035
  • Figure 45: Western Europe Market Y-o-Y Growth Comparison by Source, 2025-2035
  • Figure 46: Western Europe Market Attractiveness Analysis by Source
  • Figure 47: Western Europe Market Value Share and BPS Analysis by Form, 2025 and 2035
  • Figure 48: Western Europe Market Y-o-Y Growth Comparison by Form, 2025-2035
  • Figure 49: Western Europe Market Attractiveness Analysis by Form
  • Figure 50: Western Europe Market Value Share and BPS Analysis by Application, 2025 and 2035
  • Figure 51: Western Europe Market Y-o-Y Growth Comparison by Application, 2025-2035
  • Figure 52: Western Europe Market Attractiveness Analysis by Application
  • Figure 53: Eastern Europe Market Value Share and BPS Analysis by Country, 2025 and 2035
  • Figure 54: Eastern Europe Market Value Share and BPS Analysis by Source, 2025 and 2035
  • Figure 55: Eastern Europe Market Y-o-Y Growth Comparison by Source, 2025-2035
  • Figure 56: Eastern Europe Market Attractiveness Analysis by Source
  • Figure 57: Eastern Europe Market Value Share and BPS Analysis by Form, 2025 and 2035
  • Figure 58: Eastern Europe Market Y-o-Y Growth Comparison by Form, 2025-2035
  • Figure 59: Eastern Europe Market Attractiveness Analysis by Form
  • Figure 60: Eastern Europe Market Value Share and BPS Analysis by Application, 2025 and 2035
  • Figure 61: Eastern Europe Market Y-o-Y Growth Comparison by Application, 2025-2035
  • Figure 62: Eastern Europe Market Attractiveness Analysis by Application
  • Figure 63: East Asia Market Value Share and BPS Analysis by Country, 2025 and 2035
  • Figure 64: East Asia Market Value Share and BPS Analysis by Source, 2025 and 2035
  • Figure 65: East Asia Market Y-o-Y Growth Comparison by Source, 2025-2035
  • Figure 66: East Asia Market Attractiveness Analysis by Source
  • Figure 67: East Asia Market Value Share and BPS Analysis by Form, 2025 and 2035
  • Figure 68: East Asia Market Y-o-Y Growth Comparison by Form, 2025-2035
  • Figure 69: East Asia Market Attractiveness Analysis by Form
  • Figure 70: East Asia Market Value Share and BPS Analysis by Application, 2025 and 2035
  • Figure 71: East Asia Market Y-o-Y Growth Comparison by Application, 2025-2035
  • Figure 72: East Asia Market Attractiveness Analysis by Application
  • Figure 73: South Asia & Pacific Market Value Share and BPS Analysis by Country, 2025 and 2035
  • Figure 74: South Asia & Pacific Market Value Share and BPS Analysis by Source, 2025 and 2035
  • Figure 75: South Asia & Pacific Market Y-o-Y Growth Comparison by Source, 2025-2035
  • Figure 76: South Asia & Pacific Market Attractiveness Analysis by Source
  • Figure 77: South Asia & Pacific Market Value Share and BPS Analysis by Form, 2025 and 2035
  • Figure 78: South Asia & Pacific Market Y-o-Y Growth Comparison by Form, 2025-2035
  • Figure 79: South Asia & Pacific Market Attractiveness Analysis by Form
  • Figure 80: South Asia & Pacific Market Value Share and BPS Analysis by Application, 2025 and 2035
  • Figure 81: South Asia & Pacific Market Y-o-Y Growth Comparison by Application, 2025-2035
  • Figure 82: South Asia & Pacific Market Attractiveness Analysis by Application
  • Figure 83: Middle East and Africa Market Value Share and BPS Analysis by Country, 2025 and 2035
  • Figure 84: Middle East and Africa Market Value Share and BPS Analysis by Source, 2025 and 2035
  • Figure 85: Middle East and Africa Market Y-o-Y Growth Comparison by Source, 2025-2035
  • Figure 86: Middle East and Africa Market Attractiveness Analysis by Source
  • Figure 87: Middle East and Africa Market Value Share and BPS Analysis by Form, 2025 and 2035
  • Figure 88: Middle East and Africa Market Y-o-Y Growth Comparison by Form, 2025-2035
  • Figure 89: Middle East and Africa Market Attractiveness Analysis by Form
  • Figure 90: Middle East and Africa Market Value Share and BPS Analysis by Application, 2025 and 2035
  • Figure 91: Middle East and Africa Market Y-o-Y Growth Comparison by Application, 2025-2035
  • Figure 92: Middle East and Africa Market Attractiveness Analysis by Application
  • Figure 93: Global Market - Tier Structure Analysis
  • Figure 94: Global Market - Company Share Analysis

Frequently Asked Questions

What is the projected market value of the yeast-derived collagen industry by 2035?

The market is expected to reach USD 514.2 million by 2035.

What CAGR is the yeast-derived collagen market forecast to register between 2025 and 2035?

The industry is projected to grow at a CAGR of 8.2%.

Which product form holds the largest market share in 2025?

Powder form dominates with a 78% industry share in 2025.

Which yeast source leads the market share in 2025?

Saccharomyces cerevisiae leads with a 34% share.

Which country is forecasted to have the highest CAGR in the yeast-derived collagen market from 2025 to 2035?

India is expected to grow at the highest CAGR of 9.6%.

Explore Similar Insights

Future Market Insights

Yeast-derived Collagen Market