Collagen Drinks Market Outlook and Forecast 2025 to 2035

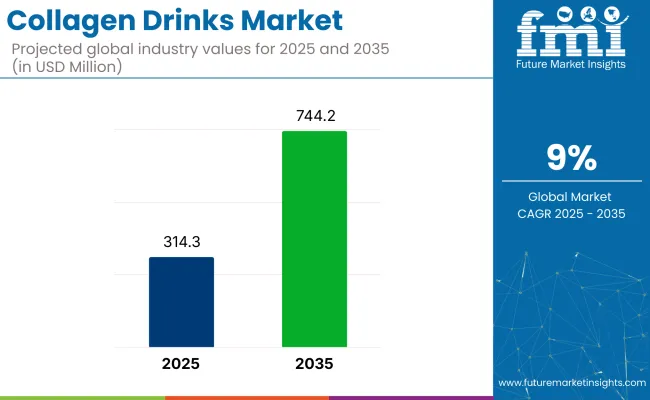
The global collagen drinks market is projected to grow from USD 314.3 million in 2025 to USD 744.2 million by 2035, registering a CAGR of 9%. Market expansion is driven by increasing health awareness and rising adoption among millennials and Gen Z, coupled with the popularity of anti-aging beverages. With the rising focus on skin health, joint support, and holistic wellness, collagen drinks are witnessing robust adoption.
Quick Stats Of Collagen Drinks Market

  • Market Value (2025): USD 314.3 million
  • Forecast Value (2035): USD 744.2 million
  • Forecast CAGR: 9%
  • Application Leader in 2025: Beauty and Personal Care (36.5% market share)
  • Top Source Segment: Animal Based Collagen Drinks (68% share)
  • Key Growth Region: North America (USA is the fastest-growing market with a 7.5% CAGR)

Collagen Drinks Market

Metric Value
Industry Size (2025E) USD 314.3 million
Industry Value (2035F) USD 744.2 million
CAGR (2025 to 2035) 9%

The market holds an approximately 0.2% share of the functional beverages market, reflecting its niche positioning within health drinks. Within the beauty and personal care segment, it commands approximately 0.055%, emphasizing its role in nutricosmetics and beauty-from-within segments. It contributes around 0.08% to the nutraceuticals market, highlighting its relevance in preventive health and dietary supplements. However, in the expansive global food and beverage industry, its share remains minimal at below 0.01%.

Government regulations impacting the market focus on regulatory agencies in the USA, Europe, and Japan to enforce strict guidelines on product labelling, health claims, and safety standards to ensure consumer protection. The European Food Safety Authority (EFSA) mandates approval of functional health claims associated with collagen drinks, ensuring transparency and scientific backing.

In the USA, the FDA monitors ingredient safety under dietary supplement regulations, requiring manufacturers to adhere to Good Manufacturing Practices (GMP). Japan’s FOSHU framework also ensures efficacy and safety of health beverages. These regulations foster market credibility, consumer confidence, and sustained industry growth.

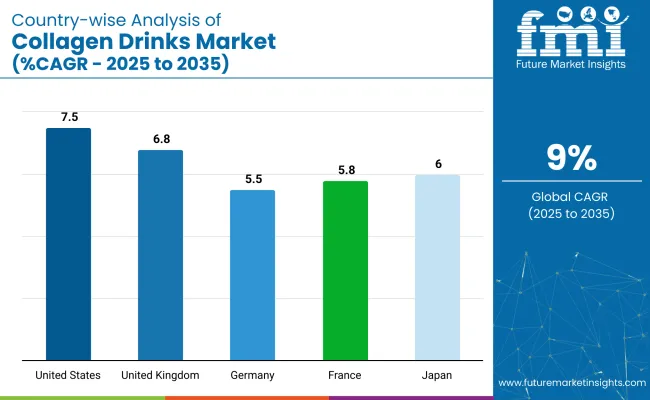
The USA is projected to be the fastest-growing market, expanding at a CAGR of 7.5% from 2025 to 2035. Pharmacy and drug stores will lead the sales channel segment with a 35.6% share, while animal-based collagen drinks will dominate the source segment with a 68% share. The Japanese and German markets are also expected to expand steadily at CAGRs of 6% and 5.5%, respectively.

Collagen Drinks Market Analysis by Top Investment Segments

The collagen drinks market is segmented by end user, application, source, sales channel, and region. By end user, the market is divided into millennials & Gen Z, elderly population, athletes & fitness enthusiasts, pregnant & postpartum women, health-conscious individuals, and others (working professionals, beauty influencers, recovering patients, and corporate wellness participants).

Based on application, the market is categorized into beauty & personal care, nutraceutical drinks, sports nutrition, weight management, clinical nutrition, and other applications (digestive health, bone strength, sleep support, and hair nourishment). By source, the market is bifurcated into plant-based collagen drinks and animal based collagen drinks.

Based on sales channel, the market is classified into modern trade, specialty stores, pharmacy & drug stores, online retail store, and other sales channels (direct-to-consumer platforms, wellness clinics, spas and salons, and vending machines). Regionally, the market is classified into North America, Latin America, Western Europe, Eastern Europe, Balkans & Baltic, Russia & Belarus, Central Asia, East Asia, South Asia & Pacific, and Middle East & Africa.

Millennials and Gen Z to Dominate End User Segment with Approximately 33.6% Market Share

Millennials and Gen Z are expected to lead the end user segment, capturing approximately 33.6% market share in 2025. Their preference for preventive health and beauty solutions shapes market demand.

  • Busy lifestyles drive demand for on-the-go functional drinks.
  • Social media trends influence purchasing decisions.

Beauty and Personal Care to Lead the Application Segment with Over 36.5% Market Share

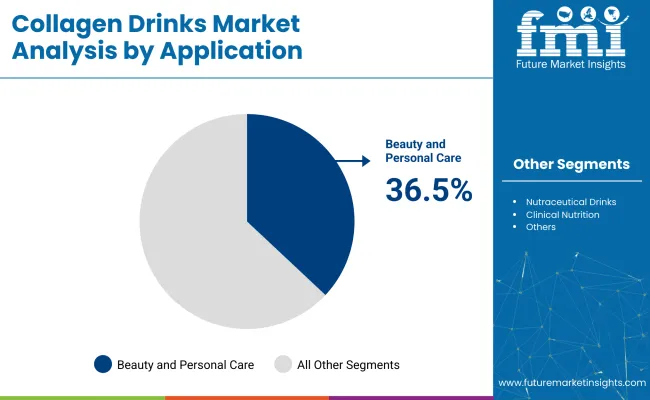
Beauty and personal care are projected to lead the application segment, accounting for over 36.5% of the global market share by 2025. Collagen drinks have been used to support skin hydration, elasticity, and appearance enhancement.
  • Demand is driven by beauty-from-within and anti-aging trends.
  • Drinks are formulated with added vitamins for holistic benefits.
  • Companies focus marketing on convenience and aesthetic results.

Collagen Drinks Market Analysis By Application

Animal Based Collagen Drinks to Lead Source Segment with Approximately 68% Market Share

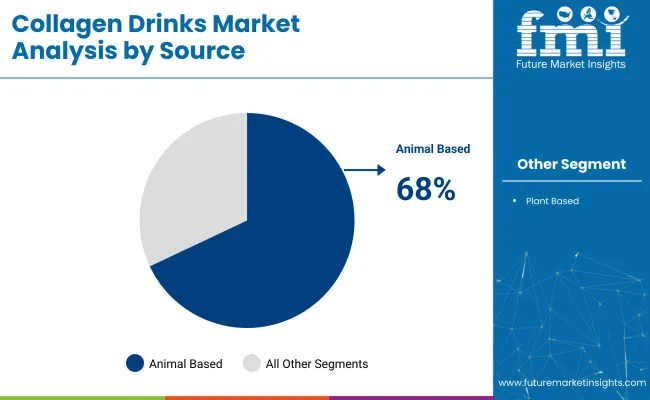
Animal based collagen drinks are projected to lead the source segment, accounting for approximately 68% of the global market share in 2025. These drinks are widely adopted due to their established efficacy in supporting skin, joint, and overall health.
  • Animal-based collagen is primarily derived from bovine and marine sources.
  • It offers high bioavailability, making it preferred for beauty and nutraceutical applications.

Collagen Drinks Market Analysis By Source

Pharmacy and Drug Stores to Lead Sales Channel with 35.6% Market Share

Pharmacy and drug stores are anticipated to lead the sales channel segment, holding 35.6% of the global market share in 2025. Their position as trusted outlets for health supplements drives this dominance.

  • Pharmacies offer convenience by stocking collagen drinks alongside essential health products.
  • Pharmacist recommendations support consumer purchasing decisions.

Top Collagen Drinks Market Dynamics

The collagen drinks market has been experiencing steady growth, driven by increasing consumer demand for beauty-enhancing beverages, joint health supplements, and preventive wellness solutions.

Recent Trends in the Collagen Drinks Market

  • Introduction of plant-based and vegan collagen drinks is expanding product offerings.
  • Development of ready-to-drink collagen beverages with improved flavor profiles is rising.
  • Growing popularity of collagen-infused functional beverages in Asian markets is observed.

Challenges in the Collagen Drinks Market
  • Limited consumer awareness regarding differences between animal-based and vegan collagen efficacy.
  • Fluctuating raw material prices for marine and bovine collagen are impacting production costs.
  • Stringent regulatory approvals for health claims and labelling are posing market entry barriers.

Top Countries Manufacturing, Distributing, Regulating, and Generating Demand for Collagen Drinks

Country Wise Analysis Of Collagen Drinks Market Cagr 2025 To 2035

Japan leads the collagen drinks market due to increasing use in beauty-focused functional beverages, marine collagen innovations, and cultural acceptance of daily beauty-from-within routines. Germany and France maintain consistent demand driven by nutricosmetics adoption, clean-label trends, and regulatory alignment with EU health and wellness standards. While, developed economies such as the USA (7.5% CAGR), UK (6.8%), and Japan (6%) are expanding at a steady 0.70-0.85x of the global growth rate.

Japan leads in high-purity marine collagen beverages integrated into daily routines for skin hydration and elasticity. Germany and France leverage strong pharmacy networks and beauty supplement markets, where collagen drinks are positioned for skin, hair, and joint health.

The USA market emphasizes nutraceutical-grade formulations distributed through pharmacies and online channels, while the UK focuses on clean-label plant-based alternatives catering to vegan consumers. As the market adds over USD 429.9 million globally by 2035, both beauty-led and health-focused regions will shape long-term demand.

The report covers in-depth analysis of 40+ countries; five top-performing OECD countries are highlighted below.

In-depth Analysis of Collagen Drinks Demand in Japan

The Japan collagen drinks revenue is growing at a CAGR of 6% from 2025 to 2035. Growth is driven by cultural integration of collagen beverages into daily diets, particularly marine-based formulations targeting skin hydration.

  • Strong demand for marine collagen beauty drinks
  • Preference for clean-label, additive-free formulations

Growth Outlook for Collagen Drinks in Germany

The sales of collagen drinks in Germany are expanding at an 5.5% CAGR during the forecast period. Growth is driven by high consumer acceptance of nutricosmetic products, with collagen drinks marketed for anti-aging and skin health benefits.

  • Strong demand for marine collagen drinks with clean-label claims
  • High consumer awareness of collagen’s skin and joint health benefits

Demand Trajectory for Industrial Beauty Beverage in France

The demand for collagen drinks in France is projected to grow at a 5.8% CAGR during the forecast period. Demand is driven by the rising popularity of nutricosmetics, workplace wellness programs, and national health initiatives supporting preventive nutrition.

  • High adoption in beauty-focused consumer segments
  • Growing demand for marine and plant-based collagen drinks

Collagen Drinks Market Analysis in the USA

The USA collagen drinks market is projected to grow at 7.5% CAGR from 2025 to 2035. The growth is driven by nutraceutical positioning of collagen drinks for joint support, skin health, and general wellness.

  • Strong pharmacy and online retail distribution
  • High awareness of collagen’s health benefits among consumers

Collagen Drinks Market Trends in the UK

The UK collagen drinks revenue is projected to grow at a CAGR of 6.8% from 2025 to 2035. Growth is supported by rising demand for beauty-from-within products, with a notable shift towards plant-based and vegan collagen drinks.

  • Increasing demand for vegan collagen drink alternatives
  • Market growth driven by beauty and clean-label trends

Leading Collagen Drinks Suppliers and Distributors

The collagen drinks market is moderately consolidated, with a combination of global leaders and regional firms actively shaping competition. Companies are prioritizing clean-label innovations, science-backed ingredients, and broader access through diverse retail formats including pharmacies, online platforms, and wellness stores. Distribution strategies increasingly focus on health-conscious demographics, leveraging digital marketing and evidence-based claims to build brand equity.

Tier-one players such as Shiseido Company Ltd., Vital Protein LLC, and AmorePacific Corporation are driving growth by developing premium formulations that support skin health, joint mobility, and general wellness. These firms maintain strong operational bases in Asia and North America, using influencer partnerships and category-specific branding to attract millennials and Gen Z.

Meanwhile, regional brands are advancing with plant-based and marine collagen products catering to niche dietary needs such as halal and vegan. Across the board, market leaders are emphasizing clinical efficacy, targeted messaging, and expansion into high-demand consumer segments.

Recent Collagen Drinks Industry News

  • In January 2025, GNC launched its Premier Collagen line targeting skin health, introducing two formulations, Premier Collagen and Advanced Shot. Both feature marine and bovine collagen peptides with vitamin C, designed for fast absorption and youthful skin support across multiple formats.
  • In March 2024, ISOPURE expanded its product line with the launch of Collagen Peptides, formulated to support joint, hair, skin, nail, and immune health. Each scoop delivers 20 grams of grass-fed, pasture-raised collagen in lemonade or unflavored options.

Collagen Drinks Market Report Scope

Report Attributes Details
Current Total Market Size (2025) USD 314.3 million
Projected Market Size (2035) USD 744.2 million
CAGR (2025 to 2035) 9%
Base Year for Estimation 2024
Historical Period 2020 to 2024
Projections Period 2025 to 2035
Market Analysis Parameters Revenue in USD million / Volume in liters
By Application Beauty and Personal Care, Nutraceutical Drinks, Sports Nutrition, Weight Management, Clinical Nutrition, and Others (Digestive Health, Bone Strength, Sleep Support, and Hair Nourishment)
By End User Millennials and Gen Z, Elderly Population, Athletes and Fitness Enthusiasts, Pregnant and Postpartum Women, Health-Conscious Individuals, and Others (Working Professionals, Beauty Influencers, Recovering Patients, and Corporate Wellness Participants)
By Source Plant Based Collagen Drinks and Animal Based Collagen Drinks
By Sales Channel Modern Trade, Specialty Stores, Pharmacy and Drug Stores, Online Retail Store, Other Sales Channels (Direct-T o-Consumer Platforms, Wellness Clinics, Spas a nd Salons, Vending Machines)
Regions Covered North America, Latin America, Western Europe, Eastern Europe, East Asia, South Asia Pacific, Middle East and Africa
Countries Covered United States, Canada, United Kingdom, Germany, France, China, Japan, South Korea, Brazil, Australia
Key Players Shiseido Company Ltd., Vital Protein LLC, AmorePacific Corporation, The Protein Drinks Co., Sappe Public Company Ltd., Asertism Healthcare, Hangzhou Nutrition Biotechnology Co. Ltd., Anveva Nutraceuticals Ltd., Kinohimitsu, Bottles Science Ltd., Bauer Nutrition, Lacka Foods Ltd., Revive Collagen, Heivy, The Collagen Company
Additional Attributes Dollar sales by equipment type, share by power, regional demand growth, policy influence, automation trends, competitive benchmarking

Key Segments of the Report

By End User:

As per end user, the industry has been categorized into Millennials and Gen Z, Elderly Population, Athletes and Fitness Enthusiasts, Pregnant & Postpartum Women, Health-Conscious Individuals and Others.

By Application:

As per Application, the industry has been categorized into Beauty and Personal Care, Nutraceutical Drinks, Sports Nutrition, Weight Management, Clinical Nutrition and Others Applications.

By Source:

This segment is further categorized into Plant Based Collagen Drinks and Animal Based Collagen Drinks.

By Sales Channel:

As per sales channel, the industry has been categorized into Modern Trade, Specialty Stores, Pharmacy and Drug Stores, Online Retail Store and Other Sales Channels.

By Region:

Industry analysis has been carried out in key countries of North America, Western Europe, Eastern Europe, Russia & Belarus, Balkan & Baltic Countries, Latin America, Central Asia, East Asia, Middle East & Africa and South Asia & Pacific.

Table of Content

  1. Executive Summary
    • Global Market Outlook
    • Demand-side Trends
    • Supply-side Trends
    • Technology Roadmap Analysis
    • Analysis and Recommendations
  2. Market Overview
    • Market Coverage / Taxonomy
    • Market Definition / Scope / Limitations
  3. Market Background
    • Market Dynamics
      • Drivers
      • Restraints
      • Opportunity
      • Trends
    • Scenario Forecast
      • Demand in Optimistic Scenario
      • Demand in Likely Scenario
      • Demand in Conservative Scenario
    • Opportunity Map Analysis
    • Product Life Cycle Analysis
    • Supply Chain Analysis
      • Supply Side Participants and their Roles
        • Producers
        • Mid-Level Participants (Traders/ Agents/ Brokers)
        • Wholesalers and Distributors
      • Value Added and Value Created at Node in the Supply Chain
      • List of Raw Material Suppliers
      • List of Existing and Potential Buyer’s
    • Investment Feasibility Matrix
    • Value Chain Analysis
      • Profit Margin Analysis
      • Wholesalers and Distributors
      • Retailers
    • PESTLE and Porter’s Analysis
    • Regulatory Landscape
      • By Key Regions
      • By Key Countries
    • Regional Parent Market Outlook
    • Production and Consumption Statistics
    • Import and Export Statistics
  4. Global Market Analysis 2020 to 2024 and Forecast, 2025 to 2035
    • Historical Market Size Value (USD Million) & Volume (Liters) Analysis, 2020 to 2024
    • Current and Future Market Size Value (USD Million) & Volume (Liters) Projections, 2025 to 2035
      • Y-o-Y Growth Trend Analysis
      • Absolute $ Opportunity Analysis
  5. Global Market Pricing Analysis 2020 to 2024 and Forecast 2025 to 2035
  6. Global Market Analysis 2020 to 2024 and Forecast 2025 to 2035, By End User
    • Introduction / Key Findings
    • Historical Market Size Value (USD Million) & Volume (Liters) Analysis By End User, 2020 to 2024
    • Current and Future Market Size Value (USD Million) & Volume (Liters) Analysis and Forecast By End User, 2025 to 2035
      • Millennials and Gen Z
      • Elderly Population
      • Athletes and Fitness Enthusiasts
      • Pregnant and Postpartum Women
      • Health-Conscious Individuals
      • Others (Students, Working Professionals, Homemakers, Children)
    • Y-o-Y Growth Trend Analysis By End User, 2020 to 2024
    • Absolute $ Opportunity Analysis By End User, 2025 to 2035
  7. Global Market Analysis 2020 to 2024 and Forecast 2025 to 2035, By Application
    • Introduction / Key Findings
    • Historical Market Size Value (USD Million) & Volume (Liters) Analysis By Application, 2020 to 2024
    • Current and Future Market Size Value (USD Million) & Volume (Liters) Analysis and Forecast By Application, 2025 to 2035
      • Beauty and Personal Care
      • Nutraceutical Drinks
      • Sports Nutrition
      • Weight Management
      • Clinical Nutrition
      • Others Applications (Joint Health, Bone Health, Digestive Health, Immune Support)
    • Y-o-Y Growth Trend Analysis By Application, 2020 to 2024
    • Absolute $ Opportunity Analysis By Application, 2025 to 2035
  8. Global Market Analysis 2020 to 2024 and Forecast 2025 to 2035, By Source
    • Introduction / Key Findings
    • Historical Market Size Value (USD Million) & Volume (Liters) Analysis By Source, 2020 to 2024
    • Current and Future Market Size Value (USD Million) & Volume (Liters) Analysis and Forecast By Source, 2025 to 2035
      • Plant Based Collagen Drinks
      • Animal Based Collagen Drinks
    • Y-o-Y Growth Trend Analysis By Source, 2020 to 2024
    • Absolute $ Opportunity Analysis By Source, 2025 to 2035
  9. Global Market Analysis 2020 to 2024 and Forecast 2025 to 2035, By Sales Channel
    • Introduction / Key Findings
    • Historical Market Size Value (USD Million) & Volume (Liters) Analysis By Sales Channel, 2020 to 2024
    • Current and Future Market Size Value (USD Million) & Volume (Liters) Analysis and Forecast By Sales Channel, 2025 to 2035
      • Modern Trade
      • Specialty Stores
      • Pharmacy and Drug Stores
      • Online Retail Store
      • Other Sales Channels (Direct Sales, Convenience Stores, Hypermarkets, Department Stores)
    • Y-o-Y Growth Trend Analysis By Sales Channel, 2020 to 2024
    • Absolute $ Opportunity Analysis By Sales Channel, 2025 to 2035
  10. Global Market Analysis 2020 to 2024 and Forecast 2025 to 2035, By Region
    • Introduction
    • Historical Market Size Value (USD Million) & Volume (Liters) Analysis By Region, 2020 to 2024
    • Current Market Size Value (USD Million) & Volume (Liters) Analysis and Forecast By Region, 2025 to 2035
      • North America
      • Latin America
      • Western Europe
      • Eastern Europe
      • East Asia
      • South Asia & Pacific
      • Middle East and Africa
    • Market Attractiveness Analysis By Region
  11. North America Market Analysis 2020 to 2024 and Forecast 2025 to 2035, By Country
    • Historical Market Size Value (USD Million) & Volume (Liters) Trend Analysis By Market Taxonomy, 2020 to 2024
    • Market Size Value (USD Million) & Volume (Liters) Forecast By Market Taxonomy, 2025 to 2035
      • By Country
        • USA
        • Canada
        • Mexico
      • By End User
      • By Application
      • By Source
      • By Sales Channel
    • Market Attractiveness Analysis
      • By Country
      • By End User
      • By Application
      • By Source
      • By Sales Channel
    • Key Takeaways
  12. Latin America Market Analysis 2020 to 2024 and Forecast 2025 to 2035, By Country
    • Historical Market Size Value (USD Million) & Volume (Liters) Trend Analysis By Market Taxonomy, 2020 to 2024
    • Market Size Value (USD Million) & Volume (Liters) Forecast By Market Taxonomy, 2025 to 2035
      • By Country
        • Brazil
        • Argentina
        • Rest of LATAM
      • By End User
      • By Application
      • By Source
      • By Sales Channel
    • Market Attractiveness Analysis
      • By Country
      • By End User
      • By Application
      • By Source
      • By Sales Channel
    • Key Takeaways
  13. Western Europe Market Analysis 2020 to 2024 and Forecast 2025 to 2035, By Country
    • Historical Market Size Value (USD Million) & Volume (Liters) Trend Analysis By Market Taxonomy, 2020 to 2024
    • Market Size Value (USD Million) & Volume (Liters) Forecast By Market Taxonomy, 2025 to 2035
      • By Country
        • Germany
        • Italy
        • France
        • UK
        • Spain
        • BENELUX
        • Nordic
        • Rest of W.Europe
      • By End User
      • By Application
      • By Source
      • By Sales Channel
    • Market Attractiveness Analysis
      • By Country
      • By End User
      • By Application
      • By Source
      • By Sales Channel
    • Key Takeaways
  14. Eastern Europe Market Analysis 2020 to 2024 and Forecast 2025 to 2035, By Country
    • Historical Market Size Value (USD Million) & Volume (Liters) Trend Analysis By Market Taxonomy, 2020 to 2024
    • Market Size Value (USD Million) & Volume (Liters) Forecast By Market Taxonomy, 2025 to 2035
      • By Country
        • Russia
        • Hungary
        • Poland
        • Balkan & Baltics
        • Rest of E. Europe
      • By End User
      • By Application
      • By Source
      • By Sales Channel
    • Market Attractiveness Analysis
      • By Country
      • By End User
      • By Application
      • By Source
      • By Sales Channel
    • Key Takeaways
  15. East Asia Market Analysis 2020 to 2024 and Forecast 2025 to 2035, By Country
    • Historical Market Size Value (USD Million) & Volume (Liters) Trend Analysis By Market Taxonomy, 2020 to 2024
    • Market Size Value (USD Million) & Volume (Liters) Forecast By Market Taxonomy, 2025 to 2035
      • By Country
        • China
        • Japan
        • South Korea
      • By End User
      • By Application
      • By Source
      • By Sales Channel
    • Market Attractiveness Analysis
      • By Country
      • By End User
      • By Application
      • By Source
      • By Sales Channel
    • Key Takeaways
  16. South Asia & Pacific Market Analysis 2020 to 2024 and Forecast 2025 to 2035, By Country
    • Historical Market Size Value (USD Million) & Volume (Liters) Trend Analysis By Market Taxonomy, 2020 to 2024
    • Market Size Value (USD Million) & Volume (Liters) Forecast By Market Taxonomy, 2025 to 2035
      • By Country
        • India
        • Australia & New Zealand
        • ASEAN
        • Rest of SAP
      • By End User
      • By Application
      • By Source
      • By Sales Channel
    • Market Attractiveness Analysis
      • By Country
      • By End User
      • By Application
      • By Source
      • By Sales Channel
    • Key Takeaways
  17. Middle East and Africa Market Analysis 2020 to 2024 and Forecast 2025 to 2035, By Country
    • Historical Market Size Value (USD Million) & Volume (Liters) Trend Analysis By Market Taxonomy, 2020 to 2024
    • Market Size Value (USD Million) & Volume (Liters) Forecast By Market Taxonomy, 2025 to 2035
      • By Country
        • GCC Countries
        • Northern Africa
        • South Africa
        • Turkiye
        • Rest of MEA
      • By End User
      • By Application
      • By Source
      • By Sales Channel
    • Market Attractiveness Analysis
      • By Country
      • By End User
      • By Application
      • By Source
      • By Sales Channel
    • Key Takeaways
  18. Key Countries Market Analysis
    • USA
      • Pricing Analysis
      • Market Share Analysis, 2024
        • By End User
        • By Application
        • By Source
        • By Sales Channel
    • Canada
      • Pricing Analysis
      • Market Share Analysis, 2024
        • By End User
        • By Application
        • By Source
        • By Sales Channel
    • Brazil
      • Pricing Analysis
      • Market Share Analysis, 2024
        • By End User
        • By Application
        • By Source
        • By Sales Channel
    • Mexico
      • Pricing Analysis
      • Market Share Analysis, 2024
        • By End User
        • By Application
        • By Source
        • By Sales Channel
    • Argentina
      • Pricing Analysis
      • Market Share Analysis, 2024
        • By End User
        • By Application
        • By Source
        • By Sales Channel
  19. Market Structure Analysis
    • Competition Dashboard
    • Competition Benchmarking
    • Market Share Analysis of Top Players
      • By Regional
      • By End User
      • By Application
      • By Source
      • By Sales Channel
  20. Competition Analysis
    • Competition Deep Dive
      • Shiseido Company Ltd.
        • Overview
        • Product Portfolio
        • Profitability by Market Segments (Product/Age /Sales Channel/Region)
        • Sales Footprint
        • Strategy Overview
          • Marketing Strategy
          • Product Strategy
          • Channel Strategy
      • Vital Protein LLC
        • Overview
        • Product Portfolio
        • Profitability by Market Segments (Product/Age /Sales Channel/Region)
        • Sales Footprint
        • Strategy Overview
          • Marketing Strategy
          • Product Strategy
          • Channel Strategy
      • AmorePacific Corporation
        • Overview
        • Product Portfolio
        • Profitability by Market Segments (Product/Age /Sales Channel/Region)
        • Sales Footprint
        • Strategy Overview
          • Marketing Strategy
          • Product Strategy
          • Channel Strategy
      • The Protein Drinks Co.
        • Overview
        • Product Portfolio
        • Profitability by Market Segments (Product/Age /Sales Channel/Region)
        • Sales Footprint
        • Strategy Overview
          • Marketing Strategy
          • Product Strategy
          • Channel Strategy
      • Sappe Public Company Ltd.
        • Overview
        • Product Portfolio
        • Profitability by Market Segments (Product/Age /Sales Channel/Region)
        • Sales Footprint
        • Strategy Overview
          • Marketing Strategy
          • Product Strategy
          • Channel Strategy
      • Asertism Healthcare
        • Overview
        • Product Portfolio
        • Profitability by Market Segments (Product/Age /Sales Channel/Region)
        • Sales Footprint
        • Strategy Overview
          • Marketing Strategy
          • Product Strategy
          • Channel Strategy
      • Hangzhou Nutrition Biotechnology Co. Ltd.
        • Overview
        • Product Portfolio
        • Profitability by Market Segments (Product/Age /Sales Channel/Region)
        • Sales Footprint
        • Strategy Overview
          • Marketing Strategy
          • Product Strategy
          • Channel Strategy
      • Anveva Nutraceuticals Ltd.
        • Overview
        • Product Portfolio
        • Profitability by Market Segments (Product/Age /Sales Channel/Region)
        • Sales Footprint
        • Strategy Overview
          • Marketing Strategy
          • Product Strategy
          • Channel Strategy
      • Kinohimitsu
        • Overview
        • Product Portfolio
        • Profitability by Market Segments (Product/Age /Sales Channel/Region)
        • Sales Footprint
        • Strategy Overview
          • Marketing Strategy
          • Product Strategy
          • Channel Strategy
      • Bottles Science Ltd.
        • Overview
        • Product Portfolio
        • Profitability by Market Segments (Product/Age /Sales Channel/Region)
        • Sales Footprint
        • Strategy Overview
          • Marketing Strategy
          • Product Strategy
          • Channel Strategy
      • Bauer Nutrition
        • Overview
        • Product Portfolio
        • Profitability by Market Segments (Product/Age /Sales Channel/Region)
        • Sales Footprint
        • Strategy Overview
          • Marketing Strategy
          • Product Strategy
          • Channel Strategy
      • Lacka Foods Ltd.
        • Overview
        • Product Portfolio
        • Profitability by Market Segments (Product/Age /Sales Channel/Region)
        • Sales Footprint
        • Strategy Overview
          • Marketing Strategy
          • Product Strategy
          • Channel Strategy
      • Revive Collagen
        • Overview
        • Product Portfolio
        • Profitability by Market Segments (Product/Age /Sales Channel/Region)
        • Sales Footprint
        • Strategy Overview
          • Marketing Strategy
          • Product Strategy
          • Channel Strategy
      • Heivy
        • Overview
        • Product Portfolio
        • Profitability by Market Segments (Product/Age /Sales Channel/Region)
        • Sales Footprint
        • Strategy Overview
          • Marketing Strategy
          • Product Strategy
          • Channel Strategy
      • The Collagen Company
        • Overview
        • Product Portfolio
        • Profitability by Market Segments (Product/Age /Sales Channel/Region)
        • Sales Footprint
        • Strategy Overview
          • Marketing Strategy
          • Product Strategy
          • Channel Strategy
  21. Assumptions & Acronyms Used
  22. Research Methodology

List of Tables

  • Table 1: Global Market Value (USD Million) Forecast by Region, 2020 to 2035
  • Table 2: Global Market Volume (Liters) Forecast by Region, 2020 to 2035
  • Table 3: Global Market Value (USD Million) Forecast by End User, 2020 to 2035
  • Table 4: Global Market Volume (Liters) Forecast by End User, 2020 to 2035
  • Table 5: Global Market Value (USD Million) Forecast by Application, 2020 to 2035
  • Table 6: Global Market Volume (Liters) Forecast by Application, 2020 to 2035
  • Table 7: Global Market Value (USD Million) Forecast by Source, 2020 to 2035
  • Table 8: Global Market Volume (Liters) Forecast by Source, 2020 to 2035
  • Table 9: Global Market Value (USD Million) Forecast by Sales Channel, 2020 to 2035
  • Table 10: Global Market Volume (Liters) Forecast by Sales Channel, 2020 to 2035
  • Table 11: North America Market Value (USD Million) Forecast by Country, 2020 to 2035
  • Table 12: North America Market Volume (Liters) Forecast by Country, 2020 to 2035
  • Table 13: North America Market Value (USD Million) Forecast by End User, 2020 to 2035
  • Table 14: North America Market Volume (Liters) Forecast by End User, 2020 to 2035
  • Table 15: North America Market Value (USD Million) Forecast by Application, 2020 to 2035
  • Table 16: North America Market Volume (Liters) Forecast by Application, 2020 to 2035
  • Table 17: North America Market Value (USD Million) Forecast by Source, 2020 to 2035
  • Table 18: North America Market Volume (Liters) Forecast by Source, 2020 to 2035
  • Table 19: North America Market Value (USD Million) Forecast by Sales Channel, 2020 to 2035
  • Table 20: North America Market Volume (Liters) Forecast by Sales Channel, 2020 to 2035
  • Table 21: Latin America Market Value (USD Million) Forecast by Country, 2020 to 2035
  • Table 22: Latin America Market Volume (Liters) Forecast by Country, 2020 to 2035
  • Table 23: Latin America Market Value (USD Million) Forecast by End User, 2020 to 2035
  • Table 24: Latin America Market Volume (Liters) Forecast by End User, 2020 to 2035
  • Table 25: Latin America Market Value (USD Million) Forecast by Application, 2020 to 2035
  • Table 26: Latin America Market Volume (Liters) Forecast by Application, 2020 to 2035
  • Table 27: Latin America Market Value (USD Million) Forecast by Source, 2020 to 2035
  • Table 28: Latin America Market Volume (Liters) Forecast by Source, 2020 to 2035
  • Table 29: Latin America Market Value (USD Million) Forecast by Sales Channel, 2020 to 2035
  • Table 30: Latin America Market Volume (Liters) Forecast by Sales Channel, 2020 to 2035
  • Table 31: Western Europe Market Value (USD Million) Forecast by Country, 2020 to 2035
  • Table 32: Western Europe Market Volume (Liters) Forecast by Country, 2020 to 2035
  • Table 33: Western Europe Market Value (USD Million) Forecast by End User, 2020 to 2035
  • Table 34: Western Europe Market Volume (Liters) Forecast by End User, 2020 to 2035
  • Table 35: Western Europe Market Value (USD Million) Forecast by Application, 2020 to 2035
  • Table 36: Western Europe Market Volume (Liters) Forecast by Application, 2020 to 2035
  • Table 37: Western Europe Market Value (USD Million) Forecast by Source, 2020 to 2035
  • Table 38: Western Europe Market Volume (Liters) Forecast by Source, 2020 to 2035
  • Table 39: Western Europe Market Value (USD Million) Forecast by Sales Channel, 2020 to 2035
  • Table 40: Western Europe Market Volume (Liters) Forecast by Sales Channel, 2020 to 2035
  • Table 41: Eastern Europe Market Value (USD Million) Forecast by Country, 2020 to 2035
  • Table 42: Eastern Europe Market Volume (Liters) Forecast by Country, 2020 to 2035
  • Table 43: Eastern Europe Market Value (USD Million) Forecast by End User, 2020 to 2035
  • Table 44: Eastern Europe Market Volume (Liters) Forecast by End User, 2020 to 2035
  • Table 45: Eastern Europe Market Value (USD Million) Forecast by Application, 2020 to 2035
  • Table 46: Eastern Europe Market Volume (Liters) Forecast by Application, 2020 to 2035
  • Table 47: Eastern Europe Market Value (USD Million) Forecast by Source, 2020 to 2035
  • Table 48: Eastern Europe Market Volume (Liters) Forecast by Source, 2020 to 2035
  • Table 49: Eastern Europe Market Value (USD Million) Forecast by Sales Channel, 2020 to 2035
  • Table 50: Eastern Europe Market Volume (Liters) Forecast by Sales Channel, 2020 to 2035
  • Table 51: East Asia Market Value (USD Million) Forecast by Country, 2020 to 2035
  • Table 52: East Asia Market Volume (Liters) Forecast by Country, 2020 to 2035
  • Table 53: East Asia Market Value (USD Million) Forecast by End User, 2020 to 2035
  • Table 54: East Asia Market Volume (Liters) Forecast by End User, 2020 to 2035
  • Table 55: East Asia Market Value (USD Million) Forecast by Application, 2020 to 2035
  • Table 56: East Asia Market Volume (Liters) Forecast by Application, 2020 to 2035
  • Table 57: East Asia Market Value (USD Million) Forecast by Source, 2020 to 2035
  • Table 58: East Asia Market Volume (Liters) Forecast by Source, 2020 to 2035
  • Table 59: East Asia Market Value (USD Million) Forecast by Sales Channel, 2020 to 2035
  • Table 60: East Asia Market Volume (Liters) Forecast by Sales Channel, 2020 to 2035
  • Table 61: South Asia & Pacific Market Value (USD Million) Forecast by Country, 2020 to 2035
  • Table 62: South Asia & Pacific Market Volume (Liters) Forecast by Country, 2020 to 2035
  • Table 63: South Asia & Pacific Market Value (USD Million) Forecast by End User, 2020 to 2035
  • Table 64: South Asia & Pacific Market Volume (Liters) Forecast by End User, 2020 to 2035
  • Table 65: South Asia & Pacific Market Value (USD Million) Forecast by Application, 2020 to 2035
  • Table 66: South Asia & Pacific Market Volume (Liters) Forecast by Application, 2020 to 2035
  • Table 67: South Asia & Pacific Market Value (USD Million) Forecast by Source, 2020 to 2035
  • Table 68: South Asia & Pacific Market Volume (Liters) Forecast by Source, 2020 to 2035
  • Table 69: South Asia & Pacific Market Value (USD Million) Forecast by Sales Channel, 2020 to 2035
  • Table 70: South Asia & Pacific Market Volume (Liters) Forecast by Sales Channel, 2020 to 2035
  • Table 71: Middle East and Africa Market Value (USD Million) Forecast by Country, 2020 to 2035
  • Table 72: Middle East and Africa Market Volume (Liters) Forecast by Country, 2020 to 2035
  • Table 73: Middle East and Africa Market Value (USD Million) Forecast by End User, 2020 to 2035
  • Table 74: Middle East and Africa Market Volume (Liters) Forecast by End User, 2020 to 2035
  • Table 75: Middle East and Africa Market Value (USD Million) Forecast by Application, 2020 to 2035
  • Table 76: Middle East and Africa Market Volume (Liters) Forecast by Application, 2020 to 2035
  • Table 77: Middle East and Africa Market Value (USD Million) Forecast by Source, 2020 to 2035
  • Table 78: Middle East and Africa Market Volume (Liters) Forecast by Source, 2020 to 2035
  • Table 79: Middle East and Africa Market Value (USD Million) Forecast by Sales Channel, 2020 to 2035
  • Table 80: Middle East and Africa Market Volume (Liters) Forecast by Sales Channel, 2020 to 2035

List of Figures

  • Figure 1: Global Market Volume (Liters) Forecast 2020 to 2035
  • Figure 2: Global Market Pricing Analysis
  • Figure 3: Global Market Value (USD Million) Forecast 2020 to 2035
  • Figure 4: Global Market Value Share and BPS Analysis by End User, 2025 and 2035
  • Figure 5: Global Market Y-o-Y Growth Comparison by End User, 2025 to 2035
  • Figure 6: Global Market Attractiveness Analysis by End User
  • Figure 7: Global Market Value Share and BPS Analysis by Application, 2025 and 2035
  • Figure 8: Global Market Y-o-Y Growth Comparison by Application, 2025 to 2035
  • Figure 9: Global Market Attractiveness Analysis by Application
  • Figure 10: Global Market Value Share and BPS Analysis by Source, 2025 and 2035
  • Figure 11: Global Market Y-o-Y Growth Comparison by Source, 2025 to 2035
  • Figure 12: Global Market Attractiveness Analysis by Source
  • Figure 13: Global Market Value Share and BPS Analysis by Sales Channel, 2025 and 2035
  • Figure 14: Global Market Y-o-Y Growth Comparison by Sales Channel, 2025 to 2035
  • Figure 15: Global Market Attractiveness Analysis by Sales Channel
  • Figure 16: Global Market Value (USD Million) Share and BPS Analysis by Region, 2025 and 2035
  • Figure 17: Global Market Y-o-Y Growth Comparison by Region, 2025 to 2035
  • Figure 18: Global Market Attractiveness Analysis by Region
  • Figure 19: North America Market Incremental $ Opportunity, 2025 to 2035
  • Figure 20: Latin America Market Incremental $ Opportunity, 2025 to 2035
  • Figure 21: Western Europe Market Incremental $ Opportunity, 2025 to 2035
  • Figure 22: Eastern Europe Market Incremental $ Opportunity, 2025 to 2035
  • Figure 23: East Asia Market Incremental $ Opportunity, 2025 to 2035
  • Figure 24: South Asia & Pacific Market Incremental $ Opportunity, 2025 to 2035
  • Figure 25: Middle East and Africa Market Incremental $ Opportunity, 2025 to 2035
  • Figure 26: North America Market Value Share and BPS Analysis by Country, 2025 and 2035
  • Figure 27: North America Market Value Share and BPS Analysis by End User, 2025 and 2035
  • Figure 28: North America Market Y-o-Y Growth Comparison by End User, 2025 to 2035
  • Figure 29: North America Market Attractiveness Analysis by End User
  • Figure 30: North America Market Value Share and BPS Analysis by Application, 2025 and 2035
  • Figure 31: North America Market Y-o-Y Growth Comparison by Application, 2025 to 2035
  • Figure 32: North America Market Attractiveness Analysis by Application
  • Figure 33: North America Market Value Share and BPS Analysis by Source, 2025 and 2035
  • Figure 34: North America Market Y-o-Y Growth Comparison by Source, 2025 to 2035
  • Figure 35: North America Market Attractiveness Analysis by Source
  • Figure 36: North America Market Value Share and BPS Analysis by Sales Channel, 2025 and 2035
  • Figure 37: North America Market Y-o-Y Growth Comparison by Sales Channel, 2025 to 2035
  • Figure 38: North America Market Attractiveness Analysis by Sales Channel
  • Figure 39: Latin America Market Value Share and BPS Analysis by Country, 2025 and 2035
  • Figure 40: Latin America Market Value Share and BPS Analysis by End User, 2025 and 2035
  • Figure 41: Latin America Market Y-o-Y Growth Comparison by End User, 2025 to 2035
  • Figure 42: Latin America Market Attractiveness Analysis by End User
  • Figure 43: Latin America Market Value Share and BPS Analysis by Application, 2025 and 2035
  • Figure 44: Latin America Market Y-o-Y Growth Comparison by Application, 2025 to 2035
  • Figure 45: Latin America Market Attractiveness Analysis by Application
  • Figure 46: Latin America Market Value Share and BPS Analysis by Source, 2025 and 2035
  • Figure 47: Latin America Market Y-o-Y Growth Comparison by Source, 2025 to 2035
  • Figure 48: Latin America Market Attractiveness Analysis by Source
  • Figure 49: Latin America Market Value Share and BPS Analysis by Sales Channel, 2025 and 2035
  • Figure 50: Latin America Market Y-o-Y Growth Comparison by Sales Channel, 2025 to 2035
  • Figure 51: Latin America Market Attractiveness Analysis by Sales Channel
  • Figure 52: Western Europe Market Value Share and BPS Analysis by Country, 2025 and 2035
  • Figure 53: Western Europe Market Value Share and BPS Analysis by End User, 2025 and 2035
  • Figure 54: Western Europe Market Y-o-Y Growth Comparison by End User, 2025 to 2035
  • Figure 55: Western Europe Market Attractiveness Analysis by End User
  • Figure 56: Western Europe Market Value Share and BPS Analysis by Application, 2025 and 2035
  • Figure 57: Western Europe Market Y-o-Y Growth Comparison by Application, 2025 to 2035
  • Figure 58: Western Europe Market Attractiveness Analysis by Application
  • Figure 59: Western Europe Market Value Share and BPS Analysis by Source, 2025 and 2035
  • Figure 60: Western Europe Market Y-o-Y Growth Comparison by Source, 2025 to 2035
  • Figure 61: Western Europe Market Attractiveness Analysis by Source
  • Figure 62: Western Europe Market Value Share and BPS Analysis by Sales Channel, 2025 and 2035
  • Figure 63: Western Europe Market Y-o-Y Growth Comparison by Sales Channel, 2025 to 2035
  • Figure 64: Western Europe Market Attractiveness Analysis by Sales Channel
  • Figure 65: Eastern Europe Market Value Share and BPS Analysis by Country, 2025 and 2035
  • Figure 66: Eastern Europe Market Value Share and BPS Analysis by End User, 2025 and 2035
  • Figure 67: Eastern Europe Market Y-o-Y Growth Comparison by End User, 2025 to 2035
  • Figure 68: Eastern Europe Market Attractiveness Analysis by End User
  • Figure 69: Eastern Europe Market Value Share and BPS Analysis by Application, 2025 and 2035
  • Figure 70: Eastern Europe Market Y-o-Y Growth Comparison by Application, 2025 to 2035
  • Figure 71: Eastern Europe Market Attractiveness Analysis by Application
  • Figure 72: Eastern Europe Market Value Share and BPS Analysis by Source, 2025 and 2035
  • Figure 73: Eastern Europe Market Y-o-Y Growth Comparison by Source, 2025 to 2035
  • Figure 74: Eastern Europe Market Attractiveness Analysis by Source
  • Figure 75: Eastern Europe Market Value Share and BPS Analysis by Sales Channel, 2025 and 2035
  • Figure 76: Eastern Europe Market Y-o-Y Growth Comparison by Sales Channel, 2025 to 2035
  • Figure 77: Eastern Europe Market Attractiveness Analysis by Sales Channel
  • Figure 78: East Asia Market Value Share and BPS Analysis by Country, 2025 and 2035
  • Figure 79: East Asia Market Value Share and BPS Analysis by End User, 2025 and 2035
  • Figure 80: East Asia Market Y-o-Y Growth Comparison by End User, 2025 to 2035
  • Figure 81: East Asia Market Attractiveness Analysis by End User
  • Figure 82: East Asia Market Value Share and BPS Analysis by Application, 2025 and 2035
  • Figure 83: East Asia Market Y-o-Y Growth Comparison by Application, 2025 to 2035
  • Figure 84: East Asia Market Attractiveness Analysis by Application
  • Figure 85: East Asia Market Value Share and BPS Analysis by Source, 2025 and 2035
  • Figure 86: East Asia Market Y-o-Y Growth Comparison by Source, 2025 to 2035
  • Figure 87: East Asia Market Attractiveness Analysis by Source
  • Figure 88: East Asia Market Value Share and BPS Analysis by Sales Channel, 2025 and 2035
  • Figure 89: East Asia Market Y-o-Y Growth Comparison by Sales Channel, 2025 to 2035
  • Figure 90: East Asia Market Attractiveness Analysis by Sales Channel
  • Figure 91: South Asia & Pacific Market Value Share and BPS Analysis by Country, 2025 and 2035
  • Figure 92: South Asia & Pacific Market Value Share and BPS Analysis by End User, 2025 and 2035
  • Figure 93: South Asia & Pacific Market Y-o-Y Growth Comparison by End User, 2025 to 2035
  • Figure 94: South Asia & Pacific Market Attractiveness Analysis by End User
  • Figure 95: South Asia & Pacific Market Value Share and BPS Analysis by Application, 2025 and 2035
  • Figure 96: South Asia & Pacific Market Y-o-Y Growth Comparison by Application, 2025 to 2035
  • Figure 97: South Asia & Pacific Market Attractiveness Analysis by Application
  • Figure 98: South Asia & Pacific Market Value Share and BPS Analysis by Source, 2025 and 2035
  • Figure 99: South Asia & Pacific Market Y-o-Y Growth Comparison by Source, 2025 to 2035
  • Figure 100: South Asia & Pacific Market Attractiveness Analysis by Source
  • Figure 101: South Asia & Pacific Market Value Share and BPS Analysis by Sales Channel, 2025 and 2035
  • Figure 102: South Asia & Pacific Market Y-o-Y Growth Comparison by Sales Channel, 2025 to 2035
  • Figure 103: South Asia & Pacific Market Attractiveness Analysis by Sales Channel
  • Figure 104: Middle East and Africa Market Value Share and BPS Analysis by Country, 2025 and 2035
  • Figure 105: Middle East and Africa Market Value Share and BPS Analysis by End User, 2025 and 2035
  • Figure 106: Middle East and Africa Market Y-o-Y Growth Comparison by End User, 2025 to 2035
  • Figure 107: Middle East and Africa Market Attractiveness Analysis by End User
  • Figure 108: Middle East and Africa Market Value Share and BPS Analysis by Application, 2025 and 2035
  • Figure 109: Middle East and Africa Market Y-o-Y Growth Comparison by Application, 2025 to 2035
  • Figure 110: Middle East and Africa Market Attractiveness Analysis by Application
  • Figure 111: Middle East and Africa Market Value Share and BPS Analysis by Source, 2025 and 2035
  • Figure 112: Middle East and Africa Market Y-o-Y Growth Comparison by Source, 2025 to 2035
  • Figure 113: Middle East and Africa Market Attractiveness Analysis by Source
  • Figure 114: Middle East and Africa Market Value Share and BPS Analysis by Sales Channel, 2025 and 2035
  • Figure 115: Middle East and Africa Market Y-o-Y Growth Comparison by Sales Channel, 2025 to 2035
  • Figure 116: Middle East and Africa Market Attractiveness Analysis by Sales Channel
  • Figure 117: Global Market - Tier Structure Analysis
  • Figure 118: Global Market - Company Share Analysis

Frequently Asked Questions

What is the projected size of the collagen drinks market by 2035?

The market is expected to reach USD 744.2 million by 2035.

What is the outlook for the collagen drinks market from 2025 to 2035?

The market is projected to expand at a CAGR of 9% during this period.

Which application holds the highest share in the collagen drinks market in 2025?

Beauty and personal care is expected to lead with a 36.5% market share in 2025.

What is the top source segment in collagen drinks market by 2025?

Animal based collagen drinks are expected to hold approximately 68% of the market share in 2025.

Which country is projected to grow fastest in the collagen drinks market?

The USA is anticipated to be the fastest-growing market, with a CAGR of 7.5% from 2025 to 2035.

Explore Similar Insights

Future Market Insights

Collagen Drinks Market