Reports

- Global Locations -

Headquarters

Future Market Insights, Inc.

Christiana Corporate, 200
Continental Drive, Suite 401,
Newark, Delaware - 19713,
United States

T: +1-845-579-5705

Americas

Future Market Insights, Inc.

616 Corporate Way, Suite 2-9018,
Valley Cottage, NY 10989, United States

T: +1-347-918-3531

MEA

Future Market Insights

1602-6 Jumeirah Bay X2 Tower, Plot No: JLT-PH2-X2A,
Jumeirah Lakes Towers, Dubai,
United Arab Emirates

Europe

Future Market Insights

3rd Floor, 207 Regent Street,
W1B 3HH London
United Kingdom

T: + 44 (0) 20 8123 9659
D: +44 (0) 20 3287 4268

Asia Pacific

Future Market Insights

IndiaLand Global Tech Park, Unit UG-1, Behind Grand HighStreet, Phase 1, Hinjawadi, MH, Pune – 411057, India

Atelocollagen Market Outlook (2022 to 2032)

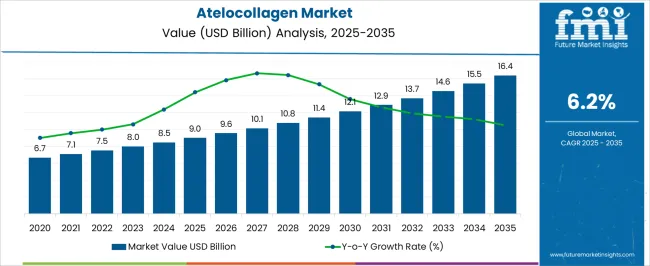
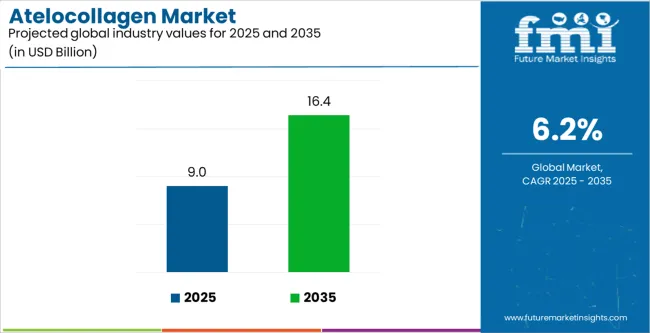
The atelocollagen market is projected to register a CAGR of 5.5% during the forecast period, up from US$ 7.8 Billion in 2021 to reach a valuation of US$ 14 Billion by 2032.

The atelocollagen market is anticipated to show promising growth prospects during the forecast period as a result of growing competition. New competitors are offering a variety of options at reasonable pricing to fulfill the demand for atelocollagen, making it more accessible to customers in the global atelocollagen market.

The business models, major strategies, and respective market shares of some of the most notable companies in this sector are all examined in depth in demand for the atelocollagen market report. This report is one of the most comprehensive documents available, capturing all aspects of the rapidly growing sales of the atelocollagen market.

Report Attribute Details
Estimated Base Year Value (2021) US$ 7.8 Billion
Expected Market Value (2022) US$ 8.3 Billion
Anticipated Forecast Value (2032) US$ 14 Billion
Projected Growth Rate (2022 to 2032) 5.5% CAGR

Sales of atelocollagen are expected to rise significantly. In addition to this, sales of atelocollagen are rising on account of US$ 10.2 Billion by 2026. Increasing sales of atelocollagen is also projected to contribute to the growth of the atelocollagen market share.

Collagen, a common protein found in the live human or animal body, plays an important function in the formation of the body's physical structure. Solubilization is used to extract collagen, and the resulting protein is known as atelocollagen.

Atelocollagen is used in a variety of sectors, including clinical medicine, tissue culture research, and cosmetics. It has another amazing feature, in addition to its vast range of applications. It's very soluble and can be re-engineered into a variety of forms. It has a high purity level, and its great plasticity makes it ideal for cosmetics and medicinal applications.

Atelocollagen is a protein that is created by the solubilization of collagen, which is typically acquired from cow skin or shark fin. Telocollagen is also thought to have anti-aging properties, making it more popular in the beauty business. Anti-aging serums, face masks, facial lotions/creams, eye creams, sunscreens, and lip balms are all products that include atelocollagen.

The following agents are included in cosmetic components that contain huge opportunities in demand for atelocollagen, and these substances help to drive the sales of atelocollagen in cosmetic goods.

Anti-wrinkle agents, antioxidants, lightening & whitening agents, mending agents, moisturizing agents, soothing agents, and sunscreen agents are examples of these agents. These characteristics make the demand for atelocollagen a popular, useful protein in the cosmetic and pharmaceutical industries, and it is now found in the majority of cosmetic goods.

Manufacturers in the atelocollagen market get a big platform from which to serve the whole demand for atelocollagen. The worldwide sales of atelocollagen are seeing increased competition. With growing competition, new competitors are offering a variety of options at reasonable pricing, fulfilling the demand for Atelocollagen to be more accessible to customers.

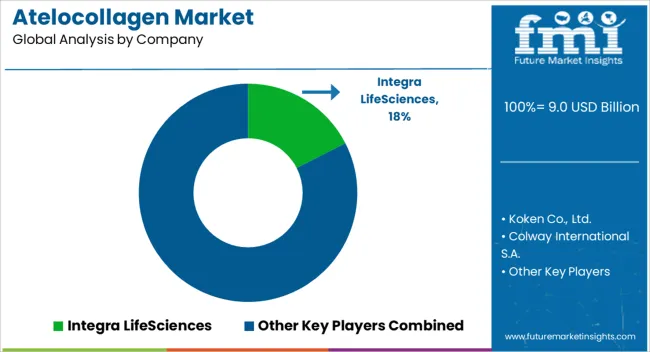
Koken Co., Ltd, Colway International S.A., Integra LifeSciences, Innocoll GmbH, Sewon Cellontech Co., Ltd., Shengchi, Taike Bio, Collagen Solutions, Collagen Matrix, Symatese, Shuangmei, Maverick Biosciences, REPROCELL USA Inc., Stryker, interim, Encoll, and DSM, among others, are some of the major players in the sales of atelocollagen market.

Don't pay for what you don't need

Customize your report by selecting specific countries or regions and save 30%!

What are the Key Growth Propellers to the Atelocollagen Market Share

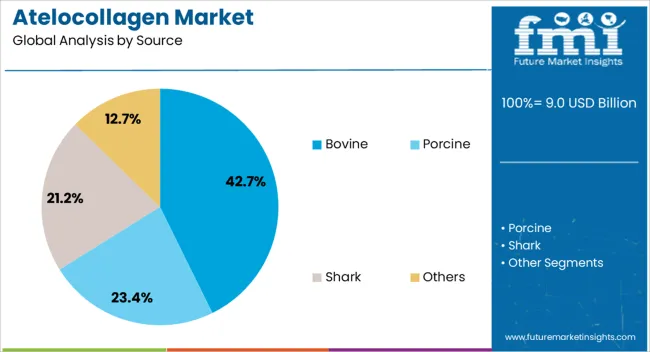
Owing to its moisturizing properties, demand for atelocollagen is rapidly increasing due to its utilization in natural skincare products. Sources often find three varieties of atelocollagen: bovine, porcine, and shark. Apart from these three, a kind of atelocollagen known as tilapia exists.

This atelocollagen has a moisturizing effect and is utilized in cosmetics such as skin lotions, creams, and beauty essences. Manufacturers increasingly include sales of atelocollagen in their products due to its numerous skin-related advantages. Aside from its skincare properties, it's also noted for its great purity and suppleness, making it an ideal cosmetic protein.

Because atelocollagen is biodegradable, it may be used in cosmetics, medical equipment, and medication with ease. Because of its great flexibility, it may be reengineered into a variety of forms, including powder, gel, films, sponge-like structures, and so on. As a result, it may be employed in a variety of sectors and in various forms.

These traits and attributes indicate the advantages of including atelocollagen in various goods, and as a result, the sector has seen tremendous growth in recent years. Atelocollagen is also employed in tissue regeneration, which increases the demand for atelocollagen protein all around the world. Cell tissue engineering in cosmetics and other applications is a hot topic among industry participants throughout the world.

Sales of atelocollagen and manufacturers are always spending on research and development in order to come out with innovative goods. Demand for atelocollagen producers has already improved the lives of millions of people by expanding the sales of atelocollagen in a variety of sectors through their different products.

Regenerative medicine and tissue structure engineering goods are driven by government restrictions and increased demand in end-use sectors such as pharma, cosmetics, and medical devices. The emergence of regenerative medicine products is the most recent development in the sales of the atelocollagen end-use consumption business.

Colway International has introduced a cosmetic that contains atelocollagen. The product is called 'Atelokolagen' and comes in a 50 ml bottle. It contains three forms of low-molecular collagen, the first of which is derived from fish skin molecules, the second of which is atelocollagen, and the third of which is procollagen and is designed for use in face, skin, and neckline care.

Which is the Leading Region in the Atelocollagen Market

The demand for atelocollagen has seen a considerable increase in demand due to characteristics such as its ability to be shared in many forms, such as powder and gel, as well as the existence of anti-aging and other skincare benefits.

Growing public awareness about skincare promotes sales of anti-aging and skin-repairing treatments, which drives demand for atelocollagen products even higher. North America is predicted to have the largest market share of all the major regions, followed by Europe.

Due to increased sales of atelocollagen from China, Japan, India, Korea, and other nations in the area, the Asia-Pacific market is predicted to develop at a high rate. Over the projection period, the Middle East and Africa are expected to account for a considerable portion of the worldwide atelocollagen market.

Sudip Saha
Sudip Saha

Principal Consultant

Talk to Analyst

Find your sweet spots for generating winning opportunities in this market.

How Strong is the Competition in the Atelocollagen Market

Koken Co., Ltd, Colway International S.A., Integra LifeSciences, Innocoll GmbH, Sewon Cellontech Co., Ltd., Shengchi, Taike Bio, Collagen Solutions, Collagen Matrix, Symatese, Shuangmei, Maverick Biosciences, REPROCELL USA Inc., Stryker, interim, Encoll, and DSM, among others, are some of the major players in the atelocollagen market.

Recent developments of the Atelocollagen Market:

  • Nitta Gelatin NA will introduce Replenwell, a new range of highly functional collagen peptide components, to its Wellnex portfolio in September 2020. Replenwell collagen peptides are available in a range of raw material sources, including fish, bovine, and porcine, and have been clinically proven for safety and effectiveness.
  • Collagen Solutions and Rosen's Diversified formed cooperation in October 2020. (USA). Rosen's Diversified contributed USD 4.7 million to Collagen Solutions plc as part of the deal. Collagen Solutions plc will benefit from this investment as it expands and grows its company.
  • Gelita AG purchased 65 percent of the shares in the Turkish gelatin maker SelJel in December 2020. (Turkey). The purchase is part of the firm's expansion plan, allowing it to fulfill the rising demand for halal beef gelatin.
  • A Giang, Vietnam's pangasius enterprise Nam Viet Joint Stock Company - or Navico - teamed up with Amicogen, a South Korean partner, to start construction on a new collagen and gelatin facility in the Mekong Delta in August 2021.

Report Scope

Report Attribute Details
Growth rate CAGR of 5.5% from 2022 to 2032
The base year for estimation 2021
Historical data 2015 to 2020
Forecast period 2022 to 2032
Quantitative units Revenue in USD billion, volume in kilotons, and CAGR from 2022 to 2032
Report Coverage Revenue forecast, volume forecast, company ranking, competitive landscape, growth factors, and trends, Pricing Analysis
Segments Covered Source, form, application, region
Regional scope North America; Western Europe, Eastern Europe, Middle East, Africa, ASEAN, South Asia, Rest of Asia, Australia, and New Zealand
Country scope USA; Canada; Mexico; Germany; United Kingdom; France; Italy; Spain; Russia; Belgium; Poland; Czech Republic; China; India; Japan; Australia; Brazil; Argentina; Colombia; Saudi Arabia; United Arab Emirates(UAE); Iran; South Africa
Key companies profiled Koken Co., Ltd, Colway International S.A., Integra LifeSciences, Innocoll GmbH, Sewon Cellontech Co., Ltd., Shengchi, Taike Bio, Collagen Solutions, Collagen Matrix, Symatese, Shuangmei, Maverick Biosciences, REPROCELL USA Inc., Stryker, interim, Encoll, and DSM, among others
Customization scope Free report customization (equivalent to up to 8 analysts' working days) with purchase. Addition or alteration to country, regional & segment scope.
Pricing and purchase options Avail of customized purchase options to meet your exact research needs.

Get the data you need at a Fraction of the cost

Personalize your report by choosing insights you need
and save 40%!

Key Segments For Atelocollagen Market

Based On Sources, The Atelocollagen Market Is Segmented Into:

  • Bovine
  • Porcine
  • Shark
  • Other

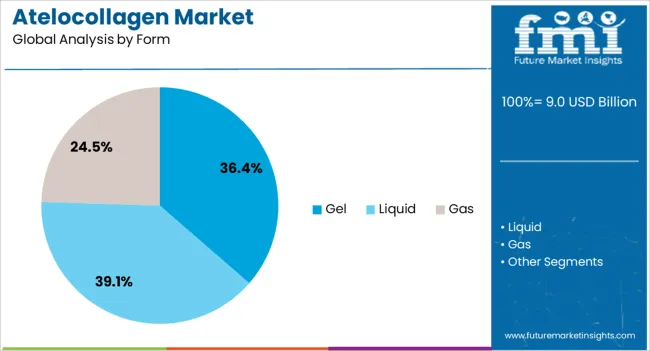
Based On Form, The Atelocollagen Market Is Segmented Into:

  • Liquid
  • Gas
  • Gel

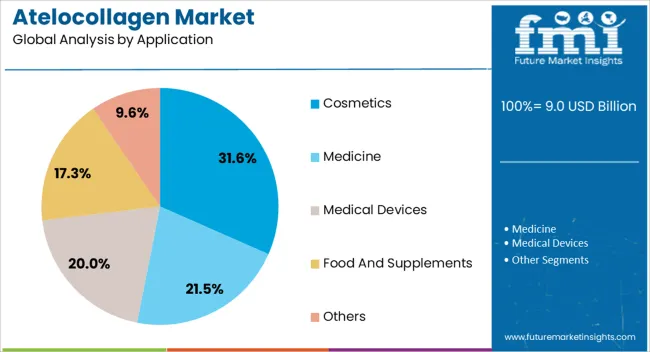
Based On Application, The Atelocollagen Market Is Segmented Into:

  • Cosmetics
  • Medicine
  • Medical Devices
  • Food & Supplements
  • Others

Based On Region, The Atelocollagen Market Is Segmented Into:

  • North America (USA, Canada)
  • Latin America (Mexico, Brazil)
  • Europe (Germany, United Kingdom, France, Italy, Spain, Poland, Russia)
  • East Asia (China, Japan, South Korea)
  • South Asia (India, Thailand, Malaysia, Vietnam, Indonesia)
  • Oceania (Australia, New Zealand)
  • Middle East & Africa (GCC Countries, Turkey, Northern Africa, South Africa)

Frequently Asked Questions

What is the Growth Outlook for the Atelocollagen Market?

The atelocollagen market is predicted to register a CAGR of 5.5% during the forecast period.

Who are the Key Players in the Atelocollagen Market?

Key players holding substantial atelocollagen market share include Collagen Solutions, Collagen Matrix, Symatese, Shuangmei, Maverick Biosciences, REPROCELL USA Inc., Stryker, interim, Encoll, and DSM.

What is the Future of the Atelocollagen Market?

As per the analysis, the atelocollagen market share is likely to be US$ 10.2 Billion by 2026.

Which is the Key Driver in the Atelocollagen Market?

Demand for atelocollagen is likely to rise due to regenerative medicine and tissue structure engineering goods being driven by government restrictions and increased demand in end-use sectors such as pharma, cosmetics, and medical devices.

Table of Content

1. Executive Summary | Atelocollagen Market

    1.1. Global Market Outlook

    1.2. Demand-side Trends

    1.3. Supply-side Trends

    1.4. Technology Roadmap Analysis

    1.5. Analysis and Recommendations

2. Market Overview

    2.1. Market Coverage / Taxonomy

    2.2. Market Definition / Scope / Limitations

3. Market Background

    3.1. Market Dynamics

        3.1.1. Drivers

        3.1.2. Restraints

        3.1.3. Opportunity

        3.1.4. Trends

    3.2. Scenario Forecast

        3.2.1. Demand in Optimistic Scenario

        3.2.2. Demand in Likely Scenario

        3.2.3. Demand in Conservative Scenario

    3.3. Opportunity Map Analysis

    3.4. Investment Feasibility Matrix

    3.5. PESTLE and Porter’s Analysis

    3.6. Regulatory Landscape

        3.6.1. By Key Regions

        3.6.2. By Key Countries

4. Global Market Analysis 2017 to 2021 and Forecast, 2022 to 2032

    4.1. Historical Market Size Value (US$ Million) & VolumeAnalysis, 2017 to 2021

    4.2. Current and Future Market Size Value (US$ Million) & VolumeProjections, 2022 to 2032

        4.2.1. Y-o-Y Growth Trend Analysis

        4.2.2. Absolute $ Opportunity Analysis

5. Global Market Analysis 2017 to 2021 and Forecast 2022 to 2032, By Source 

    5.1. Introduction / Key Findings

    5.2. Historical Market Size Value (US$ Million) & VolumeAnalysis By Source, 2017 to 2021

    5.3. Current and Future Market Size Value (US$ Million) & VolumeAnalysis and Forecast By Source, 2022 to 2032

        5.3.1. Bovine

        5.3.2. Porcine

        5.3.3. Shark

        5.3.4. Other

    5.4. Y-o-Y Growth Trend Analysis By Source, 2017 to 2021

    5.5. Absolute $ Opportunity Analysis By Source, 2022 to 2032

6. Global Market Analysis 2017 to 2021 and Forecast 2022 to 2032, By Form Type 

    6.1. Introduction / Key Findings

    6.2. Historical Market Size Value (US$ Million) & VolumeAnalysis By Form Type, 2017 to 2021

    6.3. Current and Future Market Size Value (US$ Million) & VolumeAnalysis and Forecast By Form Type, 2022 to 2032

        6.3.1. Liquid

        6.3.2. Gas

        6.3.3. Gel

    6.4. Y-o-Y Growth Trend Analysis By Form Type, 2017 to 2021

    6.5. Absolute $ Opportunity Analysis By Form Type, 2022 to 2032

7. Global Market Analysis 2017 to 2021 and Forecast 2022 to 2032, By Application

    7.1. Introduction / Key Findings

    7.2. Historical Market Size Value (US$ Million) & VolumeAnalysis By Application, 2017 to 2021

    7.3. Current and Future Market Size Value (US$ Million) & VolumeAnalysis and Forecast By Application, 2022 to 2032

        7.3.1. Cosmetics

        7.3.2. Medicine

        7.3.3. Medical Devices

        7.3.4. Food & Supplements

        7.3.5. Others

    7.4. Y-o-Y Growth Trend Analysis By Application, 2017 to 2021

    7.5. Absolute $ Opportunity Analysis By Application, 2022 to 2032

8. Global Market Analysis 2017 to 2021 and Forecast 2022 to 2032, By Region

    8.1. Introduction

    8.2. Historical Market Size Value (US$ Million) & VolumeAnalysis By Region, 2017 to 2021

    8.3. Current Market Size Value (US$ Million) & VolumeAnalysis and Forecast By Region, 2022 to 2032

        8.3.1. North America

        8.3.2. Latin America

        8.3.3. Europe

        8.3.4. East Asia

        8.3.5. South Asia

        8.3.6. Oceania

        8.3.7. Middle East and Africa

    8.4. Market Attractiveness Analysis By Region

9. North America Market Analysis 2017 to 2021 and Forecast 2022 to 2032, By Country

    9.1. Historical Market Size Value (US$ Million) & VolumeTrend Analysis By Market Taxonomy, 2017 to 2021

    9.2. Market Size Value (US$ Million) & VolumeForecast By Market Taxonomy, 2022 to 2032

        9.2.1. By Country

            9.2.1.1. USA

            9.2.1.2. Canada

        9.2.2. By Source

        9.2.3. By Form Type

        9.2.4. By Application

    9.3. Market Attractiveness Analysis

        9.3.1. By Country

        9.3.2. By Source

        9.3.3. By Form Type

        9.3.4. By Application

    9.4. Key Takeaways

10. Latin America Market Analysis 2017 to 2021 and Forecast 2022 to 2032, By Country

    10.1. Historical Market Size Value (US$ Million) & VolumeTrend Analysis By Market Taxonomy, 2017 to 2021

    10.2. Market Size Value (US$ Million) & VolumeForecast By Market Taxonomy, 2022 to 2032

        10.2.1. By Country

            10.2.1.1. Brazil

            10.2.1.2. Mexico

            10.2.1.3. Rest of Latin America

        10.2.2. By Source

        10.2.3. By Form Type

        10.2.4. By Application

    10.3. Market Attractiveness Analysis

        10.3.1. By Country

        10.3.2. By Source

        10.3.3. By Form Type

        10.3.4. By Application

    10.4. Key Takeaways

11. Europe Market Analysis 2017 to 2021 and Forecast 2022 to 2032, By Country

    11.1. Historical Market Size Value (US$ Million) & VolumeTrend Analysis By Market Taxonomy, 2017 to 2021

    11.2. Market Size Value (US$ Million) & VolumeForecast By Market Taxonomy, 2022 to 2032

        11.2.1. By Country

            11.2.1.1. Germany

            11.2.1.2. Italy

            11.2.1.3. France

            11.2.1.4. United Kingdom

            11.2.1.5. Spain

            11.2.1.6. Russia

            11.2.1.7. BENELUX

            11.2.1.8. Rest of Europe

        11.2.2. By Source

        11.2.3. By Form Type

        11.2.4. By Application

    11.3. Market Attractiveness Analysis

        11.3.1. By Country

        11.3.2. By Source

        11.3.3. By Form Type

        11.3.4. By Application

    11.4. Key Takeaways

12. East Asia Market Analysis 2017 to 2021 and Forecast 2022 to 2032, By Country

    12.1. Historical Market Size Value (US$ Million) & VolumeTrend Analysis By Market Taxonomy, 2017 to 2021

    12.2. Market Size Value (US$ Million) & VolumeForecast By Market Taxonomy, 2022 to 2032

        12.2.1. By Country

            12.2.1.1. China

            12.2.1.2. Japan

            12.2.1.3. South Korea

        12.2.2. By Source

        12.2.3. By Form Type

        12.2.4. By Application

    12.3. Market Attractiveness Analysis

        12.3.1. By Country

        12.3.2. By Source

        12.3.3. By Form Type

        12.3.4. By Application

    12.4. Key Takeaways

13. South Asia Market Analysis 2017 to 2021 and Forecast 2022 to 2032, By Country

    13.1. Historical Market Size Value (US$ Million) & VolumeTrend Analysis By Market Taxonomy, 2017 to 2021

    13.2. Market Size Value (US$ Million) & VolumeForecast By Market Taxonomy, 2022 to 2032

        13.2.1. By Country

            13.2.1.1. India

            13.2.1.2. Thailand

            13.2.1.3. Malaysia

            13.2.1.4. Indonesia

            13.2.1.5. Rest of South Asia

        13.2.2. By Source

        13.2.3. By Form Type

        13.2.4. By Application

    13.3. Market Attractiveness Analysis

        13.3.1. By Country

        13.3.2. By Source

        13.3.3. By Form Type

        13.3.4. By Application

    13.4. Key Takeaways

14. Oceania Market Analysis 2017 to 2021 and Forecast 2022 to 2032, By Country

    14.1. Historical Market Size Value (US$ Million) & VolumeTrend Analysis By Market Taxonomy, 2017 to 2021

    14.2. Market Size Value (US$ Million) & VolumeForecast By Market Taxonomy, 2022 to 2032

        14.2.1. By Country

            14.2.1.1. Australia

            14.2.1.2. New Zealand

        14.2.2. By Source

        14.2.3. By Form Type

        14.2.4. By Application

    14.3. Market Attractiveness Analysis

        14.3.1. By Country

        14.3.2. By Source

        14.3.3. By Form Type

        14.3.4. By Application

    14.4. Key Takeaways

15. Middle East and Africa Market Analysis 2017 to 2021 and Forecast 2022 to 2032, By Country

    15.1. Historical Market Size Value (US$ Million) & VolumeTrend Analysis By Market Taxonomy, 2017 to 2021

    15.2. Market Size Value (US$ Million) & VolumeForecast By Market Taxonomy, 2022 to 2032

        15.2.1. By Country

            15.2.1.1. GCC Countries

            15.2.1.2. Turkey

            15.2.1.3. Israel

            15.2.1.4. South Africa

            15.2.1.5. Egypt

            15.2.1.6. Rest of Middle East and Africa

        15.2.2. By Source

        15.2.3. By Form Type

        15.2.4. By Application

    15.3. Market Attractiveness Analysis

        15.3.1. By Country

        15.3.2. By Source

        15.3.3. By Form Type

        15.3.4. By Application

    15.4. Key Takeaways

16. Key Countries Market Analysis

    16.1. USA

        16.1.1. Pricing Analysis

        16.1.2. Market Share Analysis, 2021

            16.1.2.1. By Source

            16.1.2.2. By Form Type

            16.1.2.3. By Application

    16.2. Canada

        16.2.1. Pricing Analysis

        16.2.2. Market Share Analysis, 2021

            16.2.2.1. By Source

            16.2.2.2. By Form Type

            16.2.2.3. By Application

    16.3. Brazil

        16.3.1. Pricing Analysis

        16.3.2. Market Share Analysis, 2021

            16.3.2.1. By Source

            16.3.2.2. By Form Type

            16.3.2.3. By Application

    16.4. Mexico

        16.4.1. Pricing Analysis

        16.4.2. Market Share Analysis, 2021

            16.4.2.1. By Source

            16.4.2.2. By Form Type

            16.4.2.3. By Application

    16.5. Argentina

        16.5.1. Pricing Analysis

        16.5.2. Market Share Analysis, 2021

            16.5.2.1. By Source

            16.5.2.2. By Form Type

            16.5.2.3. By Application

    16.6. Germany

        16.6.1. Pricing Analysis

        16.6.2. Market Share Analysis, 2021

            16.6.2.1. By Source

            16.6.2.2. By Form Type

            16.6.2.3. By Application

    16.7. Italy

        16.7.1. Pricing Analysis

        16.7.2. Market Share Analysis, 2021

            16.7.2.1. By Source

            16.7.2.2. By Form Type

            16.7.2.3. By Application

    16.8. France

        16.8.1. Pricing Analysis

        16.8.2. Market Share Analysis, 2021

            16.8.2.1. By Source

            16.8.2.2. By Form Type

            16.8.2.3. By Application

    16.9. United Kingdom

        16.9.1. Pricing Analysis

        16.9.2. Market Share Analysis, 2021

            16.9.2.1. By Source

            16.9.2.2. By Form Type

            16.9.2.3. By Application

    16.10. Spain

        16.10.1. Pricing Analysis

        16.10.2. Market Share Analysis, 2021

            16.10.2.1. By Source

            16.10.2.2. By Form Type

            16.10.2.3. By Application

    16.11. Russia

        16.11.1. Pricing Analysis

        16.11.2. Market Share Analysis, 2021

            16.11.2.1. By Source

            16.11.2.2. By Form Type

            16.11.2.3. By Application

    16.12. BENELUX

        16.12.1. Pricing Analysis

        16.12.2. Market Share Analysis, 2021

            16.12.2.1. By Source

            16.12.2.2. By Form Type

            16.12.2.3. By Application

    16.13. China

        16.13.1. Pricing Analysis

        16.13.2. Market Share Analysis, 2021

            16.13.2.1. By Source

            16.13.2.2. By Form Type

            16.13.2.3. By Application

    16.14. Japan

        16.14.1. Pricing Analysis

        16.14.2. Market Share Analysis, 2021

            16.14.2.1. By Source

            16.14.2.2. By Form Type

            16.14.2.3. By Application

    16.15. South Korea

        16.15.1. Pricing Analysis

        16.15.2. Market Share Analysis, 2021

            16.15.2.1. By Source

            16.15.2.2. By Form Type

            16.15.2.3. By Application

    16.16. India

        16.16.1. Pricing Analysis

        16.16.2. Market Share Analysis, 2021

            16.16.2.1. By Source

            16.16.2.2. By Form Type

            16.16.2.3. By Application

    16.17. GCC Countries

        16.17.1. Pricing Analysis

        16.17.2. Market Share Analysis, 2021

            16.17.2.1. By Source

            16.17.2.2. By Form Type

            16.17.2.3. By Application

    16.18. Turkey

        16.18.1. Pricing Analysis

        16.18.2. Market Share Analysis, 2021

            16.18.2.1. By Source

            16.18.2.2. By Form Type

            16.18.2.3. By Application

    16.19. Israel

        16.19.1. Pricing Analysis

        16.19.2. Market Share Analysis, 2021

            16.19.2.1. By Source

            16.19.2.2. By Form Type

            16.19.2.3. By Application

    16.20. South Africa

        16.20.1. Pricing Analysis

        16.20.2. Market Share Analysis, 2021

            16.20.2.1. By Source

            16.20.2.2. By Form Type

            16.20.2.3. By Application

    16.21. Egypt

        16.21.1. Pricing Analysis

        16.21.2. Market Share Analysis, 2021

            16.21.2.1. By Source

            16.21.2.2. By Form Type

            16.21.2.3. By Application

17. Market Structure Analysis

    17.1. Competition Dashboard

    17.2. Competition Benchmarking

    17.3. Market Share Analysis of Top Players

        17.3.1. By Regional

        17.3.2. By Source

        17.3.3. By Form Type

        17.3.4. By Application

18. Competition Analysis

    18.1. Competition Deep Dive

        18.1.1. Koken Co.,Ltd

            18.1.1.1. Overview

            18.1.1.2. Product Portfolio

            18.1.1.3. Profitability by Market Segment

            18.1.1.4. Sales Footprint

            18.1.1.5. Strategy Overview

                18.1.1.5.1. Marketing Strategy

                18.1.1.5.2. Product Strategy

        18.1.2. Colway International S.A

            18.1.2.1. Overview

            18.1.2.2. Product Portfolio

            18.1.2.3. Profitability by Market Segment

            18.1.2.4. Sales Footprint

            18.1.2.5. Strategy Overview

                18.1.2.5.1. Marketing Strategy

                18.1.2.5.2. Product Strategy

        18.1.3. Integra LifeSciences

            18.1.3.1. Overview

            18.1.3.2. Product Portfolio

            18.1.3.3. Profitability by Market Segment

            18.1.3.4. Sales Footprint

            18.1.3.5. Strategy Overview

                18.1.3.5.1. Marketing Strategy

                18.1.3.5.2. Product Strategy

        18.1.4. Innocoll GmbH

            18.1.4.1. Overview

            18.1.4.2. Product Portfolio

            18.1.4.3. Profitability by Market Segment

            18.1.4.4. Sales Footprint

            18.1.4.5. Strategy Overview

                18.1.4.5.1. Marketing Strategy

                18.1.4.5.2. Product Strategy

        18.1.5. Sewon Cellontech Co., Ltd

            18.1.5.1. Overview

            18.1.5.2. Product Portfolio

            18.1.5.3. Profitability by Market Segment

            18.1.5.4. Sales Footprint

            18.1.5.5. Strategy Overview

                18.1.5.5.1. Marketing Strategy

                18.1.5.5.2. Product Strategy

        18.1.6. Shengchi

            18.1.6.1. Overview

            18.1.6.2. Product Portfolio

            18.1.6.3. Profitability by Market Segment

            18.1.6.4. Sales Footprint

            18.1.6.5. Strategy Overview

                18.1.6.5.1. Marketing Strategy

                18.1.6.5.2. Product Strategy

        18.1.7. Taike Bio,

            18.1.7.1. Overview

            18.1.7.2. Product Portfolio

            18.1.7.3. Profitability by Market Segment

            18.1.7.4. Sales Footprint

            18.1.7.5. Strategy Overview

                18.1.7.5.1. Marketing Strategy

                18.1.7.5.2. Product Strategy

        18.1.8. Collagen Solutions

            18.1.8.1. Overview

            18.1.8.2. Product Portfolio

            18.1.8.3. Profitability by Market Segment

            18.1.8.4. Sales Footprint

            18.1.8.5. Strategy Overview

                18.1.8.5.1. Marketing Strategy

                18.1.8.5.2. Product Strategy

        18.1.9. Collagen Matrix

            18.1.9.1. Overview

            18.1.9.2. Product Portfolio

            18.1.9.3. Profitability by Market Segment

            18.1.9.4. Sales Footprint

            18.1.9.5. Strategy Overview

                18.1.9.5.1. Marketing Strategy

                18.1.9.5.2. Product Strategy

        18.1.10. Symatese

            18.1.10.1. Overview

            18.1.10.2. Product Portfolio

            18.1.10.3. Profitability by Market Segment

            18.1.10.4. Sales Footprint

            18.1.10.5. Strategy Overview

                18.1.10.5.1. Marketing Strategy

                18.1.10.5.2. Product Strategy

        18.1.11. Shuangmei,

            18.1.11.1. Overview

            18.1.11.2. Product Portfolio

            18.1.11.3. Profitability by Market Segment

            18.1.11.4. Sales Footprint

            18.1.11.5. Strategy Overview

                18.1.11.5.1. Marketing Strategy

                18.1.11.5.2. Product Strategy

        18.1.12. Maverick Biosciences

            18.1.12.1. Overview

            18.1.12.2. Product Portfolio

            18.1.12.3. Profitability by Market Segment

            18.1.12.4. Sales Footprint

            18.1.12.5. Strategy Overview

                18.1.12.5.1. Marketing Strategy

                18.1.12.5.2. Product Strategy

        18.1.13. REPROCELL USA Inc.

            18.1.13.1. Overview

            18.1.13.2. Product Portfolio

            18.1.13.3. Profitability by Market Segment

            18.1.13.4. Sales Footprint

            18.1.13.5. Strategy Overview

                18.1.13.5.1. Marketing Strategy

                18.1.13.5.2. Product Strategy

        18.1.14. interim

            18.1.14.1. Overview

            18.1.14.2. Product Portfolio

            18.1.14.3. Profitability by Market Segment

            18.1.14.4. Sales Footprint

            18.1.14.5. Strategy Overview

                18.1.14.5.1. Marketing Strategy

                18.1.14.5.2. Product Strategy

        18.1.15. Stryker

            18.1.15.1. Overview

            18.1.15.2. Product Portfolio

            18.1.15.3. Profitability by Market Segment

            18.1.15.4. Sales Footprint

            18.1.15.5. Strategy Overview

                18.1.15.5.1. Marketing Strategy

                18.1.15.5.2. Product Strategy

        18.1.16. Enroll

            18.1.16.1. Overview

            18.1.16.2. Product Portfolio

            18.1.16.3. Profitability by Market Segment

            18.1.16.4. Sales Footprint

            18.1.16.5. Strategy Overview

                18.1.16.5.1. Marketing Strategy

                18.1.16.5.2. Product Strategy

        18.1.17. DSM, 

            18.1.17.1. Overview

            18.1.17.2. Product Portfolio

            18.1.17.3. Profitability by Market Segment

            18.1.17.4. Sales Footprint

            18.1.17.5. Strategy Overview

                18.1.17.5.1. Marketing Strategy

                18.1.17.5.2. Product Strategy

19. Assumptions & Acronyms Used

20. Research Methodology

List of Tables

Table 1: Global Market Value (US$ Million) Forecast by Region, 2017 to 2032

Table 2: Global Market Volume Forecast by Region, 2017 to 2032

Table 3: Global Market Value (US$ Million) Forecast by Source, 2017 to 2032

Table 4: Global Market Volume Forecast by Source, 2017 to 2032

Table 5: Global Market Value (US$ Million) Forecast by Form Type, 2017 to 2032

Table 6: Global Market Volume Forecast by Form Type, 2017 to 2032

Table 7: Global Market Value (US$ Million) Forecast by Application, 2017 to 2032

Table 8: Global Market Volume Forecast by Application, 2017 to 2032

Table 9: North America Market Value (US$ Million) Forecast by Country, 2017 to 2032

Table 10: North America Market Volume Forecast by Country, 2017 to 2032

Table 11: North America Market Value (US$ Million) Forecast by Source, 2017 to 2032

Table 12: North America Market Volume Forecast by Source, 2017 to 2032

Table 13: North America Market Value (US$ Million) Forecast by Form Type, 2017 to 2032

Table 14: North America Market Volume Forecast by Form Type, 2017 to 2032

Table 15: North America Market Value (US$ Million) Forecast by Application, 2017 to 2032

Table 16: North America Market Volume Forecast by Application, 2017 to 2032

Table 17: Latin America Market Value (US$ Million) Forecast by Country, 2017 to 2032

Table 18: Latin America Market Volume Forecast by Country, 2017 to 2032

Table 19: Latin America Market Value (US$ Million) Forecast by Source, 2017 to 2032

Table 20: Latin America Market Volume Forecast by Source, 2017 to 2032

Table 21: Latin America Market Value (US$ Million) Forecast by Form Type, 2017 to 2032

Table 22: Latin America Market Volume Forecast by Form Type, 2017 to 2032

Table 23: Latin America Market Value (US$ Million) Forecast by Application, 2017 to 2032

Table 24: Latin America Market Volume Forecast by Application, 2017 to 2032

Table 25: Europe Market Value (US$ Million) Forecast by Country, 2017 to 2032

Table 26: Europe Market Volume Forecast by Country, 2017 to 2032

Table 27: Europe Market Value (US$ Million) Forecast by Source, 2017 to 2032

Table 28: Europe Market Volume Forecast by Source, 2017 to 2032

Table 29: Europe Market Value (US$ Million) Forecast by Form Type, 2017 to 2032

Table 30: Europe Market Volume Forecast by Form Type, 2017 to 2032

Table 31: Europe Market Value (US$ Million) Forecast by Application, 2017 to 2032

Table 32: Europe Market Volume Forecast by Application, 2017 to 2032

Table 33: East Asia Market Value (US$ Million) Forecast by Country, 2017 to 2032

Table 34: East Asia Market Volume Forecast by Country, 2017 to 2032

Table 35: East Asia Market Value (US$ Million) Forecast by Source, 2017 to 2032

Table 36: East Asia Market Volume Forecast by Source, 2017 to 2032

Table 37: East Asia Market Value (US$ Million) Forecast by Form Type, 2017 to 2032

Table 38: East Asia Market Volume Forecast by Form Type, 2017 to 2032

Table 39: East Asia Market Value (US$ Million) Forecast by Application, 2017 to 2032

Table 40: East Asia Market Volume Forecast by Application, 2017 to 2032

Table 41: South Asia Market Value (US$ Million) Forecast by Country, 2017 to 2032

Table 42: South Asia Market Volume Forecast by Country, 2017 to 2032

Table 43: South Asia Market Value (US$ Million) Forecast by Source, 2017 to 2032

Table 44: South Asia Market Volume Forecast by Source, 2017 to 2032

Table 45: South Asia Market Value (US$ Million) Forecast by Form Type, 2017 to 2032

Table 46: South Asia Market Volume Forecast by Form Type, 2017 to 2032

Table 47: South Asia Market Value (US$ Million) Forecast by Application, 2017 to 2032

Table 48: South Asia Market Volume Forecast by Application, 2017 to 2032

Table 49: Oceania Market Value (US$ Million) Forecast by Country, 2017 to 2032

Table 50: Oceania Market Volume Forecast by Country, 2017 to 2032

Table 51: Oceania Market Value (US$ Million) Forecast by Source, 2017 to 2032

Table 52: Oceania Market Volume Forecast by Source, 2017 to 2032

Table 53: Oceania Market Value (US$ Million) Forecast by Form Type, 2017 to 2032

Table 54: Oceania Market Volume Forecast by Form Type, 2017 to 2032

Table 55: Oceania Market Value (US$ Million) Forecast by Application, 2017 to 2032

Table 56: Oceania Market Volume Forecast by Application, 2017 to 2032

Table 57: MEA Market Value (US$ Million) Forecast by Country, 2017 to 2032

Table 58: MEA Market Volume Forecast by Country, 2017 to 2032

Table 59: MEA Market Value (US$ Million) Forecast by Source, 2017 to 2032

Table 60: MEA Market Volume Forecast by Source, 2017 to 2032

Table 61: MEA Market Value (US$ Million) Forecast by Form Type, 2017 to 2032

Table 62: MEA Market Volume Forecast by Form Type, 2017 to 2032

Table 63: MEA Market Value (US$ Million) Forecast by Application, 2017 to 2032

Table 64: MEA Market Volume Forecast by Application, 2017 to 2032

List of Charts

Figure 1: Global Market Value (US$ Million) by Source, 2022 to 2032

Figure 2: Global Market Value (US$ Million) by Form Type, 2022 to 2032

Figure 3: Global Market Value (US$ Million) by Application, 2022 to 2032

Figure 4: Global Market Value (US$ Million) by Region, 2022 to 2032

Figure 5: Global Market Value (US$ Million) Analysis by Region, 2017 to 2032

Figure 6: Global Market Volume Analysis by Region, 2017 to 2032

Figure 7: Global Market Value Share (%) and BPS Analysis by Region, 2022 to 2032

Figure 8: Global Market Y-o-Y Growth (%) Projections by Region, 2022 to 2032

Figure 9: Global Market Value (US$ Million) Analysis by Source, 2017 to 2032

Figure 10: Global Market Volume Analysis by Source, 2017 to 2032

Figure 11: Global Market Value Share (%) and BPS Analysis by Source, 2022 to 2032

Figure 12: Global Market Y-o-Y Growth (%) Projections by Source, 2022 to 2032

Figure 13: Global Market Value (US$ Million) Analysis by Form Type, 2017 to 2032

Figure 14: Global Market Volume Analysis by Form Type, 2017 to 2032

Figure 15: Global Market Value Share (%) and BPS Analysis by Form Type, 2022 to 2032

Figure 16: Global Market Y-o-Y Growth (%) Projections by Form Type, 2022 to 2032

Figure 17: Global Market Value (US$ Million) Analysis by Application, 2017 to 2032

Figure 18: Global Market Volume Analysis by Application, 2017 to 2032

Figure 19: Global Market Value Share (%) and BPS Analysis by Application, 2022 to 2032

Figure 20: Global Market Y-o-Y Growth (%) Projections by Application, 2022 to 2032

Figure 21: Global Market Attractiveness by Source, 2022 to 2032

Figure 22: Global Market Attractiveness by Form Type, 2022 to 2032

Figure 23: Global Market Attractiveness by Application, 2022 to 2032

Figure 24: Global Market Attractiveness by Region, 2022 to 2032

Figure 25: North America Market Value (US$ Million) by Source, 2022 to 2032

Figure 26: North America Market Value (US$ Million) by Form Type, 2022 to 2032

Figure 27: North America Market Value (US$ Million) by Application, 2022 to 2032

Figure 28: North America Market Value (US$ Million) by Country, 2022 to 2032

Figure 29: North America Market Value (US$ Million) Analysis by Country, 2017 to 2032

Figure 30: North America Market Volume Analysis by Country, 2017 to 2032

Figure 31: North America Market Value Share (%) and BPS Analysis by Country, 2022 to 2032

Figure 32: North America Market Y-o-Y Growth (%) Projections by Country, 2022 to 2032

Figure 33: North America Market Value (US$ Million) Analysis by Source, 2017 to 2032

Figure 34: North America Market Volume Analysis by Source, 2017 to 2032

Figure 35: North America Market Value Share (%) and BPS Analysis by Source, 2022 to 2032

Figure 36: North America Market Y-o-Y Growth (%) Projections by Source, 2022 to 2032

Figure 37: North America Market Value (US$ Million) Analysis by Form Type, 2017 to 2032

Figure 38: North America Market Volume Analysis by Form Type, 2017 to 2032

Figure 39: North America Market Value Share (%) and BPS Analysis by Form Type, 2022 to 2032

Figure 40: North America Market Y-o-Y Growth (%) Projections by Form Type, 2022 to 2032

Figure 41: North America Market Value (US$ Million) Analysis by Application, 2017 to 2032

Figure 42: North America Market Volume Analysis by Application, 2017 to 2032

Figure 43: North America Market Value Share (%) and BPS Analysis by Application, 2022 to 2032

Figure 44: North America Market Y-o-Y Growth (%) Projections by Application, 2022 to 2032

Figure 45: North America Market Attractiveness by Source, 2022 to 2032

Figure 46: North America Market Attractiveness by Form Type, 2022 to 2032

Figure 47: North America Market Attractiveness by Application, 2022 to 2032

Figure 48: North America Market Attractiveness by Country, 2022 to 2032

Figure 49: Latin America Market Value (US$ Million) by Source, 2022 to 2032

Figure 50: Latin America Market Value (US$ Million) by Form Type, 2022 to 2032

Figure 51: Latin America Market Value (US$ Million) by Application, 2022 to 2032

Figure 52: Latin America Market Value (US$ Million) by Country, 2022 to 2032

Figure 53: Latin America Market Value (US$ Million) Analysis by Country, 2017 to 2032

Figure 54: Latin America Market Volume Analysis by Country, 2017 to 2032

Figure 55: Latin America Market Value Share (%) and BPS Analysis by Country, 2022 to 2032

Figure 56: Latin America Market Y-o-Y Growth (%) Projections by Country, 2022 to 2032

Figure 57: Latin America Market Value (US$ Million) Analysis by Source, 2017 to 2032

Figure 58: Latin America Market Volume Analysis by Source, 2017 to 2032

Figure 59: Latin America Market Value Share (%) and BPS Analysis by Source, 2022 to 2032

Figure 60: Latin America Market Y-o-Y Growth (%) Projections by Source, 2022 to 2032

Figure 61: Latin America Market Value (US$ Million) Analysis by Form Type, 2017 to 2032

Figure 62: Latin America Market Volume Analysis by Form Type, 2017 to 2032

Figure 63: Latin America Market Value Share (%) and BPS Analysis by Form Type, 2022 to 2032

Figure 64: Latin America Market Y-o-Y Growth (%) Projections by Form Type, 2022 to 2032

Figure 65: Latin America Market Value (US$ Million) Analysis by Application, 2017 to 2032

Figure 66: Latin America Market Volume Analysis by Application, 2017 to 2032

Figure 67: Latin America Market Value Share (%) and BPS Analysis by Application, 2022 to 2032

Figure 68: Latin America Market Y-o-Y Growth (%) Projections by Application, 2022 to 2032

Figure 69: Latin America Market Attractiveness by Source, 2022 to 2032

Figure 70: Latin America Market Attractiveness by Form Type, 2022 to 2032

Figure 71: Latin America Market Attractiveness by Application, 2022 to 2032

Figure 72: Latin America Market Attractiveness by Country, 2022 to 2032

Figure 73: Europe Market Value (US$ Million) by Source, 2022 to 2032

Figure 74: Europe Market Value (US$ Million) by Form Type, 2022 to 2032

Figure 75: Europe Market Value (US$ Million) by Application, 2022 to 2032

Figure 76: Europe Market Value (US$ Million) by Country, 2022 to 2032

Figure 77: Europe Market Value (US$ Million) Analysis by Country, 2017 to 2032

Figure 78: Europe Market Volume Analysis by Country, 2017 to 2032

Figure 79: Europe Market Value Share (%) and BPS Analysis by Country, 2022 to 2032

Figure 80: Europe Market Y-o-Y Growth (%) Projections by Country, 2022 to 2032

Figure 81: Europe Market Value (US$ Million) Analysis by Source, 2017 to 2032

Figure 82: Europe Market Volume Analysis by Source, 2017 to 2032

Figure 83: Europe Market Value Share (%) and BPS Analysis by Source, 2022 to 2032

Figure 84: Europe Market Y-o-Y Growth (%) Projections by Source, 2022 to 2032

Figure 85: Europe Market Value (US$ Million) Analysis by Form Type, 2017 to 2032

Figure 86: Europe Market Volume Analysis by Form Type, 2017 to 2032

Figure 87: Europe Market Value Share (%) and BPS Analysis by Form Type, 2022 to 2032

Figure 88: Europe Market Y-o-Y Growth (%) Projections by Form Type, 2022 to 2032

Figure 89: Europe Market Value (US$ Million) Analysis by Application, 2017 to 2032

Figure 90: Europe Market Volume Analysis by Application, 2017 to 2032

Figure 91: Europe Market Value Share (%) and BPS Analysis by Application, 2022 to 2032

Figure 92: Europe Market Y-o-Y Growth (%) Projections by Application, 2022 to 2032

Figure 93: Europe Market Attractiveness by Source, 2022 to 2032

Figure 94: Europe Market Attractiveness by Form Type, 2022 to 2032

Figure 95: Europe Market Attractiveness by Application, 2022 to 2032

Figure 96: Europe Market Attractiveness by Country, 2022 to 2032

Figure 97: East Asia Market Value (US$ Million) by Source, 2022 to 2032

Figure 98: East Asia Market Value (US$ Million) by Form Type, 2022 to 2032

Figure 99: East Asia Market Value (US$ Million) by Application, 2022 to 2032

Figure 100: East Asia Market Value (US$ Million) by Country, 2022 to 2032

Figure 101: East Asia Market Value (US$ Million) Analysis by Country, 2017 to 2032

Figure 102: East Asia Market Volume Analysis by Country, 2017 to 2032

Figure 103: East Asia Market Value Share (%) and BPS Analysis by Country, 2022 to 2032

Figure 104: East Asia Market Y-o-Y Growth (%) Projections by Country, 2022 to 2032

Figure 105: East Asia Market Value (US$ Million) Analysis by Source, 2017 to 2032

Figure 106: East Asia Market Volume Analysis by Source, 2017 to 2032

Figure 107: East Asia Market Value Share (%) and BPS Analysis by Source, 2022 to 2032

Figure 108: East Asia Market Y-o-Y Growth (%) Projections by Source, 2022 to 2032

Figure 109: East Asia Market Value (US$ Million) Analysis by Form Type, 2017 to 2032

Figure 110: East Asia Market Volume Analysis by Form Type, 2017 to 2032

Figure 111: East Asia Market Value Share (%) and BPS Analysis by Form Type, 2022 to 2032

Figure 112: East Asia Market Y-o-Y Growth (%) Projections by Form Type, 2022 to 2032

Figure 113: East Asia Market Value (US$ Million) Analysis by Application, 2017 to 2032

Figure 114: East Asia Market Volume Analysis by Application, 2017 to 2032

Figure 115: East Asia Market Value Share (%) and BPS Analysis by Application, 2022 to 2032

Figure 116: East Asia Market Y-o-Y Growth (%) Projections by Application, 2022 to 2032

Figure 117: East Asia Market Attractiveness by Source, 2022 to 2032

Figure 118: East Asia Market Attractiveness by Form Type, 2022 to 2032

Figure 119: East Asia Market Attractiveness by Application, 2022 to 2032

Figure 120: East Asia Market Attractiveness by Country, 2022 to 2032

Figure 121: South Asia Market Value (US$ Million) by Source, 2022 to 2032

Figure 122: South Asia Market Value (US$ Million) by Form Type, 2022 to 2032

Figure 123: South Asia Market Value (US$ Million) by Application, 2022 to 2032

Figure 124: South Asia Market Value (US$ Million) by Country, 2022 to 2032

Figure 125: South Asia Market Value (US$ Million) Analysis by Country, 2017 to 2032

Figure 126: South Asia Market Volume Analysis by Country, 2017 to 2032

Figure 127: South Asia Market Value Share (%) and BPS Analysis by Country, 2022 to 2032

Figure 128: South Asia Market Y-o-Y Growth (%) Projections by Country, 2022 to 2032

Figure 129: South Asia Market Value (US$ Million) Analysis by Source, 2017 to 2032

Figure 130: South Asia Market Volume Analysis by Source, 2017 to 2032

Figure 131: South Asia Market Value Share (%) and BPS Analysis by Source, 2022 to 2032

Figure 132: South Asia Market Y-o-Y Growth (%) Projections by Source, 2022 to 2032

Figure 133: South Asia Market Value (US$ Million) Analysis by Form Type, 2017 to 2032

Figure 134: South Asia Market Volume Analysis by Form Type, 2017 to 2032

Figure 135: South Asia Market Value Share (%) and BPS Analysis by Form Type, 2022 to 2032

Figure 136: South Asia Market Y-o-Y Growth (%) Projections by Form Type, 2022 to 2032

Figure 137: South Asia Market Value (US$ Million) Analysis by Application, 2017 to 2032

Figure 138: South Asia Market Volume Analysis by Application, 2017 to 2032

Figure 139: South Asia Market Value Share (%) and BPS Analysis by Application, 2022 to 2032

Figure 140: South Asia Market Y-o-Y Growth (%) Projections by Application, 2022 to 2032

Figure 141: South Asia Market Attractiveness by Source, 2022 to 2032

Figure 142: South Asia Market Attractiveness by Form Type, 2022 to 2032

Figure 143: South Asia Market Attractiveness by Application, 2022 to 2032

Figure 144: South Asia Market Attractiveness by Country, 2022 to 2032

Figure 145: Oceania Market Value (US$ Million) by Source, 2022 to 2032

Figure 146: Oceania Market Value (US$ Million) by Form Type, 2022 to 2032

Figure 147: Oceania Market Value (US$ Million) by Application, 2022 to 2032

Figure 148: Oceania Market Value (US$ Million) by Country, 2022 to 2032

Figure 149: Oceania Market Value (US$ Million) Analysis by Country, 2017 to 2032

Figure 150: Oceania Market Volume Analysis by Country, 2017 to 2032

Figure 151: Oceania Market Value Share (%) and BPS Analysis by Country, 2022 to 2032

Figure 152: Oceania Market Y-o-Y Growth (%) Projections by Country, 2022 to 2032

Figure 153: Oceania Market Value (US$ Million) Analysis by Source, 2017 to 2032

Figure 154: Oceania Market Volume Analysis by Source, 2017 to 2032

Figure 155: Oceania Market Value Share (%) and BPS Analysis by Source, 2022 to 2032

Figure 156: Oceania Market Y-o-Y Growth (%) Projections by Source, 2022 to 2032

Figure 157: Oceania Market Value (US$ Million) Analysis by Form Type, 2017 to 2032

Figure 158: Oceania Market Volume Analysis by Form Type, 2017 to 2032

Figure 159: Oceania Market Value Share (%) and BPS Analysis by Form Type, 2022 to 2032

Figure 160: Oceania Market Y-o-Y Growth (%) Projections by Form Type, 2022 to 2032

Figure 161: Oceania Market Value (US$ Million) Analysis by Application, 2017 to 2032

Figure 162: Oceania Market Volume Analysis by Application, 2017 to 2032

Figure 163: Oceania Market Value Share (%) and BPS Analysis by Application, 2022 to 2032

Figure 164: Oceania Market Y-o-Y Growth (%) Projections by Application, 2022 to 2032

Figure 165: Oceania Market Attractiveness by Source, 2022 to 2032

Figure 166: Oceania Market Attractiveness by Form Type, 2022 to 2032

Figure 167: Oceania Market Attractiveness by Application, 2022 to 2032

Figure 168: Oceania Market Attractiveness by Country, 2022 to 2032

Figure 169: MEA Market Value (US$ Million) by Source, 2022 to 2032

Figure 170: MEA Market Value (US$ Million) by Form Type, 2022 to 2032

Figure 171: MEA Market Value (US$ Million) by Application, 2022 to 2032

Figure 172: MEA Market Value (US$ Million) by Country, 2022 to 2032

Figure 173: MEA Market Value (US$ Million) Analysis by Country, 2017 to 2032

Figure 174: MEA Market Volume Analysis by Country, 2017 to 2032

Figure 175: MEA Market Value Share (%) and BPS Analysis by Country, 2022 to 2032

Figure 176: MEA Market Y-o-Y Growth (%) Projections by Country, 2022 to 2032

Figure 177: MEA Market Value (US$ Million) Analysis by Source, 2017 to 2032

Figure 178: MEA Market Volume Analysis by Source, 2017 to 2032

Figure 179: MEA Market Value Share (%) and BPS Analysis by Source, 2022 to 2032

Figure 180: MEA Market Y-o-Y Growth (%) Projections by Source, 2022 to 2032

Figure 181: MEA Market Value (US$ Million) Analysis by Form Type, 2017 to 2032

Figure 182: MEA Market Volume Analysis by Form Type, 2017 to 2032

Figure 183: MEA Market Value Share (%) and BPS Analysis by Form Type, 2022 to 2032

Figure 184: MEA Market Y-o-Y Growth (%) Projections by Form Type, 2022 to 2032

Figure 185: MEA Market Value (US$ Million) Analysis by Application, 2017 to 2032

Figure 186: MEA Market Volume Analysis by Application, 2017 to 2032

Figure 187: MEA Market Value Share (%) and BPS Analysis by Application, 2022 to 2032

Figure 188: MEA Market Y-o-Y Growth (%) Projections by Application, 2022 to 2032

Figure 189: MEA Market Attractiveness by Source, 2022 to 2032

Figure 190: MEA Market Attractiveness by Form Type, 2022 to 2032

Figure 191: MEA Market Attractiveness by Application, 2022 to 2032

Figure 192: MEA Market Attractiveness by Country, 2022 to 2032

Recommendations

Healthcare

Biotin Supplement Market

Published : October 2023

Consumer Product

Massage Guns Market

Published : March 2023

Consumer Product

Crambe Abyssinica Seed Oil Market

Published : June 2022

Consumer Product

Battery Operated Lights Market

Published : June 2022

Explore Consumer Product Insights

View Reports