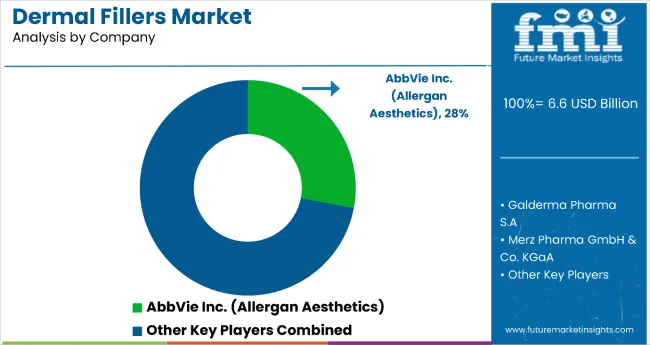
Dermal Fillers Market
Market Insights on Dermal Fillers covering sales outlook, demand forecast & up-to-date key trends
Dermal Fillers Market by Product (Absorbable, Non-Absorbable), Ingredient (Hyaluronic Acid, Poly-L-Lactic Acid, Calcium Hydroxylapatite, Collagen), Application (Aesthetic Restoration, Dentistry, Reconstructive Surgery), End User & Region - Forecast to 2021 - 2031
Dermal Fillers Market - About the Report
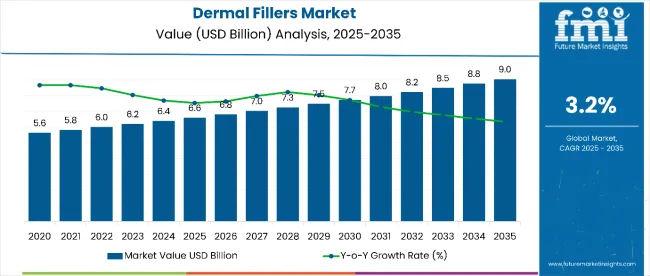
[250 Pages Report] Dermal Fillers Market is projected to exhibit 2.9% CAGR between 2021 and 2031. They are used to rejuvenate different facial areas associated with various functionalities. The rising demand for facelift or face line corrections in various emerging countries is enabling the market growth.
The rising demand for minimally invasive facial treatments and growing preference towards minimally invasive cosmetic procedures have been favoring the overall expansion of the market
In its new study, ESOMAR-certified market research and consulting firm Future Market Insights (FMI) offers insights about key factors driving demand for Dermal Fillers Market. The report tracks the global sales of dermal fillers in 20+ high-growth markets, along with analyzing the impact COVID-19 has had on the medical device industry in general, and dermal fillers in particular.
Let us know your requirement to get
100% FREE customization
What is the Future Outlook for Dermal Fillers Market in Comparison to Historical Pattern?
Dermal fillers are injectable implants often used to give a flawless and rejuvenated facial appearance. Besides this, it is often used as anti-aging methods for the reduction of the wrinkles, skin folds, and smoothening of the skin. The U.S. Food and Drug Administration (FDA) has approved the market for various applications, including restoration and correction of lipoatrophy in people with HIV. Other applications of dermal fillers include correction of cheek, reduction of acne scars, and reduction of nasolabial folds.
Diverse applications is helping to improve an individual’s appearance have been sustaining the growth of the Dermal Fillers market.
Launches by some of the leading companies will enable consistent growth in the coming years. For instance, in April 2019, Allergan plc. has added Juvéderm® VOLUX to its portfolio to offer advanced solutions specially formulated for restoring and volume in the chin and jaw area.
What is the Scope for Research and Development in Dermal Fillers Market?
An increasing number of manufacturers are highly investing in research and development (R&D) to develop new and innovative technologies in the field of cosmeticology. This is resulting in the advent of higher quality fillers that would be easier to use and would confer better satisfaction for patients.
The cross-linked hyaluronic acid, derived from non-animal source has been utilized for a long time and is proven to be safe and effective as dermal fillers. Some of the leading players have been launching novel formulations, which will enable growth in the Dermal Fillers market.
For instance, Bohus Biotech, a Swedish company developed an advanced dermal filler formulation with the use of spherification technology, with smooth, spherical particles replacing the traditional structure. These newer product formulations are extremely stable and long-lasting, leading to fewer procedures
Find your sweet spots for generating winning opportunities in this market.
Talk to AnalystHow is Dermal Fillers Market Gaining from Demand for Minimally Invasive Cosmetic Surgeries?
Globally, customers have been exhibiting an increasing preference for minimally invasive procedures for improving their appearance. For instance, the minimally invasive procedures that witnessed the most significant increase include Botulinum Toxin Type A (increased by 3% over 2019), dermal filling with hyaluronic acid (increased by 1% over 2019 ) and non-surgical skin tightening experienced steady growth among others.
Besides this, increasing investment, some emerging countries are expected to offer high returns. As per the American Society of Plastic Surgeons (ASPS), Brazil had the second largest number of cosmetic procedures with almost 2.3 million procedures conducted in 2018 followed by Mexico (1.0 million), India (0.89 million), and Argentina (0.60 million).
Some of the countries in Asia, Latin America, and Africa depend on locally manufactured dermal fillers, which are low priced and sub-optimal in terms of commercial reach and product portfolio offer. This is expected to bode well for the overall Dermal Fillers market.
Country-wise Insights
How Big is the Opportunity in the U.S?
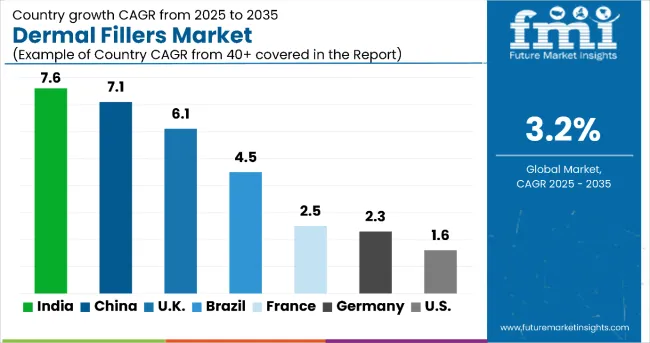
FMI has forecast North America to remain one of the most lucrative Dermal Fillers markets throughout the forecast period. Some of the key factors supporting expansion are the region’s high disposable income, excellent spending capacity on cosmetic surgeries, and the presence of leading manufacturers, and rising demand for non-surgical procedures in the region.
According to preliminary forecasts by the Centers for Medicare & Medicaid Services (CMS) Office of the Actuary, the overall healthcare spending is likely to increase at 5.4% between 2019 and 2028, outpacing the country’s GDP by 4.3% in the United States.
About16.3 million people underwent minimally invasive cosmetic procedures in the United States in 2019 as per American Society of Plastic Surgeons (ASPS), which implies almost more than quarter of million more procedures in 2019 compared to 2018. While about 5.9 million reconstructive procedures.
High disposable income and favorable healthcare policies have created a conducive environment for the market in the U.S. Also the presence of leading players such as Zimmer Biomet Holdings supports growth in the U.S. Strategies undertaken by these companies include product launches and expansion plans, which will continue surging overall expansion in the U.S.
Why Brazil is Expected To Be The Second-Most Lucrative Country In Dermal Fillers Market?
The Brazil market is majorly driven by factors such as the increasing lifestyle-related demands, rising awareness about self-grooming, a high acquisition rate of minimally invasive procedures over traditional procedures, and technological advancements in the minimal invasive dermal fillers market.
According to the International Society of Aesthetic Plastic Surgery report, there were total 1,072,002, non-surgical procedures in Brazil, while the most commonly hyaluronic acid utilization was around 37%, Calcium Hydroxylapatite accounted for 2.8% of the total non-surgical procedure share in 2019.
Innovations Are Key to Succeed in Russia Dermal Fillers Market
Increasing demand for minimally invasive procedures, rising adoption of non-surgical dermal fillers, and commercialization of novel interventional solutions are major factors boosting the Russian dermal fillers market. The Russian market is set to exhibit steady growth over the forecast period. The rising ageing population and high adoption of Non hyaluronic acid-based dermal fillers are expected to boost the sales in the country.
Sales in Germany tied closely to New Product Launch and Expansion
New product launch and expansion of the distribution has been enabling growth in the Germany market. For instance, In April 2019, Merz added a new dermal product to its portfolio a “Belotero Revive” dermal filler formulated by the unique combination of hyaluronic acid and glycerol to provide skin solution and improve the skin hydration, reducing its redness and roughness and minimize the appearance of fine lines.
Why is Sale Increasing Rapidly in Malaysia?
Medical tourism in Malaysia has been thriving. As per the Malaysia Healthcare Travel Council, the country welcomed 921,000 foreign patients in 2016. Foreign patients from across the world, including Singapore, India, Europe, Japan, Australia, and the U.S. are coming to Malaysia seeking various medical help. Cosmetic surgeries are definitely among top-priority of a significant number of medical tourists to Malaysia.
Solid support from the government and formidable private ad public collaborations have been favoring the expansion of the dermal fillers market in the country. Besidea this, Malaysia has some of the best-in-class medical centers and hospitals, which has made it a highly sought-after destination for medical tourists. This has in turn presented lucrative opportunities for dermal filler sellers.
Category-wise Insights
Why do Absorbable Dermal Fillers hold the largest share?
This segment will continue accounting for more than 99% of the global share among products through the forecast period. According to FMI, the segment is expected to hold a little below 100% of the market, in terms of product type, by the end of 2031.
Absorbable is known as the temporary fillers used to treat moderate to severe facial wrinkles and skin folds, such as nasolabial folds (wrinkle lines extending from the sides of the nose to the lips border) and perioral lines (small wrinkles around the mouth and lips).
It is a highly demanded filler type owing to its biodegradable properties along with high water retention capacity with the maximum binding site offering better clinical outcomes and a high level of patient compliance.
Why is Aesthetic Restoration Highly Preferred in Dermal Fillers Market?
The aesthetic reconstructive application gained a high share in the market owing to the high adoption of dermal fillers in the aesthetic reconstructive surgeries owing to its long-term efficacy. Manufacturers are actively focusing on the advancement owing to its growing advancement in reconstructive surgery and the surge demand for dermal fillers in the market.
Why is Hyaluronic Acid-Based Dermal Fillers in High Demand?
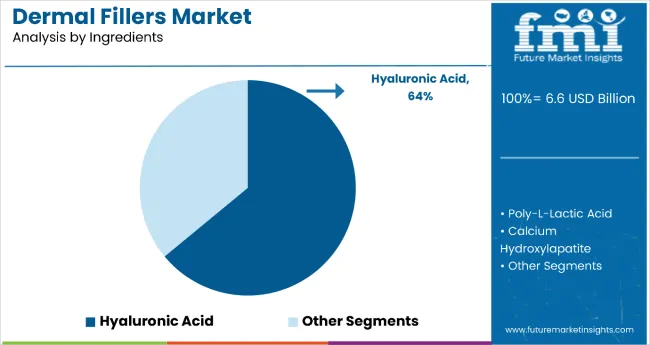
The cross-linked hyaluronic acid ingredient derived from non-animal sources has been proven to be one of the effective and useful dermal fillers owing to its biodegradable properties and safety profile. Hyaluronic acid demand is growing at a CAGR of 3.0% and it is expected to reach a value of US$ 4,774.1 Mn by the end of 2021.
Most Preferred Distribution Channel?
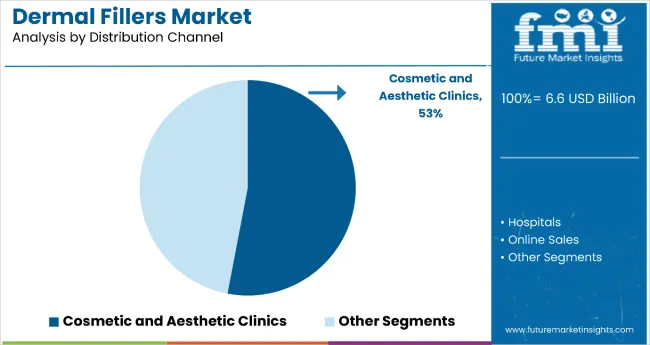
Clinics and hospital pharmacies are more preferred channels of distribution in the market. FMI has forecast the segment to continue accounting for over half of dermal filler sales recorded worldwide.

An unified Market Research Subscription Platform, built for today’s disparate research needs.
Competitive Landscape
Companies operating in the Dermal Fillers market are aiming at strategic collaborations and acquisitions with the leading pharmaceutical companies to address the requirements of an expanding patient pool.
For instance, in Jan 2019, Suneva Medical signed collaborative agreements with Healeon Medical and Bimini Technologies intending to shape the future of the regenerative aesthetics sector and expand the sales of aesthetic products. The company has built the success of Bellafill, the flagship brand, which was the first regenerative product and the longest-lasting dermal filler in the leading dermal fillers market.
Some of the companies are focusing on innovations and USFDA approvals to increase sales of dermal fillers market worldwide. For instance, U.S. FDA approved Galderma’s first hyaluronic acid filler Restylane® Kysse, used for various applications including upper perioral rhytids (wrinkles around upper lips) correction or lip augmentation.
Other than these strategies, key players are focusing on acquisitions and expansion of their global footprint as they await approvals from international organizations For instance, in May 2020, Anika Therapeutics acquired Parcus Medical, and Arthrosurface, a provider of the joint surface and preservation solutions for an active patient to hold its leading position in the aesthetic market, in Jan 2020.
Some of the leading companies operating in the Dermal Fillers market are:
- Galderma Pharma S.A
- Sinclair Pharma plc
- Zimmer Biomet Holdings
- Allergan plc.
- Anika Therapeutics Inc.
- Merz Pharma GmbH & Co. KGaA
- Suneva Medical Inc.
- Teoxane Laboratories Inc.
- Prollenium Medical Technologies Inc.
- Laboratoires Vivacy SAS
- Fidia Pharma USA Inc.
The list is not exhaustive, and only for representational purposes. Full competitive intelligence with SWOT analysis is available in the report.
Scope of the Report
Attribute |
Details |
Forecast Period |
2021-2031 |
Historical Data Available for |
2016-2020 |
Dermal Fillers Market Analysis |
USD Million for value and Units for Volume |
Key Regions Covered |
North America, Latin America, Europe, East Asia, South Asia, Oceania, Middle East & Africa |
Dermal Fillers Market - Key Countries Covered |
US, Canada, Germany, U.K., France, Italy, Spain, Russia, China, Japan, South Korea, India, Thailand, Malaysia, Indonesia, Australia, New Zealand, GCC Countries, Turkey, South Africa |
Key Segments Covered |
Product, Ingredient, Application, Distribution Channel, and Region |
Dermal Fillers Market - Key Companies Profiled |
|
Report Coverage |
Market Forecast, brand share analysis, competition intelligence, DROT analysis, Market Dynamics and Challenges, Strategic Growth Initiatives |
Customization & Pricing |
Key Segments
Product:
- Absorbable
- Non-Absorbable
Ingredient:
- Hyaluronic Acid
- Poly-L-Lactic Acid
- Calcium Hydroxylapatite
- Polymethyl methacrylate
- Collagen
Application:
- Aesthetic Restoration
- Dentistry
- Reconstructive Surgery
Distribution Channel:
- Retail Pharmacies and Drug Stores
- Clinics and Hospital Pharmacies
- Online Pharmacies
Region:
- North America
- Latin America
- Europe
- East Asia
- South Asia
- Oceania
- Middle East and Africa (MEA)
Frequently Asked Questions
North America currently leads the global Dermal Fillers market. Within North America, the U.S. will continue exhibiting high demand for the market.
Hyaluronic acid fillers are highly sought-after in every Dermal Fillers market. The demand for hyaluronic acid is expected to remain high in the near future, especially based on its safety profile and the biodegradable property.
Some of the leading companies offering respiratory inhaler devices are Galderma Pharma S.A, Sinclair Pharma plc, Zimmer Biomet Holdings, Allergan plc, Anika Therapeutics Inc., Merz Pharma GmbH & Co. KGaA, Suneva Medical Inc., Teoxane Laboratories Inc., Prollenium Medical Technologies Inc., Laboratoires Vivacy SAS, Fidia Pharma USA Inc., among others.
Clinics and hospital pharmacies has been exhibiting high demand for dermal fillers. The segment constitutes half of the total Dermal Fillers market revenue. Their dominance is owing to availability and supply of a comprehensive range of dermal fillers, which ensures clinics are fully prepared for all patient for cosmetic and aesthetic medicinal procedures.
Table of Content
1. Executive Summary
1.1. Global Market Outlook
1.2. Key Trends Impacting The Market
1.3. Analysis and Recommendations
2. Market Overview
2.1. Market Coverage / Taxonomy
2.2. Market Definition / Scope / Limitations
2.3. Inclusions and Exclusions
3. Key Market Trends
3.1. Demand Side Trends
3.2. Supply Side Trends
3.3. Product Development Trends
4. Market Context
4.1. Product Adoption / Usage Analysis
4.2. Product USPs/ Features
4.3. Regulatory Scenario
4.4. Strategic Promotional Strategies by Manufacturer
5. Market Background
5.1. Macro-Economic Factors
5.1.1. Global GDP Growth Outlook
5.1.2. Global Healthcare Expenditure Outlook
5.1.3. Growth of Healthcare Sector in Emerging Nations
5.2. Forecast Factors - Relevance & Impact
5.2.1. Global Increase in Healthcare Expenditure
5.2.2. Corporate Investments are Helping Advance R&D
5.2.3. Increasing aesthetic problems
5.2.4. Rising awareness about minimally invasive cosmetic procedures
5.2.5. Changing Regulatory Dynamics
5.2.6. Reimbursement Scenario
5.2.7. High cost of the procedure
5.2.8. Increasing side effects
5.3. Market Dynamics
5.3.1. Drivers
5.3.2. Restraints
5.3.3. Opportunity Analysis
6. COVID19 Crisis Impact Analysis
6.1. Current COVID19 Statistics and Probable Future Impact
6.2. Current GDP Projection and Probable Impact
6.3. Current Economic Projection as compared to 2008 financial analysis
6.4. Dermal Fillers Market Revenue Impact Analysis
6.4.1. Historical (pre-COVID), Current (during-COVID), Future (post-COVID)
6.4.1.1. By Product Type
6.4.1.2. By Ingredient
6.4.1.3. By Application
6.4.1.4. By Distribution Channel
6.4.1.5. By Region
6.4.2. 2020 Market Scenario
6.4.3. Quarter by Quarter Forecast
6.4.4. Projected Recovery Year
6.5. Impact on Trends Analysis
6.6. Recovery Scenario – Short term, Midterm and Long Term Impact
7. Global Dermal Fillers Market Volume (‘000’ Units) Analysis 2016-2020 and Forecast, 2021-2031
7.1. Historical Market Volume (‘000’ Units) Analysis, 2016-2020
7.2. Current and Future Market Volume (‘000’ Units) Projections, 2021-2031
7.2.1. Y-o-Y Growth Trend Analysis
8. Global Dermal Fillers Market - Pricing Analysis
8.1. Regional Pricing Analysis By Region
8.2. Pricing Break-up
8.2.1. Manufacturer Level Pricing
8.2.2. Distributor Level Pricing
8.3. Global Average Pricing Analysis Benchmark
9. Global Dermal Fillers Market Demand Value (or Size in US$ Mn) Analysis 2016-2020 and Forecast, 2021-2031
9.1. Historical Market Value (US$ Mn) Analysis, 2016-2020
9.2. Current and Future Market Value (US$ Mn) Projections, 2021-2031
9.2.1. Y-o-Y Growth Trend Analysis
9.2.2. Absolute $ Opportunity Analysis
10. Global Dermal Fillers Market Analysis 2016-2020 and Forecast 2021-2031, By Product Type
10.1. Introduction / Key Findings
10.2. Historical Market Size (US$ Mn) Analysis By Dermal Fillers Market By Product Type, 2016 - 2020
10.3. Current and Future Market Size (US$ Mn) Analysis By Product Type, 2021-2031
10.3.1. Absorbable
10.3.2. Non-Absorbable
10.4. Market Attractiveness Analysis By Dermal Fillers Market, By Product Type
11. Global Dermal Fillers Market Analysis 2016-2020 and Forecast 2021-2031, By Ingredient
11.1. Introduction / Key Findings
11.2. Historical Market Size (US$ Mn) and Volume (Units) Analysis, By Ingredient, 2016 - 2020
11.3. Current and Future Market Size (US$ Mn) and Volume (Units) Analysis Forecast By Ingredient, 2021 - 2031
11.3.1. Hyaluronic Acid
11.3.2. Poly-L-Lactic Acid
11.3.3. Calcium Hydroxylapatite
11.3.4. Polymethyl methacrylate
11.3.5. Collagen
11.4. Market Attractiveness Analysis By Ingredients
12. Global Dermal Fillers Market Analysis 2016-2020 and Forecast 2021-2031, By Application
12.1. Introduction / Key Findings
12.2. Historical Market Size (US$ Mn) Analysis By Application, 2016 - 2020
12.3. Current and Future Market Size (US$ Mn) Analysis and Forecast By Application, 2021 - 2031
12.3.1. Aesthetic Restoration
12.3.2. Dentistry
12.3.3. Reconstructive Surgery
12.4. Market Attractiveness Analysis By Application
13. Global Dermal Fillers Market Analysis 2016-2020 and Forecast 2021-2031, By Distribution Channel
13.1. Introduction / Key Findings
13.2. Historical Market Size (US$ Mn) Analysis By Distribution Channel, 2016 - 2020
13.3. Current and Future Market Size (US$ Mn) Analysis and Forecast By Distribution Channel, 2021 – 2031
13.3.1. Retail Pharmacies and Drug Stores
13.3.2. Clinics and Hospital Pharmacies
13.3.3. Online Pharmacies
13.4. Market Attractiveness Analysis By Distribution Channel
14. Global Dermal Fillers Market Analysis 2016-2020 and Forecast 2021-2031, By Region
14.1. Introduction
14.2. Historical Market Size (US$ Mn) and Volume (Units) Analysis By Region, 2016 - 2020
14.3. Current Market Size (US$ Mn) and Volume (Units) Analysis Forecast By Region, 2021 – 2031
14.3.1. North America
14.3.2. Latin America
14.3.3. Europe
14.3.4. East Asia
14.3.5. South Asia
14.3.6. Oceania
14.3.7. Middle East and Africa (MEA)
14.4. Market Attractiveness Analysis By Region
15. North America Dermal Fillers Market Analysis 2016-2020 and Forecast 2021-2031
15.1. Introduction
15.2. Historical Market Size (US$ Mn) and Volume (Units) Analysis By Market Taxonomy, 2016 - 2020
15.3. Current Market Size (US$ Mn) and Volume (Units) Analysis Forecast By Market Taxonomy, 2021 – 2031
15.3.1. By Country
15.3.1.1. U.S.
15.3.1.2. Canada
15.3.2. By Product Type
15.3.3. By Application
15.3.4. By Ingredient
15.3.5. By Distribution Channel
15.4. Market Attractiveness Analysis
15.5. Key Market Participants - Intensity Mapping
15.6. Drivers and Restraints - Impact Analysis
16. Latin America Dermal Fillers Market Analysis 2016-2020 and Forecast 2021-2031
16.1. Introduction
16.2. Historical Market Size (US$ Mn) and Volume (Units) Analysis By Market Taxonomy, 2016 - 2020
16.3. Current Market Size (US$ Mn) and and Volume (Units) Analysis Forecast By Market Taxonomy, 2021 – 2031
16.3.1. By Country
16.3.1.1. Brazil
16.3.1.2. Mexico
16.3.1.3. Argentina
16.3.1.4. Rest of Latin America
16.3.2. By Product Type
16.3.3. By Application
16.3.4. By Ingredient
16.3.5. By Distribution Channel
16.4. Market Attractiveness Analysis
16.5. Key Market Participants - Intensity Mapping
16.6. Drivers and Restraints - Impact Analysis
17. Europe Dermal Fillers Market Analysis 2016-2020 and Forecast 2021-2031
17.1. Introduction
17.2. Historical Market Size (US$ Mn) and Volume (Units) Analysis By Market Taxonomy, 2016 - 2020
17.3. Current Market Size (US$ Mn) and Volume (Units) Analysis Forecast By Market Taxonomy, 2021 – 2031
17.3.1. By Country
17.3.1.1. Germany
17.3.1.2. Italy
17.3.1.3. France
17.3.1.4. U.K.
17.3.1.5. Spain
17.3.1.6. BENELUX
17.3.1.7. Russia
17.3.1.8. Rest of Europe
17.3.2. By Product Type
17.3.3. By Application
17.3.4. By Ingredient
17.3.5. By Distribution Channel
17.4. Market Attractiveness Analysis
17.5. Key Market Participants - Intensity Mapping
17.6. Drivers and Restraints - Impact Analysis
18. East Asia Dermal Fillers Market Analysis 2016-2020 and Forecast 2021-2031
18.1. Introduction
18.2. Historical Market Size (US$ Mn) and Volume (Units) Analysis By Market Taxonomy, 2016 - 2020
18.3. Current Market Size (US$ Mn) and Volume (Units) Analysis Forecast By Market Taxonomy, 2021 – 2031
18.3.1. By Country
18.3.1.1. China
18.3.1.2. Japan
18.3.1.3. South Korea
18.3.2. By Product Type
18.3.3. By Application
18.3.4. By Ingredient
18.3.5. By Distribution Channel
18.4. Market Attractiveness Analysis
18.5. Key Market Participants - Intensity Mapping
18.6. Drivers and Restraints - Impact Analysis
19. South Asia Dermal Fillers Market Analysis 2016-2020 and Forecast 2021-2031
19.1. Introduction
19.2. Historical Market Size (US$ Mn) and Volume (Units) Analysis By Market Taxonomy, 2016 - 2020
19.3. Current Market Size (US$ Mn) and Volume (Units) Analysis Forecast By Market Taxonomy, 2021 – 2031
19.3.1. By Country
19.3.1.1. India
19.3.1.2. Thailand
19.3.1.3. Indonesia
19.3.1.4. Malaysia
19.3.1.5. Rest of South Asia
19.3.2. By Product Type
19.3.3. By Application
19.3.4. By Ingredient
19.3.5. By Distribution Channel
19.4. Market Attractiveness Analysis
19.5. Key Market Participants - Intensity Mapping
19.6. Drivers and Restraints - Impact Analysis
20. Oceania Dermal Fillers Market Analysis 2016-2020 and Forecast 2021-2031
20.1. Introduction
20.2. Historical Market Size (US$ Mn) and Volume (Units) Analysis By Market Taxonomy, 2016 - 2020
20.3. Current Market Size (US$ Mn) and Volume (Units) Analysis Forecast By Market Taxonomy, 2021 – 2031
20.3.1. By Country
20.3.1.1. Australia
20.3.1.2. New Zealand
20.3.2. By Product Type
20.3.3. By Application
20.3.4. By Ingredient
20.3.5. By Distribution Channel
20.4. Market Attractiveness Analysis
20.5. Key Market Participants - Intensity Mapping
20.6. Drivers and Restraints - Impact Analysis
21. Middle East and Africa Dermal Fillers Market Analysis 2016-2020 and Forecast 2021-2031
21.1. Introduction
21.2. Historical Market Size (US$ Mn) and Volume (Units) Analysis By Market Taxonomy, 2016 - 2020
21.3. Current Market Size (US$ Mn) and Volume (Units) Analysis Forecast By Market Taxonomy, 2021 – 2031
21.3.1. By Country
21.3.1.1. GCC Countries
21.3.1.2. South Africa
21.3.1.3. Rest of Middle East and Africa
21.3.2. By Product Type
21.3.3. By Application
21.3.4. By Ingredient
21.3.5. By Distribution Channel
21.4. Market Attractiveness Analysis
21.5. Key Market Participants - Intensity Mapping
21.6. Drivers and Restraints - Impact Analysis
22. Key and Emerging Countries Dermal Fillers Market Analysis 2016-2020 and Forecast 2021-2031
22.1. Introduction
22.1.1. Market Value Proportion Analysis, By Key Countries
22.1.2. Global Vs. Country Growth Comparison
22.2. U.S. Dermal Fillers Market Analysis
22.2.1. By Product Type
22.2.2. By Application
22.2.3. By Ingredient
22.2.4. By Distribution Channel
22.3. Canada Dermal Fillers Market Analysis
22.3.1. By Product Type
22.3.2. By Application
22.3.3. By Ingredient
22.3.4. By Distribution Channel
22.4. Brazil Dermal Fillers Market Analysis
22.4.1. By Product Type
22.4.2. By Application
22.4.3. By Ingredient
22.4.4. By Distribution Channel
22.5. Mexico Dermal Fillers Market Analysis
22.5.1. By Product Type
22.5.2. By Application
22.5.3. By Ingredient
22.5.4. By Distribution Channel
22.6. Argentina Dermal Fillers Market Analysis
22.6.1. By Product Type
22.6.2. By Application
22.6.3. By Ingredient
22.6.4. By Distribution Channel
22.7. U.K. Dermal Fillers Market Analysis
22.7.1. By Product Type
22.7.2. By Application
22.7.3. By Ingredient
22.7.4. By Distribution Channel
22.8. Germany Dermal Fillers Market Analysis
22.8.1. By Product Type
22.8.2. By Application
22.8.3. By Ingredient
22.8.4. By Distribution Channel
22.9. France Dermal Fillers Market Analysis
22.9.1. By Product Type
22.9.2. By Application
22.9.3. By Ingredient
22.9.4. By Distribution Channel
22.10. Italy Dermal Fillers Market Analysis
22.10.1. By Product Type
22.10.2. By Application
22.10.3. By Ingredient
22.10.4. By Distribution Channel
22.11. Spain Dermal Fillers Market Analysis
22.11.1. By Product Type
22.11.2. By Application
22.11.3. By Ingredient
22.11.4. By Distribution Channel
22.12. Russia Dermal Fillers Market Analysis
22.12.1. By Product Type
22.12.2. By Application
22.12.3. By Ingredient
22.12.4. By Distribution Channel
22.13. BENELUX Dermal Fillers Market Analysis
22.13.1. By Product Type
22.13.2. By Application
22.13.3. By Ingredient
22.13.4. By Distribution Channel
22.14. China Dermal Fillers Market Analysis
22.14.1. By Product Type
22.14.2. By Application
22.14.3. By Ingredient
22.14.4. By Distribution Channel
22.15. Japan Dermal Fillers Market Analysis
22.15.1. By Product Type
22.15.2. By Application
22.15.3. By Ingredient
22.15.4. By Distribution Channel
22.16. South Korea Dermal Fillers Market Analysis
22.16.1. By Product Type
22.16.2. By Application
22.16.3. By Ingredient
22.16.4. By Distribution Channel
22.17. India Dermal Fillers Market Analysis
22.17.1. By Product Type
22.17.2. By Application
22.17.3. By Ingredient
22.17.4. By Distribution Channel
22.18. Thailand Dermal Fillers Market Analysis
22.18.1. By Product Type
22.18.2. By Application
22.18.3. By Ingredient
22.18.4. By Distribution Channel
22.19. Indonesia Dermal Fillers Market Analysis
22.19.1. By Product Type
22.19.2. By Application
22.19.3. By Ingredient
22.19.4. By Distribution Channel
22.20. Malaysia Dermal Fillers Market Analysis
22.20.1. By Product Type
22.20.2. By Application
22.20.3. By Ingredient
22.20.4. By Distribution Channel
22.21. Australia Dermal Fillers Market Analysis
22.21.1. By Product Type
22.21.2. By Application
22.21.3. By Ingredient
22.21.4. By Distribution Channel
22.22. New Zealand Dermal Fillers Market Analysis
22.22.1. By Product Type
22.22.2. By Application
22.22.3. By Ingredient
22.22.4. By Distribution Channel
22.23. GCC Countries Dermal Fillers Market Analysis
22.23.1. By Product Type
22.23.2. By Application
22.23.3. By Ingredient
22.23.4. By Distribution Channel
22.24. Turkey Dermal Fillers Market Analysis
22.24.1. By Product Type
22.24.2. By Application
22.24.3. By Ingredient
22.24.4. By Distribution Channel
22.25. South Africa Dermal Fillers Market Analysis
22.25.1. By Product Type
22.25.2. By Application
22.25.3. By Ingredient
22.25.4. By Distribution Channel
23. Market Structure Analysis
23.1. Market Analysis by Tier of Companies
23.2. Market Concentration
23.3. Market Share Analysis of Top Players
23.4. Market Presence Analysis
23.4.1. By Regional Footprint of Players
23.4.2. Product Footprint by Players
23.4.3. Channel Footprint by Players
24. Competition Analysis
24.1. Competition Dashboard
24.2. Competition Deep Dive (Tentative List)
24.2.1. Galderma Pharma S.A
24.2.1.1. Company Overview
24.2.1.2. Product Portfolio
24.2.1.3. Sales Footprint
24.2.1.4. Strategic overview
24.2.2. Sinclair Pharma plc
24.2.2.1. Company Overview
24.2.2.2. Product Portfolio
24.2.2.3. Sales Footprint
24.2.2.4. Strategic overview
24.2.3. Zimmer Biomet Holdings
24.2.3.1. Company Overview
24.2.3.2. Product Portfolio
24.2.3.3. Sales Footprint
24.2.3.4. Strategic overview
24.2.4. Allergan plc.
24.2.4.1. Company Overview
24.2.4.2. Product Portfolio
24.2.4.3. Sales Footprint
24.2.4.4. Strategic overview
24.2.5. Anika Therapeutics Inc.
24.2.5.1. Company Overview
24.2.5.2. Product Portfolio
24.2.5.3. Sales Footprint
24.2.5.4. Strategic overview
24.2.6. Merz Pharma GmbH & Co. KGaA
24.2.6.1. Company Overview
24.2.6.2. Product Portfolio
24.2.6.3. Sales Footprint
24.2.6.4. Strategic overview
24.2.7. Suneva Medical Inc.
24.2.7.1. Company Overview
24.2.7.2. Product Portfolio
24.2.7.3. Sales Footprint
24.2.7.4. Strategic overview
24.2.8. Teoxane Laboratories Inc.
24.2.8.1. Company Overview
24.2.8.2. Product Portfolio
24.2.8.3. Sales Footprint
24.2.8.4. Strategic overview
24.2.9. Prollenium Medical Technologies Inc.
24.2.9.1. Company Overview
24.2.9.2. Product Portfolio
24.2.9.3. Sales Footprint
24.2.9.4. Strategic overview
24.2.10. Laboratoires Vivacy SAS
24.2.10.1. Company Overview
24.2.10.2. Product Portfolio
24.2.10.3. Sales Footprint
24.2.10.4. Strategic overview
24.2.11. Fidia Pharma USA Inc.
24.2.11.1. Company Overview
24.2.11.2. Product Portfolio
24.2.11.3. Sales Footprint
24.2.11.4. Strategic overview
25. Assumptions and Acronyms Used
26. Research Methodology
Let us know your requirement to get
100% FREE customization
List of Tables
Table 01: COVID-19 Region-wise Analysis
Table 02: Global Dermal Fillers Market Value (US$ Mn) Analysis and Opportunity Assessment 2016–2031, By Product Type
Table 03: Global Dermal Fillers Market Value (US$ Mn) Analysis and Opportunity Assessment 2016–2031, By Ingredient
Table 04: Global Dermal Fillers Market Volume (‘000’ units) Analysis and Forecast, By Ingredient (2016-2031)
Table 05: Global Dermal Fillers Market Value (US$ Mn) Analysis and Opportunity Assessment 2016–2031, By Application
Table 06: Global Dermal Fillers Market Value (US$ Mn) Analysis- and Opportunity Assessment 2016–2031, By Distribution Channel
Table 07: Global Dermal Fillers Market Value (US$ Mn) Analysis and Opportunity Assessment 2016–2031, By Region
Table 08: Global Dermal Fillers Market Volume (‘000 units) Analysis and Forecast, By Region (2016-2031)
Table 09: North America Dermal Fillers Market Value (US$ Mn) Analysis 2016-2020 and Forecast 2021–2031, By Product Type
Table 10: North America Dermal Fillers Market Value (US$ Mn) Analysis and Opportunity Assessment 2016–2031, By Ingredient
Table 11: North America Dermal Fillers Market Volume ('000 units) Analysis and Forecast, By Ingredient (2016-2031)
Table 12: North America Dermal Fillers Market Value (US$ Mn) Analysis 2016-2020 and Forecast 2021–2031, By Application
Table 13: North America Dermal Fillers Market Value (US$ Mn) Analysis 2016-2020 and Forecast 2021–2031, By Distribution Channel
Table 14: North America Dermal Fillers Market Value (US$ Mn) Analysis 2016-2020 and Forecast 2021–2031, By Country
Table 15: Latin America Dermal Fillers Market Value (US$ Mn) Analysis 2016-2020 and Forecast 2021–2031, By Product Type
Table 16: Latin America Dermal Fillers Market Value (US$ Mn) Analysis and Opportunity Assessment 2016–2031, By Ingredient
Table 17: Latin America Dermal Fillers Market Volume ('000 units) Analysis and Forecast, By Ingredient (2016-2031)
Table 18: Latin America Dermal Fillers Market Value (US$ Mn) Analysis 2016-2020 and Forecast 2021–2031, By Application
Table 19: Latin America Dermal Fillers Market Value (US$ Mn) Analysis 2016-2020 and Forecast 2021–2031, By Distribution Channel
Table 20: Latin America Dermal Fillers Market Value (US$ Mn) Analysis 2016-2020 and Forecast 2021–2031, By Country
Table 21: Europe Dermal Fillers Market Value (US$ Mn) Analysis 2016-2020 and Forecast 2021–2031, By Product Type
Table 22: Europe Dermal Fillers Market Value (US$ Mn) Analysis and Opportunity Assessment 2016–2031, By Ingredient
Table 23: Europe Dermal Fillers Market Volume ('000 units) Analysis and Forecast, By Ingredient (2016-2031)
Table 24: Europe Dermal Fillers Market Value (US$ Mn) Analysis 2016-2020 and Forecast 2021–2031, By Application
Table 25: Europe Dermal Fillers Market Value (US$ Mn) Analysis 2016-2020 and Forecast 2021–2031, By Distribution Channel
Table 26: Europe Dermal Fillers Market Value (US$ Mn) Analysis 2016-2020 and Forecast 2021–2031, By Country
Table 27: East Asia Dermal Fillers Market Value (US$ Mn) Analysis 2016-2020 and Forecast 2021–2031, By Product Type
Table 28: East Asia Dermal Fillers Market Value (US$ Mn) Analysis and Opportunity Assessment 2016–2031, By Ingredient
Table 29: East Asia Dermal Fillers Market Volume ('000 units) Analysis and Forecast, By Ingredient (2016-2031)
Table 30: East Asia Dermal Fillers Market Value (US$ Mn) Analysis 2016-2020 and Forecast 2021–2031, By Application
Table 31: East Asia Dermal Fillers Market Value (US$ Mn) Analysis 2016-2020 and Forecast 2021–2031, By Distribution Channel
Table 32: East Asia Dermal Fillers Market Value (US$ Mn) Analysis 2016-2020 and Forecast 2021–2031, By Country
Table 33: South Asia Dermal Fillers Market Value (US$ Mn) Analysis 2016-2020 and Forecast 2021–2031, By Product Type
Table 34: South Asia Dermal Fillers Market Value (US$ Mn) Analysis and Opportunity Assessment 2016–2031, By Ingredient
Table 35: South Asia Dermal Fillers Market Volume ('000 units) Analysis and Forecast, By Ingredient (2016-2031)
Table 36: South Asia Dermal Fillers Market Value (US$ Mn) Analysis 2016-2020 and Forecast 2021–2031, By Application
Table 37: South Asia Dermal Fillers Market Value (US$ Mn) Analysis 2016-2020 and Forecast 2021–2031, By Distribution Channel
Table 38: Oceania Dermal Fillers Market Value (US$ Mn) Analysis 2016-2020 and Forecast 2021–2031, By Product Type
Table 39: Oceania Dermal Fillers Market Value (US$ Mn) Analysis and Opportunity Assessment 2016–2031, By Ingredient
Table 40: Oceania Dermal Fillers Market Volume ('000 units) Analysis and Forecast, By Ingredient (2016-2031)
Table 41: Oceania Dermal Fillers Market Value (US$ Mn) Analysis 2016-2020 and Forecast 2021–2031, By Application
Table 42: Oceania Dermal Fillers Market Value (US$ Mn) Analysis 2016-2020 and Forecast 2021–2031, By Distribution Channel
Table 43: Middle East & Africa Dermal Fillers Market Value (US$ Mn) Analysis 2016-2020 and Forecast 2021–2031, By Product Type
Table 44: Middle East & Africa Dermal Fillers Market Value (US$ Mn) Analysis and Opportunity Assessment 2016–2031, By Ingredient
Table 45: Middle East and Africa Dermal Fillers Market Volume ('000 units) Analysis and Forecast, By Ingredient (2016-2031)
Table 46: Middle East & Africa Dermal Fillers Market Value (US$ Mn) Analysis 2016-2020 and Forecast 2021–2031, By Application
Table 47: Middle East & Africa Dermal Fillers Market Value (US$ Mn) Analysis 2016-2020 and Forecast 2021–2031, By Distribution Channel
Table 48: Middle East & Africa Dermal Fillers Market Value (US$ Mn) Analysis 2016-2020 and Forecast 2021–2031, By Country
Find your sweet spots for generating winning opportunities in this market.
Talk to AnalystList of Charts
Figure 01: Global Dermal Fillers Market Volume ('000 units) Analysis, 2016-2020
Figure 02: Global Dermal Fillers Market Volume Forecast ('000 units), 2021& 2031
Figure 03: Hyaluronic Acid-based Dermal Filler Price Difference for Aesthetic Restoration (US$) for 1 mL Syringe, By Region, 2020
Figure 04: Hyaluronic Acid-based Dermal Filler Price Difference for Aesthetic Restoration (US$) for 1 mL Syringe, By Region, 2031
Figure 05: Calcium Hydroxylapatite-based Dermal Filler Price Difference (US$) for 1 mL Syringe, By Region, 2020
Figure 06: Calcium Hydroxylapatite-based Dermal Filler Price Difference (US$) for 1 mL Syringe, By Region, 2031
Figure 07: PLLA-based Dermal Filler Price Difference (US$) for 1 mL Syringe, By Region, 2020
Figure 08: PLLA-based Dermal Filler Price Difference (US$) for 1 mL Syringe, By Region, 2031
Figure 09: PMMA-based Dermal Filler Price Difference (US$) for 1 mL Syringe, By Region, 2020
Figure 10: PMMA-based Dermal Filler Price Difference (US$) for 1 mL Syringe, By Region, 2031
Figure 11: Collagen-based Dermal Filler Price Difference (US$) for 1 mL Syringe, By Region, 2020
Figure 12: Collagen-based Dermal Filler Price Difference (US$) for 1 mL Syringe, By Region, 2031
Figure 13: Global Dermal Fillers Market Value Analysis (US$ Mn), 2016-2020
Figure 14: Global Dermal Fillers Market Value Forecast (US$ Mn), 2021 - 2031
Figure 15: Global Dermal Fillers Market Absolute $ Opportunity, 2021 - 2031
Figure 16: Global Dermal Fillers Market Share Analysis (%), By Product Type, 2021& 2031
Figure 17: Global Dermal Fillers Market Y-o-Y Analysis (%), By Product Type, 2021& 2031
Figure 18: Global Dermal Fillers Market Attractiveness Analysis by Product Type, 2021& 2031
Figure 19: Global Dermal Fillers Market Share Analysis (%), By Ingredient, 2021& 2031
Figure 20: Global Dermal Fillers Market Y-o-Y Analysis (%), By Ingredient, 2021 - 2031
Figure 21: Global Dermal Fillers Market Attractiveness Analysis by Ingredient, 2021& 2031
Figure 22: Global Dermal Fillers Market Share Analysis (%), By Application, 2021& 2031
Figure 23: Global Dermal Fillers Market Y-o-Y Analysis (%), By Application, 2021& 2031
Figure 24: Global Dermal Fillers Market Attractiveness Analysis by Application, 2021& 2031
Figure 25: Global Dermal Fillers Market Share Analysis (%), By Distribution Channel, 2021& 2031
Figure 26: Global Dermal Fillers Market Y-o-Y Analysis (%), By Distribution Channel, 2021& 2031
Figure 27: Global Dermal Fillers Market Attractiveness Analysis by Distribution Channel, 2021-2031
Figure 28: Global Dermal Fillers Market Share Analysis (%), By Country, 2021& 2031
Figure 29: Global Dermal Fillers Market Y-o-Y Analysis (%), By Country, 2021& 2031
Figure 30: Global Dermal Fillers Market Attractiveness Analysis by Country, 2021- 2031
Figure 31: North America Dermal Fillers Market Value Share By Product Type (2021)
Figure 32: North America Dermal Fillers Market Value Share By Ingredient (2021)
Figure 33: North America Dermal Fillers Market Value Share By Application 2021 (E)
Figure 34: North America Dermal Fillers Market Value Share By Distribution Channel 2021 (E)
Figure 35: North America Dermal Fillers Market Value Share By Country 2021 (E)
Figure 36: North America Dermal Fillers Market Value Analysis (US$ Mn), 2016-2020
Figure 37: North America Dermal Fillers Market Value Forecast (US$ Mn), 2021- 2031
Figure 38: North America Dermal Fillers Market Attractiveness Analysis by Product Type, 2021- 2031
Figure 39: North America Dermal Fillers Market Attractiveness Analysis by Ingredient, 2021 - 2031
Figure 40: North America Dermal Fillers Market Attractiveness Analysis by Application, 2021 -2031
Figure 41: North America Dermal Fillers Market Attractiveness Analysis by Distribution Channel, 2021 - 2031
Figure 42: North America Dermal Fillers Market Attractiveness Analysis by Country, 2021 - 2031
Figure 43: Latin America Dermal Fillers Market Value Share By Product Type 2021 (E)
Figure 44: Latin America Dermal Fillers Market Value Share By Ingredient 2021 (E)
Figure 45: Latin America Dermal Fillers Market Value Share By Application 2021 (E)
Figure 46: Latin America Dermal Fillers Market Value Share By Distribution Channel 2021 (E)
Figure 47: Latin America Dermal Fillers Market Value Share By Country 2021 (E)
Figure 48: Latin America Dermal Fillers Market Value Analysis (US$ Mn), 2016-2020
Figure 49: Latin America Dermal Fillers Market Value Forecast (US$ Mn), 2021& 2031
Figure 50: Latin America Dermal Fillers Market Attractiveness Analysis by Product Type, 2021 - 2031
Figure 51: Latin America Dermal Fillers Market Attractiveness Analysis by Ingredient, 2021 - 2031
Figure 52: Latin America Dermal Fillers Market Attractiveness Analysis by Application, 2021 - 2031
Figure 53: Latin America Dermal Fillers Market Attractiveness Analysis by Distribution Channel, 2021 - 2031
Figure 54: Latin America Dermal Fillers Market Attractiveness Analysis by Country, 2021 - 2031
Figure 55: Europe Dermal Fillers Market Value Share By Product Type 2021 (E)
Figure 56: Europe Dermal Fillers Market Value Share By Ingredient 2021 (E)
Figure 57: Europe Dermal Fillers Market Value Share By Application 2021 (E)
Figure 58: Europe Dermal Fillers Market Value Share By Distribution Channel 2021 (E)
Figure 59: Europe Dermal Fillers Market Value Share By Country 2021 (E)
Figure 60: Europe Dermal Fillers Market Value Analysis (US$ Mn), 2016-2020
Figure 61: Europe Dermal Fillers Market Value Forecast (US$ Mn), 2021& 2031
Figure 62: Europe Dermal Fillers Market Attractiveness Analysis by Product Type, 2021 - 2031
Figure 63: Europe Dermal Fillers Market Attractiveness Analysis by Ingredient, 2021 - 2031
Figure 64: Europe Dermal Fillers Market Attractiveness Analysis by Application, 2021 - 2031
Figure 65: Europe Dermal Fillers Market Attractiveness Analysis by Distribution Channel, 2021 - 2031
Figure 66: Europe Dermal Fillers Market Attractiveness Analysis by Country, 2021 - 2031
Figure 67: East Asia Dermal Fillers Market Value Share By Product Type 2021 (E)
Figure 68: East Asia Dermal Fillers Market Value Share By Ingredient 2021 (E)
Figure 69: East Asia Dermal Fillers Market Value Share By Application 2021 (E)
Figure 70: East Asia Dermal Fillers Market Value Share By Distribution Channel 2021 (E)
Figure 71: East Asia Dermal Fillers Market Value Share By Country 2021 (E)
Figure 72: East Asia Dermal Fillers Market Value Analysis (US$ Mn), 2016-2020
Figure 73: East Asia Dermal Fillers Market Value Forecast (US$ Mn), 2021 -2031
Figure 74: East Asia Dermal Fillers Market Attractiveness Analysis by Product Type, 2021-2031
Figure 75: East Asia Dermal Fillers Market Attractiveness Analysis by Ingredient, 2021-2031
Figure 76: East Asia Dermal Fillers Market Attractiveness Analysis by Application, 2021-2031
Figure 77: East Asia Dermal Fillers Market Attractiveness Analysis by Distribution Channel, 2021-2031
Figure 78: East Asia Dermal Fillers Market Attractiveness Analysis by Country, 2021-2031
Figure 79: South Asia Dermal Fillers Market Value Share By Product Type 2021 (E)
Figure 80: South Asia Dermal Fillers Market Value Share By Ingredient 2021 (E)
Figure 81: South Asia Dermal Fillers Market Value Share By Application 2021 (E)
Figure 82: South Asia Dermal Fillers Market Value Share By Distribution Channel 2021 (E)
Figure 83: South Asia Dermal Fillers Market Value (US$ Mn) & Forecast 2021& 2031
Figure 84: South Asia Dermal Fillers Market Value Analysis (US$ Mn), 2016-2020
Figure 85: South Asia Dermal Fillers Market Value Forecast (US$ Mn), 2021& 2031
Figure 86: South Asia Dermal Fillers Market Attractiveness Analysis by Product Type, 2021& 2031
Figure 87: South Asia Dermal Fillers Market Attractiveness Analysis by Ingredient, 2021& 2031
Figure 88: South Asia Dermal Fillers Market Attractiveness Analysis by Application, 2021-2031
Figure 89: South Asia Dermal Fillers Market Attractiveness Analysis by Distribution Channel, 2021-2031
Figure 90: South Asia Dermal Fillers Market Value Share By Product Type 2021 (E)
Figure 91: Oceania Dermal Fillers Market Value Share By Ingredient 2021 (E)
Figure 92: Oceania Dermal Fillers Market Value Share By Application 2021 (E)
Figure 93: Oceania Dermal Fillers Market Value Share By Distribution Channel 2021 (E)
Figure 94: Oceania Dermal Fillers Market Value (US$ Mn) & Forecast 2021& 2031
Figure 95: Oceania Dermal Fillers Market Value Analysis (US$ Mn), 2016-2020
Figure 96: Oceania Dermal Fillers Market Value Forecast (US$ Mn), 2021& 2031
Figure 97: Oceania Dermal Fillers Market Attractiveness Analysis by Product Type, 2021& 2031
Figure 98: Oceania Dermal Fillers Market Attractiveness Analysis by Ingredient, 2021& 2031
Figure 99: Oceania Dermal Fillers Market Attractiveness Analysis by Application, 2021-2031
Figure 100: Oceania Dermal Fillers Market Attractiveness Analysis by Distribution Channel, 2021-2031
Figure 101: Middle East & Africa Dermal Fillers Market Value Share By Product Type 2021 (E)
Figure 102: Middle East & Africa Dermal Fillers Market Value Share By Ingredient 2021 (E)
Figure 103: Middle East & Africa Dermal Fillers Market Value Share By Application 2021 (E)
Figure 104: Middle East & Africa Dermal Fillers Market Value Share By Distribution Channel 2021 (E)
Figure 105: Middle East & Africa Dermal Fillers Market Value Share By Country 2021 (E)
Figure 106: Middle East & Africa Dermal Fillers Market Value Analysis (US$ Mn), 2016-2020
Figure 107: Middle East & Africa Dermal Fillers Market Value Forecast (US$ Mn), 2021& 2031
Figure 108: Middle East & Africa Dermal Fillers Market Attractiveness Analysis by Product Type, 2021- 2031
Figure 109: Middle East & Africa Dermal Fillers Market Attractiveness Analysis by Ingredient, 2021 - 2031
Figure 110: Middle East & Africa Dermal Fillers Market Attractiveness Analysis by Distribution Channel, 2021-2031
Figure 111: Middle East & Africa Dermal Fillers Market Attractiveness Analysis by Country, 2021-2031
Figure 112: U.S. Dermal Fillers Market Share Analysis (%), by Product Type, 2020 & 2031
Figure 113: U.S. Dermal Fillers Market Share Analysis (%), by Application, 2020 & 2031
Figure 114: U.S. Dermal Fillers Market Share Analysis (%), by Ingredient, 2020 & 2031
Figure 115: U.S. Dermal Fillers Market Share Analysis (%), by Distribution Channel, 2020 & 2031
Figure 116: U.S. Dermal Fillers Market Value Analysis (US$ Mn), 2020 & 2031
Figure 117: Canada Dermal Fillers Market Share Analysis (%), by Product Type, 2020 & 2031
Figure 118: U.S. Dermal Fillers Market Share Analysis (%), by Application, 2020 & 2031
Figure 119: Canada Dermal Fillers Market Share Analysis (%), by Ingredient, 2020 & 2031
Figure 120: Canada Dermal Fillers Market Share Analysis (%), by Distribution Channel, 2020 & 2031
Figure 121: Canada Dermal Fillers Market Value Analysis (US$ Mn), 2020 & 2031
Figure 122: Brazil Dermal Fillers Market Share Analysis (%), by Product Type, 2020 & 2031
Figure 123: Brazil Dermal Fillers Market Share Analysis (%), by Application, 2020 & 2031
Figure 124: Brazil Dermal Fillers Market Share Analysis (%), by Ingredient, 2020 & 2031
Figure 125: Brazil Dermal Fillers Market Share Analysis (%), by Distribution Channel, 2020 & 2031
Figure 126: Brazil Dermal Fillers Market Value Analysis (US$ Mn), 2020 & 2031
Figure 127: Mexico Dermal Fillers Market Share Analysis (%), by Product Type, 2020 & 2031
Figure 128: Mexico Dermal Fillers Market Share Analysis (%), by Application, 2020 & 2031
Figure 129: Mexico Dermal Fillers Market Share Analysis (%), by Ingredient, 2020 & 2031
Figure 130: Mexico Dermal Fillers Market Share Analysis (%), by Distribution Channel, 2020 & 2031
Figure 131: Mexico Dermal Fillers Market Value Analysis (US$ Mn), 2020 & 2031
Figure 132: Argentina Dermal Fillers Market Share Analysis (%), by Product Type, 2020 & 2031
Figure 133: Argentina Dermal Fillers Market Share Analysis (%), by Application, 2020 & 2031
Figure 134: Argentina Dermal Fillers Market Share Analysis (%), by Ingredient, 2020 & 2031
Figure 135: Argentina Dermal Fillers Market Share Analysis (%), by Distribution Channel, 2020 & 2031
Figure 136: Argentina Dermal Fillers Market Value Analysis (US$ Mn), 2020 & 2031
Figure 137: U.K. Dermal Fillers Market Share Analysis (%), by Product Type, 2020 & 2031
Figure 138: U.K. Dermal Fillers Market Share Analysis (%), by Application, 2020 & 2031
Figure 139: U.K. Dermal Fillers Market Share Analysis (%), by Ingredient, 2020 & 2031
Figure 140: U.K. Dermal Fillers Market Share Analysis (%), by Distribution Channel, 2020 & 2031
Figure 141: U.K. Dermal Fillers Market Value Analysis (US$ Mn), 2020 & 2031
Figure 142: Germany Dermal Fillers Market Share Analysis (%), by Product Type, 2020 & 2031
Figure 143: Germany Dermal Fillers Market Share Analysis (%), by Application, 2020 & 2031
Figure 144: Germany Dermal Fillers Market Share Analysis (%), by Ingredient, 2020 & 2031
Figure 145: Germany Dermal Fillers Market Share Analysis (%), by Distribution Channel, 2020 & 2031
Figure 146: Germany Dermal Fillers Market Value Analysis (US$ Mn), 2020 & 2031
Figure 147: France Dermal Fillers Market Share Analysis (%), by Product Type, 2020 & 2031
Figure 148: France Dermal Fillers Market Share Analysis (%), by Application, 2020 & 2031
Figure 149: France Dermal Fillers Market Share Analysis (%), by Ingredient, 2020 & 2031
Figure 150: France Dermal Fillers Market Share Analysis (%), by Distribution Channel, 2020 & 2031
Figure 151: France Dermal Fillers Market Value Analysis (US$ Mn), 2020 & 2031
Figure 153: Italy Dermal Fillers Market Share Analysis (%), by Product Type, 2020 & 2031
Figure 154: Italy Dermal Fillers Market Share Analysis (%), by Application, 2020 & 2031
Figure 155: Italy Dermal Fillers Market Share Analysis (%), by Ingredient, 2020 & 2031
Figure 156: Italy Dermal Fillers Market Share Analysis (%), by Distribution Channel, 2020 & 2031
Figure 166: Italy Dermal Fillers Market Value Analysis (US$ Mn), 2020 & 2031
Figure 167: Spain Dermal Fillers Market Share Analysis (%), by Product Type, 2020 & 2031
Figure 158: Spain Dermal Fillers Market Share Analysis (%), by Application, 2020 & 2031
Figure 159: Spain Dermal Fillers Market Share Analysis (%), by Ingredient, 2020 & 2031
Figure 160: Spain Dermal Fillers Market Share Analysis (%), by Distribution Channel, 2020 & 2031
Figure 161: Spain Dermal Fillers Market Value Analysis (US$ Mn), 2020 & 2031
Figure 162: Russia Dermal Fillers Market Share Analysis (%), by Product Type, 2020 & 2031
Figure 163: Russia Dermal Fillers Market Share Analysis (%), by Application, 2020 & 2031
Figure 164: Russia Dermal Fillers Market Share Analysis (%), by Ingredient, 2020 & 2031
Figure 165: Russia Dermal Fillers Market Share Analysis (%), by Distribution Channel, 2020 & 2031
Figure 166: Russia Dermal Fillers Market Value Analysis (US$ Mn), 2020 & 2031
Figure 167: BENELUX Dermal Fillers Market Share Analysis (%), by Product Type, 2020 & 2031
Figure 168: BENELUX Dermal Fillers Market Share Analysis (%), by Application, 2020 & 2031
Figure 169: BENELUX Dermal Fillers Market Share Analysis (%), by Ingredient, 2020 & 2031
Figure 170: BENELUX Dermal Fillers Market Share Analysis (%), by Distribution Channel, 2020 & 2031
Figure 171: BENELUX Dermal Fillers Market Value Analysis (US$ Mn), 2020 & 2031
Figure 172: China Dermal Fillers Market Share Analysis (%), by Product Type, 2020 & 2031
Figure 173: China Dermal Fillers Market Share Analysis (%), by Application, 2020 & 2031
Figure 174: China Dermal Fillers Market Share Analysis (%), by Ingredient, 2020 & 2031
Figure 175: China Dermal Fillers Market Share Analysis (%), by Distribution Channel, 2020 & 2031
Figure 176: China Dermal Fillers Market Value Analysis (US$ Mn), 2020 & 2031
Figure 177: Japan Dermal Fillers Market Share Analysis (%), by Product Type, 2020 & 2031
Figure 178: Japan Dermal Fillers Market Share Analysis (%), by Application, 2020 & 2031
Figure 179: Japan Dermal Fillers Market Share Analysis (%), by Ingredient, 2020 & 2031
Figure 180: Japan Dermal Fillers Market Share Analysis (%), by Distribution Channel, 2020 & 2031
Figure 181: Japan Dermal Fillers Market Value Analysis (US$ Mn), 2020 & 2031
Figure 182: South Korea Dermal Fillers Market Share Analysis (%), by Product Type, 2020 & 2031
Figure 183: South Korea Dermal Fillers Market Share Analysis (%), by Application, 2020 & 2031
Figure 184: South Korea Dermal Fillers Market Share Analysis (%), by Ingredient, 2020 & 2031
Figure 185: South Korea Dermal Fillers Market Share Analysis (%), by Distribution Channel, 2020 & 2031
Figure 186: South Korea Dermal Fillers Market Value Analysis (US$ Mn), 2020 & 2031
Figure 187: India Dermal Fillers Market Share Analysis (%), by Product Type, 2020 & 2031
Figure 188: India Dermal Fillers Market Share Analysis (%), by Application, 2020 & 2031
Figure 189: India Dermal Fillers Market Share Analysis (%), by Ingredient, 2020 & 2031
Figure 200: India Dermal Fillers Market Share Analysis (%), by Distribution Channel, 2020 & 2031
Figure 201: India Dermal Fillers Market Value Analysis (US$ Mn), 2020 & 2031
Figure 202: Thailand Dermal Fillers Market Share Analysis (%), by Product Type, 2020 & 2031
Figure 203: Thailand Dermal Fillers Market Share Analysis (%), by Application, 2020 & 2031
Figure 194: Thailand Dermal Fillers Market Share Analysis (%), by Ingredient, 2020 & 2031
Figure 195: Thailand Dermal Fillers Market Share Analysis (%), by Distribution Channel, 2020 & 2031
Figure 196: Thailand Dermal Fillers Market Value Analysis (US$ Mn), 2020 & 2031
Figure 197: Indonesia Dermal Fillers Market Share Analysis (%), by Product Type, 2020 & 2031
Figure 198: Indonesia Dermal Fillers Market Share Analysis (%), by Application, 2020 & 2031
Figure 199: Indonesia Dermal Fillers Market Share Analysis (%), by Ingredient, 2020 & 2031
Figure 200: Indonesia Dermal Fillers Market Share Analysis (%), by Distribution Channel, 2020 & 2031
Figure 201: Indonesia Dermal Fillers Market Value Analysis (US$ Mn), 2020 & 2031
Figure 202: Malaysia Dermal Fillers Market Share Analysis (%), by Product Type, 2020 & 2031
Figure 203: Malaysia Dermal Fillers Market Share Analysis (%), by Application, 2020 & 2031
Figure 204: Malaysia Dermal Fillers Market Share Analysis (%), by Ingredient, 2020 & 2031
Figure 205: Malaysia Dermal Fillers Market Share Analysis (%), by Distribution Channel, 2020 & 2031
Figure 206: Malaysia Dermal Fillers Market Value Analysis (US$ Mn), 2020 & 2031
Figure 207: Australia Dermal Fillers Market Share Analysis (%), by Product Type, 2020 & 2031
Figure 208: Australia Dermal Fillers Market Share Analysis (%), by Application, 2020 & 2031
Figure 209: Australia Dermal Fillers Market Share Analysis (%), by Ingredient, 2020 & 2031
Figure 210: Australia Dermal Fillers Market Share Analysis (%), by Distribution Channel, 2020 & 2031
Figure 211: Australia Dermal Fillers Market Value Analysis (US$ Mn), 2020 & 2031
Figure 212: New Zealand Dermal Fillers Market Share Analysis (%), by Product Type, 2020 & 2031
Figure 213: New Zealand Dermal Fillers Market Share Analysis (%), by Application, 2020 & 2031
Figure 214: New Zealand Dermal Fillers Market Share Analysis (%), by Ingredient, 2020 & 2031
Figure 215: New Zealand Dermal Fillers Market Share Analysis (%), by Distribution Channel, 2020 & 2031
Figure 216: New Zealand Dermal Fillers Market Value Analysis (US$ Mn), 2020 & 2031
Figure 217: South Africa Dermal Fillers Market Share Analysis (%), by Product Type, 2020 & 2031
Figure 218: South Africa Dermal Fillers Market Share Analysis (%), by Application, 2020 & 2031
Figure 219: South Africa Dermal Fillers Market Share Analysis (%), by Ingredient, 2020 & 2031
Figure 220: South Africa Dermal Fillers Market Share Analysis (%), by Distribution Channel, 2020 & 2031
Figure 221: South Africa Dermal Fillers Market Value Analysis (US$ Mn), 2020 & 2031
Figure 222: GCC Countries Dermal Fillers Market Share Analysis (%), by Product Type, 2020 & 2031
Figure 223: GCC Countries Dermal Fillers Market Share Analysis (%), by Application, 2020 & 2031
Figure 224: GCC Countries Dermal Fillers Market Share Analysis (%), by Ingredient, 2020 & 2031
Figure 225: GCC Countries Dermal Fillers Market Share Analysis (%), by Distribution Channel, 2020 & 2031
Figure 226: GCC Countries Dermal Fillers Market Value Analysis (US$ Mn), 2020 & 2031
Figure 227: Turkey Dermal Fillers Market Share Analysis (%), by Product Type, 2020 & 2031
Figure 228: Turkey Dermal Fillers Market Share Analysis (%), by Application, 2020 & 2031
Figure 229: Turkey Dermal Fillers Market Share Analysis (%), by Ingredient, 2020 & 2031
Figure 230: Turkey Dermal Fillers Market Share Analysis (%), by Distribution Channel, 2020 & 2031
Figure 231: Turkey Dermal Fillers Market Value Analysis (US$ Mn), 2020 & 2031
Need specific information?
Request CustomizationExplore Healthcare Insights
View Reports