Reports

- Global Locations -

Headquarters

Future Market Insights, Inc.

Christiana Corporate, 200
Continental Drive, Suite 401,
Newark, Delaware - 19713,
United States

T: +1-845-579-5705

Americas

Future Market Insights, Inc.

616 Corporate Way, Suite 2-9018,
Valley Cottage, NY 10989, United States

T: +1-347-918-3531

MEA

Future Market Insights

1602-6 Jumeirah Bay X2 Tower, Plot No: JLT-PH2-X2A,
Jumeirah Lakes Towers, Dubai,
United Arab Emirates

Europe

Future Market Insights

3rd Floor, 207 Regent Street,
W1B 3HH London
United Kingdom

T: + 44 (0) 20 8123 9659
D: +44 (0) 20 3287 4268

Asia Pacific

Future Market Insights

IndiaLand Global Tech Park, Unit UG-1, Behind Grand HighStreet, Phase 1, Hinjawadi, MH, Pune – 411057, India

Dermal Sprays Market Outlook (2023 to 2033)

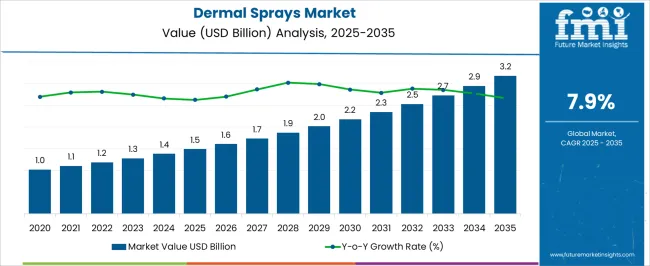
The dermal sprays market size is projected to be worth US$ 1.27 billion in 2023. The market is likely to surpass US$ 2.81 billion by 2033 at a CAGR of 8.3% during the forecast period. Dermal sprays are made to deliver active chemicals right to the surface of the skin, facilitating rapid absorption and precise therapy. These sprays are frequently employed for a number of dermatological procedures, including skincare, wound healing, pain management, and sun protection.

Dermal sprays are often sold in aerosol or pump spray bottles for easy and accurate application. Depending on their intended function, they are prepared with a combination of active components, such as vitamins, minerals, botanical extracts, antioxidants, moisturizers, or pharmaceuticals.

Other Drivers Propelling the Demand for Dermal Sprays include:

  • Consumers are becoming more and more conscious of skincare and the value of preserving healthy skin. The demand for dermal sprays as a component of skincare routines has been increasing as individuals become more mindful of their appearance and general well-being.
  • Comparatively speaking to conventional creams or lotions, dermal sprays offer a convenient and user-friendly application approach. The spray style makes application simple and precise while guaranteeing even coverage and quick skin absorption.
  • Dermal spray formulation and distribution have improved as a result of ongoing developments in spray technology. These developments have produced spray patterns that are finer and more regulated, enabling improved coverage and absorption of active substances.

Challenges for Companies /Manufacturers in the Dermal Sprays Market:

  • Dermal spray development and marketing necessitate adherence to a number of regulatory frameworks and criteria. Regulations governing product safety, labelling, ingredients, and manufacturing procedures must be followed by manufacturers.
  • Active substances in dermal sprays come into direct contact with the skin. To retain consumer confidence and prevent negative impacts, it is essential to ensure the safety and effectiveness of these components.

Opportunities in the Dermal Sprays Industry:

  • Sun protection has been a top concern for consumers due to growing knowledge about the negative effects of UV radiation. Sun protection factor (SPF) dermal sprays are becoming more and more popular since they give a practical and lightweight alternative to conventional sunscreens.
  • Drug delivery methods could be revolutionized by dermal sprays. They can provide a painless and non-invasive way to apply drugs to the skin. Patients who have trouble swallowing medicines or those who need localized therapies can particularly benefit from this.

Latest Trends in the Dermal Sprays Market:

  • Dermal spray manufacturers are concentrating on creating cutting-edge formulations and adding cutting-edge components. These contain, among other things, hyaluronic acid, peptides, vitamins, minerals, antioxidants, and plant extracts. These compositions provide better skin hydration, anti-aging benefits, and environmental protection.
  • There is a rising need for natural and organic dermal sprays due to growing concerns over chemical substances and sustainability. Natural and organic options have emerged on the market as a result of consumer demand for goods devoid of toxic chemicals, parabens, and synthetic perfumes.
  • Dermal sprays are being used more frequently to administer treatment for some skin disorders. Dermal sprays for dermatitis, psoriasis, acne, and other inflammatory skin diseases fall under this category. Dermal sprays are a desirable choice for targeted treatment because of their portability and ability for localized application.
Attributes Details
Dermal Sprays Market Size (2023) US$ 1.27 billion
Dermal Sprays Market Projected Size (2033) US$ 2.81 billion
Value CAGR (2023 to 2033) 8.3%

Don't pay for what you don't need

Customize your report by selecting specific countries or regions and save 30%!

2017 to 2022 Dermal Sprays Demand Outlook Compared to 2023 to 2033 Forecast

From 2017 to 2022, the global dermal sprays market experienced a CAGR of 13.9%, reaching a market size of US$ 1.27 billion in 2023.

From 2017 to 2022, the market for dermal sprays has consistently expanded throughout the years. Market expansion has been spurred by increased customer demand for practical and efficient skincare products as well as improvements in spray technology.

Future Forecast for Dermal Sprays Industry:

Looking ahead, the global dermal sprays industry is expected to rise at a CAGR of 8.3% from 2023 to 2033. During the forecast period, the market size is expected to reach US$ 2.81 billion by 2033.

The market for dermal sprays is anticipated to have rapid growth over the forecast period. Market expansion will be fueled by rising consumer interest in skincare and beauty products as well as rising demand for practical and efficient goods. The market for dermal sprays will continue to be significantly fueled by the skincare and beauty sector. Dermal spray demand will be driven by consumers' need for rapid and effective skincare treatments as well as improvements in formulation technology.

Comparative View of the Dermal Sprays Market

Dermal Sprays Market:

Attributes Dermal Sprays Market
CAGR (2023 to 2033) 8.3%
Market Value (2033) US$ 2.8 billion
Opportunity Sports-related uses for dermal sprays include cooling, muscular healing, and performance improvement. Sprays that give rapid cooling or active chemicals to help muscle recovery after strenuous workouts can be useful for athletes and fitness enthusiasts.
Key Trends The market for dermal sprays is expanding as a result of improvements in spray delivery systems and packaging technologies. To enhance product effectiveness and user experience, manufacturers are introducing features including airless pumps, fine mist nozzles, and controlled dispensing systems.

Dermal Fillers Market:

Attributes Dermal Fillers Market
CAGR (2023 to 2033) 3.6%
Market Value (2033) US$ 8.7 billion
Opportunity The growing inclination for least invasive cosmetic operations as well as the expanding need for minimally invasive facial treatments.
Key Trends A growing number of firms are heavily spending in research and development to create cutting-edge technology in the field of cosmetics.

Cosmetic Surgery Products Market:

Attributes Cosmetic Surgery Products Market
CAGR (2023 to 2033) 8.3%
Market Value (2033) US$ 18.0 billion
Opportunity It is projected that the launch of new goods in the sector will significantly fuel market expansion.
Key Trends The sector will profit from the rising demand for minimally invasive procedures due to their many advantages, including less pain and low cost.
Sabyasachi Ghosh
Sabyasachi Ghosh

Principal Consultant

Talk to Analyst

Find your sweet spots for generating winning opportunities in this market.

Country-Wise Insights

Dermal Sprays Market to Surge in the United States Due to Increased Focus on Skin Care.

Country The United States
Market Size (US$ million) by End of Forecast Period (2033) US$ 855.0 million
CAGR % 2023 to End of Forecast (2033) 8.1%

The dermal sprays industry in the United States is expected to reach a market size of US$ 855.0 million by 2033, expanding at a CAGR of 8.1%. In recent years, there has been an increased focus on skincare and beauty regimens. Customers are eager to spend money on goods that enhance their overall appearance as they become more aware of the condition of their skin. Dermal sprays have acquired popularity among people looking for quick and efficient skincare remedies due to their promises of moisturizing, refreshing, or rejuvenating effects.

Expansion of E-commerce platform to Propel the United Kingdom Market Growth

Country The United Kingdom
Market Size (US$ million) by End of Forecast Period (2033) US$ 170.0 million
CAGR % 2023 to End of Forecast (2033) 7.7%

The dermal sprays industry in the United Kingdom is expected to reach a market value of US$ 170.0 million, expanding at a CAGR of 7.7% during the forecast period. Consumers in the United Kingdom now have greater access to a variety of skincare products, including dermal sprays, as a result of the expansion of e-commerce platforms and online retail channels. Online shopping is a convenient choice for customers because of the range of products available and the availability of customer reviews. Dermal sprays' market expansion in the United Kingdom has been aided by their accessibility through internet merchants.

Notable Growth Expected in China's Dermal Sprays Market Due to Consumer Spending

Country China
Market Size (US$ million) by End of Forecast Period (2033) US$ 197.0 million
CAGR % 2023 to End of Forecast (2033) 9.5%

The dermal sprays industry in China is anticipated to reach a market size of US$ 197.0 million, moving at a CAGR of 9.5% during the forecast period. Chinese consumers are more prepared to spend on skincare and personal care goods as a result of their expanding disposable income. People are seeking higher-quality goods and are ready to spend more on dermal sprays for their skincare regimens as they have more disposable income.
Skincare-conscious culture to Drive Market Growth in Japan

Country Japan
Market Size (US$ million) by End of Forecast Period (2033) US$ 109.0 million
CAGR % 2023 to End of Forecast (2033) 7.2%

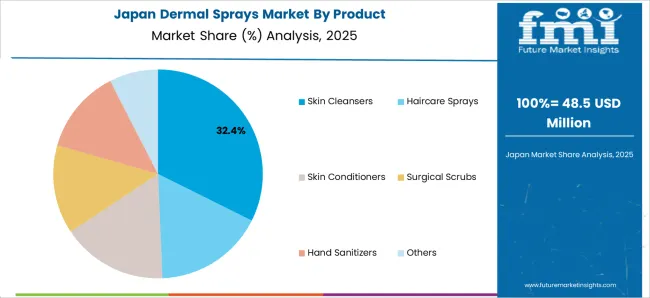
The dermal sprays industry in Japan is estimated to reach a market size of US$ 109.0 million by 2033, thriving at a CAGR of 7.2%. Beauty and skincare have a long history in Japan. Japanese consumers place a high value on preserving skin that looks healthy and young. Because skincare practices are so deeply embedded in the culture, there is a significant need for skincare products. Dermal sprays have grown in popularity among Japanese consumers as an essential component of their skincare routine thanks to its moisturizing and refreshing qualities.
Demand for Dermal Sprays is Rising Due to Personalized Solutions Fuel Market Growth in South Korea

Country South Korea
Market Size (US$ million) by End of Forecast Period (2033) US$ 40.0 million
CAGR % 2023 to End of Forecast (2033) 9.2%

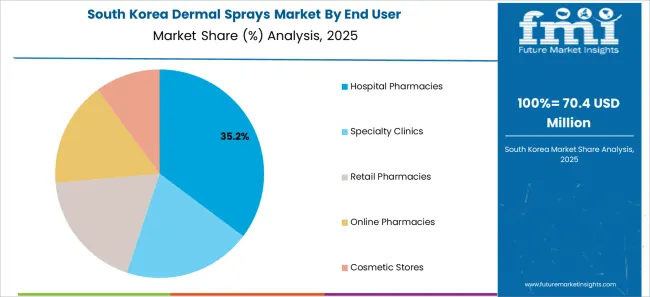
The dermal sprays industry in South Korea is expected to reach a market size of US$ 40.0 million, expanding at a CAGR of 9.2% during the forecast period. South Korean skincare companies are renowned for their wide range of products and focus on personalization. Dermal sprays are available in a variety of formulas that address various skincare issues, including hydration, brightening, and calming. South Korean customers looking for individualized solutions have been drawn to the possibility to customize skincare regimens to meet specific demands. The market for dermal sprays has expanded in part because to the large range of products available and the customization possibilities.

Category-Wise Insights

Skin Cleansers to Dominate Dermal Sprays Industry with 8.0% CAGR through 2033

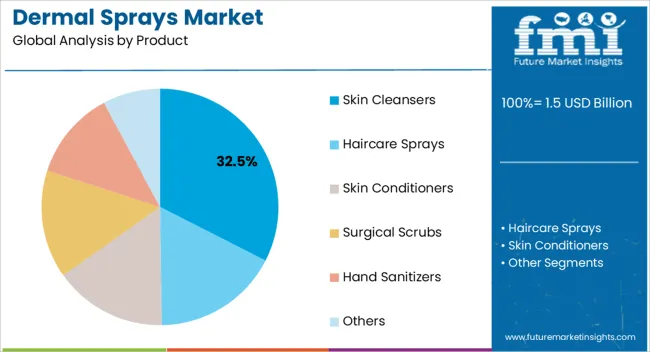
Skin Cleansers dominated the dermal sprays industry with a market share of 30.2% in 2022. This segment captures a significant market share in 2023, as they help to remove dirt, oil, and impurities from the skin that can clog pores and lead to breakouts and other skin issues. This, in turn creates a much better surface for dermal sprays to be applied, allowing them to penetrate deeper into the skin and achieve greater results.

Which End User is Widely Adopted the Dermal Sprays?

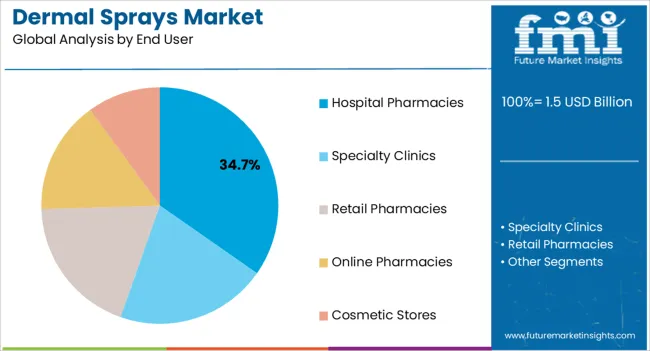
The retail pharmacies segment dominated the dermal sprays industry with market share of 37.5% in 2022. These pharmacies serve as a primary distribution channel for dermal sprays due to their widespread reach and easy accessibility. They also provide easy-to-read directions on how to use the product. They offer promotion and marketing campaigns for dermal sprays manufacturers can benefit from increased distribution and sales, resulting in a larger share of the market.
Get the data you need at a Fraction of the cost

Personalize your report by choosing insights you need
and save 40%!

How Key Players Stay Competitive in the Dermal Sprays Industry?

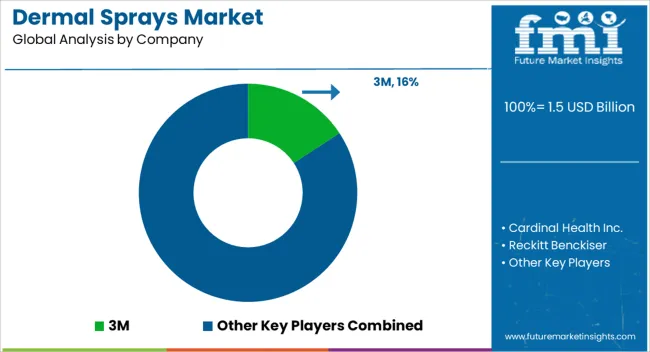
The dermal sprays sector is fiercely competitive, with many companies fighting for market dominance. To stay ahead of the competition in such a circumstance, essential players must employ smart techniques.

Key Strategies Used by the Participants

  • Product Development

To produce innovative goods that increase efficacy, dependability, and cost-effectiveness, businesses make significant investments in research and development. Product innovation enables companies to stand out from the competition while also meeting the shifting needs of their customers.

  • Strategic Alliances & Collaborations

Strategic alliances and partnerships with other businesses are regularly formed by major players in an industry to take advantage of each other's advantages and expand their market reach. Through such arrangements, businesses may also obtain access to new technologies and markets.

  • Expansion into Emerging Markets

In developing nations like China and India, the market for dermal sprays is growing quickly. To boost their presence in these regions, major companies are expanding their distribution networks and building regional manufacturing sites.

  • Acquisitions and mergers

Key players in the dermal sprays industry routinely employ mergers and acquisitions to strengthen their market positions, broaden their product offerings, and enter new markets.

Key Players in the Dermal Sprays Industry

  • 3M
  • Cardinal Health Inc.
  • Reckitt Benckiser
  • Galderma S.A.
  • Revlon
  • Sonoma Pharmaceuticals
  • Summers Laboratories, Inc
  • SkinCeuticals
  • Dermalogica
  • L'Oréal S.A.

Key Developments in the Dermal Sprays Market:

  • In MAY 2023, in order to provide better patient engagement and clinical pharmacy solutions, Cardinal Health's OutcomesTM division will merge with Transaction Data Systems. This will increase links between payers and pharma to its statewide pharmacy network.
  • In September 2021, Sonoma Pharmaceuticals, Inc. (Nasdaq: SNOA), launched over-the-counter (OTC) consumer products - MucoClyns™ on Amazon sites in Europe and Ocucyn® Eyelid & Eyelash Cleanser, and Regenacyn® Advanced Scar Gel on Amazon.com.

Segmentation Analysis of the Dermal Sprays Market

By Product:

  • Skin Cleansers
  • Haircare Sprays
  • Skin Conditioners
  • Surgical Scrubs
  • Hand Sanitizers
  • Others

By End User:

  • Hospital Pharmacies
  • Specialty Clinics
  • Retail Pharmacies
  • Online Pharmacies
  • Cosmetic Stores

By Region:

  • North America
  • Latin America
  • Europe
  • East Asia
  • South Asia
  • Oceania
  • The Middle East & Africa

Frequently Asked Questions

How Big is the Dermal Sprays Market?

The dermal sprays market value is likely to reach US$ 1.27 billion in 2023.

What are the Projected Dimensions of the Dermal Sprays Market by 2033?

The dermal sprays market is anticipated to surpass US$ 2.81 billion by 2033, recording a CAGR of 8.3%.

Which Category Assumes Prominence in the Product Type Aspect of the Dermal Sprays Market?

With a 30.2% market share in 2022, the skin cleansers segment is set to lead in the dermal sprays market.

Which Country Holds High Lucrativeness for Dermal Sprays?

With a prospect to exceed US$ 855.0 million by 2033, the dermal sprays market finds lucrative opportunities in the United States.

Who are the Key Dermal Sprays Market Players?

Key dermal sprays market players are 3M, Cardinal Health Inc., Dermalogica, Reckitt Benckiser, Galderma S.A., Revlon, Sonoma Pharmaceuticals, and L'Oréal S.A.

Table of Content

1. Executive Summary

    1.1. Global Market Outlook

    1.2. Demand Side Trends

    1.3. Supply Side Trends

    1.4. Analysis and Recommendations

2. Market Overview

    2.1. Market Coverage / Taxonomy

    2.2. Market Definition / Scope / Limitations

    2.3. Inclusions and Exclusions

3. Key Market Trends

    3.1. Key Trends Impacting the Market

    3.2. Product Innovation / Development Trends

4. Value Added Insights

    4.1. Product Adoption / Usage Analysis

    4.2. Product Features/ USPs

    4.3. Recent Product Approvals/Launces

    4.4. Reimbursement Scenario

    4.5. Regulatory Landscape

    4.6. PESTEL Analysis

    4.7. Porter’s Analysis

5. Market Background

    5.1. Macro-Economic Factors

        5.1.1. Global GDP Growth Outlook

        5.1.2. Global Healthcare Expenditure Outlook

    5.2. Forecast Factors - Relevance & Impact

        5.2.1. Key Player’s Historic Growth

        5.2.2. Increasing Cases of Skin Related Diseases

        5.2.3. Favourable Government Regulations

        5.2.4. Rising Demand for Dermal Sprays

        5.2.5. Technological Advancement in the Products

        5.2.6. Increasing Awareness of Sun protection and Skin Care

        5.2.7. Growing Product Demand

    5.3. Dynamics

        5.3.1. Drivers

        5.3.2. Restraints

        5.3.3. Opportunity Analysis

6. Global Market Volume (in Units) Analysis 2017 to 2022 and Forecast, 2023 to 2033

    6.1. Historical Volume (in Units) Analysis, 2017 to 2022

    6.2. Current and Future Volume (in Units) Projections, 2023 to 2033

        6.2.1. Y-o-Y Growth Trend Analysis

7. Global Market - Pricing Analysis

    7.1. Regional Pricing Analysis By Product

    7.2. Pricing Break-up

        7.2.1. Manufacturer Level Pricing

        7.2.2. Distributor Level Pricing

    7.3. Global Average Pricing Analysis Benchmark

    7.4. Pricing Assumptions

8. Global Market Demand (in Value or Size in US$ Mn) Analysis 2017 to 2022 and Forecast, 2023 to 2033

    8.1. Historical Market Value (US$ Million) Analysis, 2017 to 2022

    8.2. Current and Future Market Value (US$ Million) Projections, 2023 to 2033

        8.2.1. Y-o-Y Growth Trend Analysis

        8.2.2. Absolute $ Opportunity Analysis

9. Global Market Analysis 2017 to 2022 and Forecast 2023 to 2033, By Product

    9.1. Introduction / Key Findings

    9.2. Historical Market Size (US$ Million) and Volume (Units) Analysis By Product, 2017 to 2022

    9.3. Current and Future Market Size (US$ Million) and Volume (Units) Analysis and Forecast By Product, 2023 to 2033

        9.3.1. Skin Cleansers

        9.3.2. Haircare Sprays

        9.3.3. Skin Conditioners

        9.3.4. Surgical Scrubs

        9.3.5. Hand Sanitizers

        9.3.6. Others

    9.4. Market Attractiveness Analysis By Product

10. Global Market Analysis 2017 to 2022 and Forecast 2023 to 2033, By Distribution Channel

    10.1. Introduction / Key Findings

    10.2. Historical Market Size (US$ Million) Analysis By Distribution Channel, 2017 to 2022

    10.3. Current and Future Market Size (US$ Million) Analysis and Forecast By Distribution Channel, 2023 to 2033

        10.3.1. Hospital Pharmacies

        10.3.2. Speciality Clinics

        10.3.3. Retail Pharmacies

        10.3.4. Online Pharmacies

        10.3.5. Cosmetic Stores

    10.4. Market Attractiveness Analysis By Distribution Channel

11. Global Market Analysis 2017 to 2022 and Forecast 2023 to 2033, by Region

    11.1. Introduction

    11.2. Historical Market Size (US$ Million) Analysis By Region, 2017 to 2022

    11.3. Current and Future Market Size (US$ Million) Analysis and Forecast By Region, 2023 to 2033

        11.3.1. North America

        11.3.2. Latin America

        11.3.3. Europe

        11.3.4. South Asia

        11.3.5. East Asia

        11.3.6. Oceania

        11.3.7. Middle East and Africa (MEA)

    11.4. Market Attractiveness Analysis By Region

12. North America Market Analysis 2017 to 2022 and Forecast 2023 to 2033

    12.1. Introduction

    12.2. Historical Market Size (US$ Million) and Volume (Units) Analysis By Market Taxonomy, 2017 to 2022

    12.3. Current and Future Market Size (US$ Million) and Volume (Units) Analysis and Forecast By Market Taxonomy, 2023 to 2033

        12.3.1. By Country

            12.3.1.1. USA

            12.3.1.2. Canada

        12.3.2. By Product

        12.3.3. By Distribution Channel

    12.4. Market Attractiveness Analysis

        12.4.1. By Country

        12.4.2. By Product

        12.4.3. By Distribution Channel

    12.5. Country Level Analysis & Forecast

        12.5.1. USA Market Analysis

            12.5.1.1. .Introduction

            12.5.1.2. Market Analysis and Forecast by Market Taxonomy

                12.5.1.2.1. By Product

                12.5.1.2.2. By Distribution Channel

        12.5.2. Canada Market Analysis

            12.5.2.1. Introduction

            12.5.2.2. Market Analysis and Forecast by Market Taxonomy

                12.5.2.2.1. By Product

                12.5.2.2.2. By Distribution Channel

    12.6. Market Trends

    12.7. Key Market Participants - Intensity Mapping

    12.8. Drivers and Restraints - Impact Analysis

13. Latin America Market Analysis 2017 to 2022 and Forecast 2023 to 2033

    13.1. Introduction

    13.2. Historical Market Size (US$ Million) and Volume (Units) Analysis By Market Taxonomy, 2017 to 2022

    13.3. Current and Future Market Size (US$ Million) and Volume (Units) Analysis and Forecast By Market Taxonomy, 2023 to 2033

        13.3.1. By Country

            13.3.1.1. Brazil

            13.3.1.2. Mexico

            13.3.1.3. Argentina

            13.3.1.4. Rest of Latin America

        13.3.2. By Product

        13.3.3. By Distribution Channel

    13.4. Market Attractiveness Analysis

        13.4.1. By Country

        13.4.2. By Product

        13.4.3. By Distribution Channel

    13.5. Country Level Analysis & Forecast

        13.5.1. Brazil Market Analysis

            13.5.1.1. . Introduction

            13.5.1.2. Market Analysis and Forecast by Market Taxonomy

                13.5.1.2.1. By Product

                13.5.1.2.2. By Distribution Channel

        13.5.2. Mexico Market Analysis

            13.5.2.1. Introduction

            13.5.2.2. Market Analysis and Forecast by Market Taxonomy

                13.5.2.2.1. By Product

                13.5.2.2.2. By Distribution Channel

        13.5.3. Argentina Market Analysis

            13.5.3.1. Introduction

            13.5.3.2. Market Analysis and Forecast by Market Taxonomy

                13.5.3.2.1. By Product

                13.5.3.2.2. By Distribution Channel

    13.6. Market Trends

    13.7. Key Market Participants - Intensity Mapping

    13.8. Drivers and Restraints - Impact Analysis

14. Europe Market Analysis 2017 to 2022 and Forecast 2023 to 2033

    14.1. Introduction

    14.2. Historical Market Size (US$ Million) and Volume (Units) Analysis By Market Taxonomy, 2017 to 2022

    14.3. Current and Future Market Size (US$ Million) and Volume (Units) Analysis and Forecast By Market Taxonomy, 2023 to 2033

        14.3.1. By Country

            14.3.1.1. Germany

            14.3.1.2. France

            14.3.1.3. Italy

            14.3.1.4. UK

            14.3.1.5. Spain

            14.3.1.6. Russia

            14.3.1.7. BENELUX

            14.3.1.8. Rest of Europe

        14.3.2. By Product

        14.3.3. By Distribution Channel

    14.4. Market Attractiveness Analysis

        14.4.1. By Country

        14.4.2. By Product

        14.4.3. By Distribution Channel

    14.5. Country Level Analysis & Forecast

        14.5.1. Germany Market Analysis

            14.5.1.1. .Introduction

            14.5.1.2. Market Analysis and Forecast by Market Taxonomy

                14.5.1.2.1. By Product

                14.5.1.2.2. By Distribution Channel

        14.5.2. France Market Analysis

            14.5.2.1. Introduction

            14.5.2.2. Market Analysis and Forecast by Market Taxonomy

                14.5.2.2.1. By Product

                14.5.2.2.2. By Distribution Channel

        14.5.3. Italy Market Analysis

            14.5.3.1. Introduction

            14.5.3.2. Market Analysis and Forecast by Market Taxonomy

                14.5.3.2.1. By Product

                14.5.3.2.2. By Distribution Channel

        14.5.4. UK Market Analysis

            14.5.4.1. . Introduction

            14.5.4.2. Market Analysis and Forecast by Market Taxonomy

                14.5.4.2.1. By Product

                14.5.4.2.2. By Distribution Channel

        14.5.5. Spain Market Analysis

            14.5.5.1. . Introduction

            14.5.5.2. Market Analysis and Forecast by Market Taxonomy

                14.5.5.2.1. By Product

                14.5.5.2.2. By Distribution Channel

        14.5.6. Russia Market Analysis

            14.5.6.1. . Introduction

            14.5.6.2. Market Analysis and Forecast by Market Taxonomy

                14.5.6.2.1. By Product

                14.5.6.2.2. By Distribution Channel

        14.5.7. BENELUX Market Analysis

            14.5.7.1. . Introduction

            14.5.7.2. Market Analysis and Forecast by Market Taxonomy

                14.5.7.2.1. By Product

                14.5.7.2.2. By Distribution Channel

    14.6. Market Trends

    14.7. Key Market Participants - Intensity Mapping

    14.8. Drivers and Restraints - Impact Analysis

15. South Asia Market Analysis 2017 to 2022 and Forecast 2023 to 2033

    15.1. Introduction

    15.2. Historical Market Size (US$ Million) and Volume (Units) Analysis By Market Taxonomy, 2017 to 2022

    15.3. Current and Future Market Size (US$ Million) and Volume (Units) Analysis and Forecast By Market Taxonomy, 2023 to 2033

        15.3.1. By Country

            15.3.1.1. India

            15.3.1.2. Thailand

            15.3.1.3. Indonesia

            15.3.1.4. Malaysia

            15.3.1.5. Rest of South Asia

        15.3.2. By Product

        15.3.3. By Distribution Channel

    15.4. Market Attractiveness Analysis

        15.4.1. By Country

        15.4.2. By Product

        15.4.3. By Distribution Channel

    15.5. Country Level Analysis & Forecast

        15.5.1. India Market Analysis

            15.5.1.1. . Introduction

            15.5.1.2. Market Analysis and Forecast by Market Taxonomy

                15.5.1.2.1. By Product

                15.5.1.2.2. By Distribution Channel

        15.5.2. Thailand Market Analysis

            15.5.2.1. .Introduction

            15.5.2.2. Market Analysis and Forecast by Market Taxonomy

                15.5.2.2.1. By Product

                15.5.2.2.2. By Distribution Channel

        15.5.3. Indonesia Market Analysis

            15.5.3.1. Introduction

            15.5.3.2. Market Analysis and Forecast by Market Taxonomy

                15.5.3.2.1. By Product

                15.5.3.2.2. By Distribution Channel

        15.5.4. Malaysia Market Analysis

            15.5.4.1. Introduction

            15.5.4.2. Market Analysis and Forecast by Market Taxonomy

                15.5.4.2.1. By Product

                15.5.4.2.2. By Distribution Channel

    15.6. Market Trends

    15.7. Key Market Participants - Intensity Mapping

    15.8. Drivers and Restraints - Impact Analysis

16. East Asia Market Analysis 2017 to 2022 and Forecast 2023 to 2033

    16.1. Introduction

    16.2. Historical Market Size (US$ Million) and Volume (Units) Analysis By Market Taxonomy, 2017 to 2022

    16.3. Current and Future Market Size (US$ Million) and Volume (Units) Analysis and Forecast By Market Taxonomy, 2023 to 2033

        16.3.1. By Country

            16.3.1.1. China

            16.3.1.2. Japan

            16.3.1.3. South Korea

        16.3.2. By Product

        16.3.3. By Distribution Channel

    16.4. Market Attractiveness Analysis

        16.4.1. By Country

        16.4.2. By Product

        16.4.3. By Distribution Channel

    16.5. Country Level Analysis & Forecast

        16.5.1. China Market Analysis

            16.5.1.1. . Introduction

            16.5.1.2. Market Analysis and Forecast by Market Taxonomy

                16.5.1.2.1. By Product

                16.5.1.2.2. By Distribution Channel

        16.5.2. Japan Market Analysis

            16.5.2.1. Introduction

            16.5.2.2. Market Analysis and Forecast by Market Taxonomy

                16.5.2.2.1. By Product

                16.5.2.2.2. By Distribution Channel

        16.5.3. South Korea Market Analysis

            16.5.3.1. Introduction

            16.5.3.2. Market Analysis and Forecast by Market Taxonomy

                16.5.3.2.1. By Product

                16.5.3.2.2. By Distribution Channel

    16.6. Market Trends

    16.7. Key Market Participants - Intensity Mapping

    16.8. Drivers and Restraints - Impact Analysis

17. Oceania Market Analysis 2017 to 2022 and Forecast 2023 to 2033

    17.1. Introduction

    17.2. Historical Market Size (US$ Million) and Volume (Units) Analysis By Market Taxonomy, 2017 to 2022

    17.3. Current and Future Market Size (US$ Million) and Volume (Units) Analysis and Forecast By Market Taxonomy, 2023 to 2033

        17.3.1. By Country

            17.3.1.1. Australia

            17.3.1.2. New Zealand

        17.3.2. By Product

        17.3.3. By Distribution Channel

    17.4. Market Attractiveness Analysis

        17.4.1. By Country

        17.4.2. By Product

        17.4.3. By Distribution Channel

    17.5. Country Level Analysis & Forecast

        17.5.1. Australia Market Analysis

            17.5.1.1. . Introduction

            17.5.1.2. Market Analysis and Forecast by Market Taxonomy

                17.5.1.2.1. By Product

                17.5.1.2.2. By Distribution Channel

        17.5.2. New Zealand Market Analysis

            17.5.2.1. Introduction

            17.5.2.2. Market Analysis and Forecast by Market Taxonomy

                17.5.2.2.1. By Product

                17.5.2.2.2. By Distribution Channel

    17.6. Market Trends

    17.7. Key Market Participants - Intensity Mapping

    17.8. Drivers and Restraints - Impact Analysis

18. Middle East and Africa Market Analysis 2017 to 2022 and Forecast 2023 to 2033

    18.1. Introduction

    18.2. Historical Market Size (US$ Million) and Volume (Units) Analysis By Market Taxonomy, 2017 to 2022

    18.3. Current and Future Market Size (US$ Million) and Volume (Units) Analysis and Forecast By Market Taxonomy, 2023 to 2033

        18.3.1. By Country

            18.3.1.1. GCC Countries

            18.3.1.2. Türkiye

            18.3.1.3. Northern Africa

            18.3.1.4. South Africa

            18.3.1.5. Rest of Middle East and Africa

        18.3.2. By Product

        18.3.3. By Distribution Channel

    18.4. Market Attractiveness Analysis

        18.4.1. By Country

        18.4.2. By Product

        18.4.3. By Distribution Channel

    18.5. Country Level Analysis & Forecast

        18.5.1. GCC Countries Market Analysis

            18.5.1.1. .Introduction

            18.5.1.2. Market Analysis and Forecast by Market Taxonomy

                18.5.1.2.1. By Product

                18.5.1.2.2. By Distribution Channel

        18.5.2. Türkiye Market Analysis

            18.5.2.1. Introduction

            18.5.2.2. Market Analysis and Forecast by Market Taxonomy

                18.5.2.2.1. By Product

                18.5.2.2.2. By Distribution Channel

        18.5.3. Northern Africa Market Analysis

            18.5.3.1. Introduction

            18.5.3.2. Market Analysis and Forecast by Market Taxonomy

                18.5.3.2.1. By Product

                18.5.3.2.2. By Distribution Channel

        18.5.4. South Africa Market Analysis

            18.5.4.1. Introduction

            18.5.4.2. Market Analysis and Forecast by Market Taxonomy

                18.5.4.2.1. By Product

                18.5.4.2.2. By Distribution Channel

    18.6. Market Trends

    18.7. Key Market Participants - Intensity Mapping

    18.8. Drivers and Restraints - Impact Analysis

19. Market Structure Analysis

    19.1. Market Analysis by Tier of Companies

    19.2. Market Share Analysis of Top Players

    19.3. Market Presence Analysis

20. Competition Analysis

    20.1. Competition Dashboard

    20.2. Branding and Promotional Strategies, By Key Players

    20.3. Key Development Analysis

    20.4. Competition Deep Dive

        20.4.1. 3M

            20.4.1.1. Overview

            20.4.1.2. Product Portfolio

            20.4.1.3. Key Financials

            20.4.1.4. Sales Footprint

            20.4.1.5. SWOT Analysis

            20.4.1.6. Strategy Overview

                20.4.1.6.1. Marketing Strategy

                20.4.1.6.2. Product Strategy

                20.4.1.6.3. Channel Strategy

        20.4.2. Cardinal Health Inc.

            20.4.2.1. Overview

            20.4.2.2. Product Portfolio

            20.4.2.3. Key Financials

            20.4.2.4. Sales Footprint

            20.4.2.5. SWOT Analysis

            20.4.2.6. Strategy Overview

                20.4.2.6.1. Marketing Strategy

                20.4.2.6.2. Product Strategy

                20.4.2.6.3. Channel Strategy

        20.4.3. Reckitt Benckiser

            20.4.3.1. Overview

            20.4.3.2. Product Portfolio

            20.4.3.3. Key Financials

            20.4.3.4. Sales Footprint

            20.4.3.5. SWOT Analysis

            20.4.3.6. Strategy Overview

                20.4.3.6.1. Marketing Strategy

                20.4.3.6.2. Product Strategy

                20.4.3.6.3. Channel Strategy

        20.4.4. Galderma S.A.

            20.4.4.1. Overview

            20.4.4.2. Product Portfolio

            20.4.4.3. Key Financials

            20.4.4.4. Sales Footprint

            20.4.4.5. SWOT Analysis

            20.4.4.6. Strategy Overview

                20.4.4.6.1. Marketing Strategy

                20.4.4.6.2. Product Strategy

                20.4.4.6.3. Channel Strategy

        20.4.5. Revlon

            20.4.5.1. Overview

            20.4.5.2. Product Portfolio

            20.4.5.3. Key Financials

            20.4.5.4. Sales Footprint

            20.4.5.5. SWOT Analysis

            20.4.5.6. Strategy Overview

                20.4.5.6.1. Marketing Strategy

                20.4.5.6.2. Product Strategy

                20.4.5.6.3. Channel Strategy

        20.4.6. Sonoma Pharmaceuticals

            20.4.6.1. Overview

            20.4.6.2. Product Portfolio

            20.4.6.3. Key Financials

            20.4.6.4. Sales Footprint

            20.4.6.5. SWOT Analysis

            20.4.6.6. Strategy Overview

                20.4.6.6.1. Marketing Strategy

                20.4.6.6.2. Product Strategy

                20.4.6.6.3. Channel Strategy

        20.4.7. Summers Laboratories, Inc

            20.4.7.1. Overview

            20.4.7.2. Product Portfolio

            20.4.7.3. Key Financials

            20.4.7.4. Sales Footprint

            20.4.7.5. SWOT Analysis

            20.4.7.6. Strategy Overview

                20.4.7.6.1. Marketing Strategy

                20.4.7.6.2. Product Strategy

                20.4.7.6.3. Channel Strategy

        20.4.8. SkinCeuticals

            20.4.8.1. Overview

            20.4.8.2. Product Portfolio

            20.4.8.3. Key Financials

            20.4.8.4. Sales Footprint

            20.4.8.5. SWOT Analysis

            20.4.8.6. Strategy Overview

                20.4.8.6.1. Marketing Strategy

                20.4.8.6.2. Product Strategy

                20.4.8.6.3. Channel Strategy

        20.4.9. Dermalogica

            20.4.9.1. Overview

            20.4.9.2. Product Portfolio

            20.4.9.3. Key Financials

            20.4.9.4. Sales Footprint

            20.4.9.5. SWOT Analysis

            20.4.9.6. Strategy Overview

                20.4.9.6.1. Marketing Strategy

                20.4.9.6.2. Product Strategy

                20.4.9.6.3. Channel Strategy

        20.4.10. L'Oréal S.A.

            20.4.10.1. Overview

            20.4.10.2. Product Portfolio

            20.4.10.3. Key Financials

            20.4.10.4. Sales Footprint

            20.4.10.5. SWOT Analysis

            20.4.10.6. Strategy Overview

                20.4.10.6.1. Marketing Strategy

                20.4.10.6.2. Product Strategy

                20.4.10.6.3. Channel Strategy

21. Assumptions and Acronyms Used

22. Research Methodology

List of Tables

Table 01: Global Market Value (US$ Million) Analysis and Forecast 2017 to 2033, by Product

Table 02: Global Market Volume (Units) Analysis and Forecast 2017 to 2033, by Product

Table 03: Global Market Value (US$ Million) Analysis and Forecast 2017 to 2033, by Distribution Channel

Table 04: Global Market Value (US$ Million) Analysis and Forecast 2017 to 2033, by Region

Table 05: North America Market Value (US$ Million) Analysis 2017 to 2022 and Forecast 2023 to 2033, by Country

Table 06: North America Market Value (US$ Million) Analysis and Forecast 2017 to 2033, by Product

Table 07: North America Market Volume (Units) Analysis and Forecast 2017 to 2033, by Product

Table 08: North America Market Value (US$ Million) Analysis and Forecast 2017 to 2033, by Distribution Channel

Table 09: Latin America Market Value (US$ Million) Analysis 2017 to 2022 and Forecast 2023 to 2033, by Country

Table 10: Latin America Market Value (US$ Million) Analysis and Forecast 2017 to 2033, by Product

Table 11: Latin America Market Volume (Units) Analysis and Forecast 2017 to 2033, by Product

Table 12: Latin America Market Value (US$ Million) Analysis and Forecast 2017 to 2033, by Distribution Channel

Table 13: Europe Market Value (US$ Million) Analysis 2017 to 2022 and Forecast 2023 to 2033, by Country

Table 14: Europe Market Value (US$ Million) Analysis and Forecast 2017 to 2033, by Product

Table 15: Europe Market Volume (Units) Analysis and Forecast 2017 to 2033, by Product

Table 16: Europe Market Value (US$ Million) Analysis and Forecast 2017 to 2033, by Distribution Channel

Table 17: South Asia Market Value (US$ Million) Analysis 2017 to 2022 and Forecast 2023 to 2033, by Country

Table 18: South Asia Market Value (US$ Million) Analysis and Forecast 2017 to 2033, by Product

Table 19: South Asia Market Volume (Units) Analysis and Forecast 2017 to 2033, by Product

Table 20: South Asia Market Value (US$ Million) Analysis and Forecast 2017 to 2033, by Distribution Channel

Table 21: East Asia Market Value (US$ Million) Analysis 2017 to 2022 and Forecast 2023 to 2033, by Country

Table 22: East Asia Market Value (US$ Million) Analysis and Forecast 2017 to 2033, by Product

Table 23: East Asia Market Volume (Units) Analysis and Forecast 2017 to 2033, by Product

Table 24: East Asia Market Value (US$ Million) Analysis and Forecast 2017 to 2033, by Distribution Channel

Table 25: Oceania Market Value (US$ Million) Analysis 2017 to 2022 and Forecast 2023 to 2033, by Country

Table 26: Oceania Market Value (US$ Million) Analysis and Forecast 2017 to 2033, by Product

Table 27: Oceania Market Volume (Units) Analysis and Forecast 2017 to 2033, by Product

Table 28: Oceania Market Value (US$ Million) Analysis and Forecast 2017 to 2033, by Distribution Channel

Table 29: Middle East and Africa Market Value (US$ Million) Analysis 2017 to 2022 and Forecast 2023 to 2033, by Country

Table 30: Middle East and Africa Market Value (US$ Million) Analysis and Forecast 2017 to 2033, by Product

Table 31: Middle East and Africa Market Volume (Units) Analysis and Forecast 2017 to 2033, by Product

Table 32: Middle East and Africa Market Value (US$ Million) Analysis and Forecast 2017 to 2033, by Distribution Channel

List of Charts

Figure 01: Global Market Volume (Units), 2017 to 2022

Figure 02: Global Market Volume (Units) & Y-o-Y Growth (%) Analysis, 2023 to 2033

Figure 03: Pricing Analysis per unit (US$), in 2022

Figure 04: Pricing Forecast per unit (US$), in 2033

Figure 05: Global Market Value (US$ Million) Analysis, 2017 to 2022

Figure 06: Global Market Forecast & Y-o-Y Growth, 2023 to 2033

Figure 07: Global Market Absolute $ Opportunity (US$ Million) Analysis, 2022 to 2033

Figure 08: Global Market Value Share (%) Analysis 2023 and 2033, by Product

Figure 09: Global Market Y-o-Y Growth (%) Analysis 2022-2033, by Product

Figure 10: Global Market Attractiveness Analysis 2023 to 2033, by Product

Figure 11: Global Market Value Share (%) Analysis 2023 and 2033, by Distribution Channel

Figure 12: Global Market Y-o-Y Growth (%) Analysis 2022-2033, by Distribution Channel

Figure 13: Global Market Attractiveness Analysis 2023 to 2033, by Distribution Channel

Figure 14: Global Market Value Share (%) Analysis 2023 and 2033, by Region

Figure 15: Global Market Y-o-Y Growth (%) Analysis 2022-2033, by Region

Figure 16: Global Market Attractiveness Analysis 2023 to 2033, by Region

Figure 17: North America Market Value (US$ Million) Analysis, 2017 to 2022

Figure 18: North America Market Value (US$ Million) Forecast, 2023-2033

Figure 19: North America Market Value Share, by Product (2023 E)

Figure 20: North America Market Value Share, by Distribution Channel (2023 E)

Figure 21: North America Market Value Share, by Country (2023 E)

Figure 22: North America Market Attractiveness Analysis by Product, 2023 to 2033

Figure 23: North America Market Attractiveness Analysis by Distribution Channel, 2023 to 2033

Figure 24: North America Market Attractiveness Analysis by Country, 2023 to 2033

Figure 25: USA Market Value Proportion Analysis, 2022

Figure 26: Global Vs. USA Growth Comparison

Figure 27: USA Market Share Analysis (%) by Product, 2022 & 2033

Figure 28: USA Market Share Analysis (%) by Distribution Channel, 2022 & 2033

Figure 29: Canada Market Value Proportion Analysis, 2022

Figure 30: Global Vs. Canada. Growth Comparison

Figure 31: Canada Market Share Analysis (%) by Product, 2022 & 2033

Figure 32: Canada Market Share Analysis (%) by Distribution Channel, 2022 & 2033

Figure 33: Latin America Market Value (US$ Million) Analysis, 2017 to 2022

Figure 34: Latin America Market Value (US$ Million) Forecast, 2023-2033

Figure 35: Latin America Market Value Share, by Product (2023 E)

Figure 36: Latin America Market Value Share, by Distribution Channel (2023 E)

Figure 37: Latin America Market Value Share, by Country (2023 E)

Figure 38: Latin America Market Attractiveness Analysis by Product, 2023 to 2033

Figure 39: Latin America Market Attractiveness Analysis by Distribution Channel, 2023 to 2033

Figure 40: Latin America Market Attractiveness Analysis by Country, 2023 to 2033

Figure 41: Mexico Market Value Proportion Analysis, 2022

Figure 42: Global Vs Mexico Growth Comparison

Figure 43: Mexico Market Share Analysis (%) by Product, 2022 & 2033

Figure 44: Mexico Market Share Analysis (%) by Distribution Channel, 2022 & 2033

Figure 45: Brazil Market Value Proportion Analysis, 2022

Figure 46: Global Vs. Brazil. Growth Comparison

Figure 47: Brazil Market Share Analysis (%) by Product, 2022 & 2033

Figure 48: Brazil Market Share Analysis (%) by Distribution Channel, 2022 & 2033

Figure 49: Argentina Market Value Proportion Analysis, 2022

Figure 50: Global Vs Argentina Growth Comparison

Figure 51: Argentina Market Share Analysis (%) by Product, 2022 & 2033

Figure 52: Argentina Market Share Analysis (%) by Distribution Channel, 2022 & 2033

Figure 53: Europe Market Value (US$ Million) Analysis, 2017 to 2022

Figure 54: Europe Market Value (US$ Million) Forecast, 2023-2033

Figure 55: Europe Market Value Share, by Product (2023 E)

Figure 56: Europe Market Value Share, by Distribution Channel (2023 E)

Figure 57: Europe Market Value Share, by Country (2023 E)

Figure 58: Europe Market Attractiveness Analysis by Product, 2023 to 2033

Figure 59: Europe Market Attractiveness Analysis by Distribution Channel, 2023 to 2033

Figure 60: Europe Market Attractiveness Analysis by Country, 2023 to 2033

Figure 61: UK Market Value Proportion Analysis, 2022

Figure 62: Global Vs. UK Growth Comparison

Figure 63: UK Market Share Analysis (%) by Product, 2022 & 2033

Figure 64: UK Market Share Analysis (%) by Distribution Channel, 2022 & 2033

Figure 65: Germany Market Value Proportion Analysis, 2022

Figure 66: Global Vs. Germany Growth Comparison

Figure 67: Germany Market Share Analysis (%) by Product, 2022 & 2033

Figure 68: Germany Market Share Analysis (%) by Distribution Channel, 2022 & 2033

Figure 69: Italy Market Value Proportion Analysis, 2022

Figure 70: Global Vs. Italy Growth Comparison

Figure 71: Italy Market Share Analysis (%) by Product, 2022 & 2033

Figure 72: Italy Market Share Analysis (%) by Distribution Channel, 2022 & 2033

Figure 73: France Market Value Proportion Analysis, 2022

Figure 74: Global Vs France Growth Comparison

Figure 75: France Market Share Analysis (%) by Product, 2022 & 2033

Figure 76: France Market Share Analysis (%) by Distribution Channel, 2022 & 2033

Figure 77: Spain Market Value Proportion Analysis, 2022

Figure 78: Global Vs Spain Growth Comparison

Figure 79: Spain Market Share Analysis (%) by Product, 2022 & 2033

Figure 80: Spain Market Share Analysis (%) by Distribution Channel, 2022 & 2033

Figure 81: Russia Market Value Proportion Analysis, 2022

Figure 82: Global Vs Russia Growth Comparison

Figure 83: Russia Market Share Analysis (%) by Product, 2022 & 2033

Figure 84: Russia Market Share Analysis (%) by Distribution Channel, 2022 & 2033

Figure 85: BENELUX Market Value Proportion Analysis, 2022

Figure 86: Global Vs BENELUX Growth Comparison

Figure 87: BENELUX Market Share Analysis (%) by Product, 2022 & 2033

Figure 88: BENELUX Market Share Analysis (%) by Distribution Channel, 2022 & 2033

Figure 89: East Asia Market Value (US$ Million) Analysis, 2017 to 2022

Figure 90: East Asia Market Value (US$ Million) Forecast, 2023-2033

Figure 91: East Asia Market Value Share, by Product (2023 E)

Figure 92: East Asia Market Value Share, by Distribution Channel (2023 E)

Figure 93: East Asia Market Value Share, by Country (2023 E)

Figure 94: East Asia Market Attractiveness Analysis by Product, 2023 to 2033

Figure 95: East Asia Market Attractiveness Analysis by Distribution Channel, 2023 to 2033

Figure 96: East Asia Market Attractiveness Analysis by Country, 2023 to 2033

Figure 97: China Market Value Proportion Analysis, 2022

Figure 98: Global Vs. China Growth Comparison

Figure 99: China Market Share Analysis (%) by Product, 2022 & 2033

Figure 100: China Market Share Analysis (%) by Distribution Channel, 2022 & 2033

Figure 101: Japan Market Value Proportion Analysis, 2022

Figure 102: Global Vs. Japan Growth Comparison

Figure 103: Japan Market Share Analysis (%) by Product, 2022 & 2033

Figure 104: Japan Market Share Analysis (%) by Distribution Channel, 2022 & 2033

Figure 105: South Korea Market Value Proportion Analysis, 2022

Figure 106: Global Vs South Korea Growth Comparison

Figure 107: South Korea Market Share Analysis (%) by Product, 2022 & 2033

Figure 108: South Korea Market Share Analysis (%) by Distribution Channel, 2022 & 2033

Figure 109: South Asia Market Value (US$ Million) Analysis, 2017 to 2022

Figure 110: South Asia Market Value (US$ Million) Forecast, 2023-2033

Figure 111: South Asia Market Value Share, by Product (2023 E)

Figure 112: South Asia Market Value Share, by Distribution Channel (2023 E)

Figure 113: South Asia Market Value Share, by Country (2023 E)

Figure 114: South Asia Market Attractiveness Analysis by Product, 2023 to 2033

Figure 115: South Asia Market Attractiveness Analysis by Distribution Channel, 2023 to 2033

Figure 116: South Asia Market Attractiveness Analysis by Country, 2023 to 2033

Figure 117: India Market Value Proportion Analysis, 2022

Figure 118: Global Vs. India Growth Comparison

Figure 119: India Market Share Analysis (%) by Product, 2022 & 2033

Figure 120: India Market Share Analysis (%) by Distribution Channel, 2022 & 2033

Figure 121: Indonesia Market Value Proportion Analysis, 2022

Figure 122: Global Vs. Indonesia Growth Comparison

Figure 123: Indonesia Market Share Analysis (%) by Product, 2022 & 2033

Figure 124: Indonesia Market Share Analysis (%) by Distribution Channel, 2022 & 2033

Figure 125: Malaysia Market Value Proportion Analysis, 2022

Figure 126: Global Vs. Malaysia Growth Comparison

Figure 127: Malaysia Market Share Analysis (%) by Product, 2022 & 2033

Figure 128: Malaysia Market Share Analysis (%) by Distribution Channel, 2022 & 2033

Figure 129: Thailand Market Value Proportion Analysis, 2022

Figure 130: Global Vs. Thailand Growth Comparison

Figure 131: Thailand Market Share Analysis (%) by Product, 2022 & 2033

Figure 132: Thailand Market Share Analysis (%) by Distribution Channel, 2022 & 2033

Figure 133: Oceania Market Value (US$ Million) Analysis, 2017 to 2022

Figure 134: Oceania Market Value (US$ Million) Forecast, 2023-2033

Figure 135: Oceania Market Value Share, by Product (2023 E)

Figure 136: Oceania Market Value Share, by Distribution Channel (2023 E)

Figure 137: Oceania Market Value Share, by Country (2023 E)

Figure 138: Oceania Market Attractiveness Analysis by Product, 2023 to 2033

Figure 139: Oceania Market Attractiveness Analysis by Distribution Channel, 2023 to 2033

Figure 140: Oceania Market Attractiveness Analysis by Country, 2023 to 2033

Figure 141: Australia Market Value Proportion Analysis, 2022

Figure 142: Global Vs. Australia Growth Comparison

Figure 143: Australia Market Share Analysis (%) by Product, 2022 & 2033

Figure 144: Australia Market Share Analysis (%) by Distribution Channel, 2022 & 2033

Figure 145: New Zealand Market Value Proportion Analysis, 2022

Figure 146: Global Vs New Zealand Growth Comparison

Figure 147: New Zealand Market Share Analysis (%) by Product, 2022 & 2033

Figure 148: New Zealand Market Share Analysis (%) by Distribution Channel, 2022 & 2033

Figure 149: Middle East & Africa Market Value (US$ Million) Analysis, 2017 to 2022

Figure 150: Middle East & Africa Market Value (US$ Million) Forecast, 2023-2033

Figure 151: Middle East & Africa Market Value Share, by Product (2023 E)

Figure 152: Middle East & Africa Market Value Share, by Distribution Channel (2023 E)

Figure 153: Middle East & Africa Market Value Share, by Country (2023 E)

Figure 154: Middle East & Africa Market Attractiveness Analysis by Product, 2023 to 2033

Figure 155: Middle East & Africa Market Attractiveness Analysis by Distribution Channel, 2023 to 2033

Figure 156: Middle East & Africa Market Attractiveness Analysis by Country, 2023 to 2033

Figure 157: GCC Countries Market Value Proportion Analysis, 2022

Figure 158: Global Vs GCC Countries Growth Comparison

Figure 159: GCC Countries Market Share Analysis (%) by Product, 2022 & 2033

Figure 160: GCC Countries Market Share Analysis (%) by Distribution Channel, 2022 & 2033

Figure 161: Türkiye Market Value Proportion Analysis, 2022

Figure 162: Global Vs. Türkiye Growth Comparison

Figure 163: Türkiye Market Share Analysis (%) by Product, 2022 & 2033

Figure 164: Türkiye Market Share Analysis (%) by Distribution Channel, 2022 & 2033

Figure 165: South Africa Market Value Proportion Analysis, 2022

Figure 166: Global Vs. South Africa Growth Comparison

Figure 167: South Africa Market Share Analysis (%) by Product, 2022 & 2033

Figure 168: South Africa Market Share Analysis (%) by Distribution Channel, 2022 & 2033

Figure 169: Northern Africa Market Value Proportion Analysis, 2022

Figure 170: Global Vs Northern Africa Growth Comparison

Figure 171: Northern Africa Market Share Analysis (%) by Product, 2022 & 2033

Figure 172: Northern Africa Market Share Analysis (%) by Distribution Channel, 2022 & 2033

Explore Healthcare Insights

View Reports