Dermal Fillers and Botulinum Toxin Market
Market Insights on Dermal Fillers and Botulinum Toxin covering sales outlook, demand forecast & up-to-date key trends
Dermal Fillers and Botulinum Toxin Market By Application (Aesthetic Volume Restoration, Wrinkle Reduction), Product Type (Hyaluronic Acid Based Fillers, Non-Hyaluronic Acid Based Fillers, Botulinum Toxin) & Region - Forecast 2017 - 2027
Celebrity endorsements and consumer market are an important growth driver
Several dermatology association members i.e. service providers and clinics have seen an increased uptake of aesthetic procedures in the year 2016. The American Academy of Facial Plastic and Reconstructive Surgery estimates that more than 80% of surgeons believed a celebrity endorsement played a vital role in the patient being willing to go under the knife and undergo treatment.
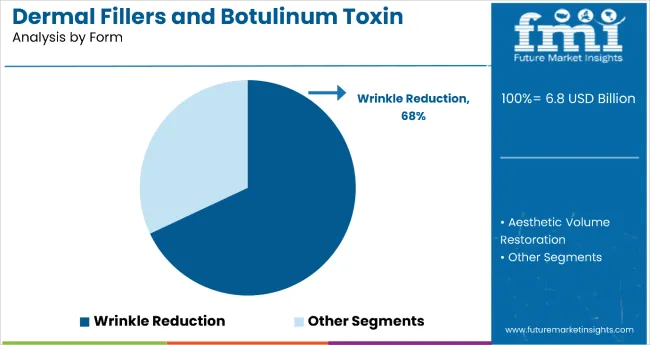
The most common procedures are the application of botilinum toxin leading to wrinkle reduction by way of volume restoration. Social and mainstream media have also had an outsized impact on the customer psyche, influencing them to start these treatments early to avoid the onset of ageing or delay it as much as possible.
Let us know your requirement to get
100% FREE customization
Rising preference for non-invasive surgical procedures across the globe
The demand for minimally invasive cosmetic treatment, a phenomenon seen worldwide, is poised to benefit the Dermal Fillers and Botulinum Toxin Market. Dermatologists prefer to treat skin diseases through less invasive procedures or topical applications in place of surgical methods.
The non-surgical procedures that witnessed a dramatic spike in popularity in 2016 were dermal fillers with hyaluronic acid and botulinum toxin. Injectable treatments are chosen because of greater awareness of measurable improvement in procedures and more information dissemination.
Hyaluronic Acid and Botulinum Toxin key in dermal fillers and botulinum toxin market
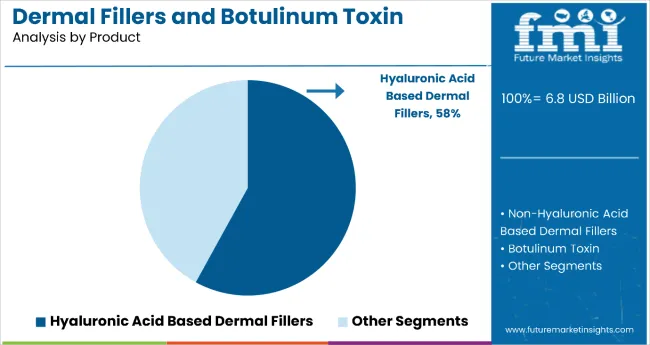
Botulinum Toxin is the largest segment in the Dermal Fillers and Botulinum Toxin Market by product type and is larger than the other two segments combined. It is expected to push past US$ 5 Bn by the end of the forecast period making it imperative for key stakeholders in the Dermal Fillers and Botulinum Toxin Market to target. However, the Hyaluronic Acid segment is anticipated to witness a high CAGR of 8.5% from 2017-2027, which companies would do well to take note of while devising their Hyaluronic Acid Dermal Fillers and Botulinum Toxin Market strategies.
The Botulinum Toxin segment dominated the global Dermal Fillers and Botulinum Toxin market by product type in terms of revenue in 2017, and this trend is projected to continue throughout the forecast period. Botulinum Toxin is the most attractive segment, with a market attractiveness index of 1.6 over the forecast period.
Find your sweet spots for generating winning opportunities in this market.
Talk to AnalystInadequate professional training serious concern in the dermal fillers and botulinum toxin market
The treatments are sometimes administered incorrectly to patients and this can lead to serious complications with extremely adverse side-effects. Fillers are injected around the temple region of the head to even out fine lines and reduce crow’s feet. Patients could experience symptoms such as swelling, fever, and extreme pain within two days, especially if the injection punctures a facial vein during the process of administration.
These unfortunate accidents would need patients to be administered a dose of antibiotics or steroids that have their own additional side-effects. At present, a limited number of medical institutions offer the required advanced training and this is a particular problem in resource-starved, poorer countries in the world where such treatments are more of a luxury only enjoyed by the privileged few.
High cost a major restraint in the dermal fillers and botulinum toxin market
The cost of botolinum toxin treatments is on the higher side and multiple sessions are necessary to achieve the desired results. The surgeon or physician cost alone is approximately half the cost in the case of dermal fillers; and fillers such as HA, PLLA, CaHA last for a maximum period of two years.
Most of them are naturally occurring in the body and they get degraded quickly, which is why multiple sessions are needed, thereby driving up the cost of treatment substantially. Frequent visits to the surgeon or physician is the norm that could potentially stifle the growth prospects of the global Dermal Fillers and Botulinum Toxin Market.

An unified Market Research Subscription Platform, built for today’s disparate research needs.
Dermal Fillers and Botulinum Toxin Market: Taxonomy
Region:
- North America
- Latin America
- Western Europe
- Eastern Europe
- APEJ
- Japan
- MEA
Application:
- Aesthetic Volume Restoration
- Wrinkle Reduction
Product Type:
- Hyaluronic Acid Based Fillers
- Non-Hyaluronic Acid Based Fillers
- Botulinum Toxin
Frequently Asked Questions
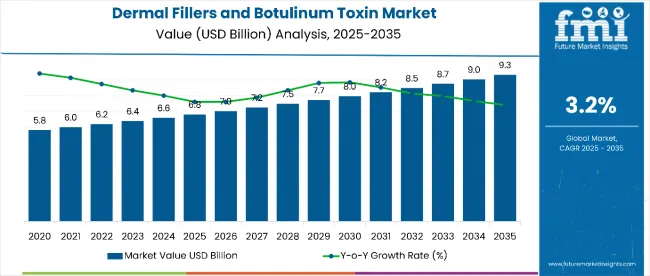
The Dermal Fillers and Botulinum Toxin market is expected to grow at an 6.3% CAGR from 2022 to 2032
By 2022-end, Dermal Fillers and Botulinum Toxin sales are likely to reach US$ 5.9 Billion
Allergan PLC, Ipsen, Merz Pharma GmbH & Co., KGaA, and Daewoong Pharmaceuticals, are some leading Dermal Fillers and Botulinum Toxin market manufacturers.
Table of Content
1. Executive Summary
1.1. Market Overview
1.2. Market Analysis
1.3. FMI Analysis and Recommendations
1.4. Wheel of Fortune
2. Market Introduction
2.1. Market Taxonomy
2.2. Market Definition
3. Market View Point
3.1. Macro-Economic Factors
3.2. Opportunity Analysis
3.3. U.S FDA Regulatory Approval for Medical Devices
3.4. Europe Regulatory Approval for Medical Devices
3.5. U.S. FDA approved Dermal Fillers
3.6. U.S. Dermal Fillers and Botulinum Toxin: Key Regulations
4. North America Dermal Fillers and Botulinum Toxin Market Analysis 2012–2016 and Forecast 2017–2027
4.1. Introduction
4.2. Regional Market Dynamics
4.2.1. Drivers
4.2.2. Restraints
4.2.3. Trends
4.3. Historical Market Size (US$ Mn) Analysis By Country, 2012-2016
4.3.1. U.S.
4.3.2. Canada
4.4. Market Size (US$ Mn) Forecast By Country, 2017-2027
4.4.1. U.S.
4.4.2. Canada
4.5. Historical Market Size (US$ Mn) and Volume Analysis By Product Type, 2012-2016
4.5.1. Hyaluronic Acid Based Dermal Fillers
4.5.2. Non-hyaluronic Acid Based Dermal Fillers
4.5.3. Botulinum Toxin
4.6. Market Size (US$ Mn) and Volume Forecast By Product Type, 2017-2027
4.6.1. Hyaluronic Acid Based Dermal Fillers
4.6.2. Non-hyaluronic Acid Based Dermal Fillers
4.6.3. Botulinum Toxin
4.7. Historical Market Size (US$ Mn) Analysis by Application, 2012-2016
4.7.1. Aesthetic Volume Restoration
4.7.2. Wrinkle Reduction
4.8. Market Size (US$ Mn) Forecast, by Application, 2017-2027
4.8.1. Aesthetic Volume Restoration
4.8.2. Wrinkle Reduction
4.9. Drivers and Restraints: Impact Analysis
4.10. Market Attractiveness Analysis
4.10.1. By Country
4.10.2. By Product Type
4.10.3. By Application
4.11. Key Representative Market Presence (Intensity Map)
5. Latin America Dermal Fillers and Botulinum Toxin Market Analysis 2012–2016 and Forecast 2017–2027
5.1. Introduction
5.2. Regional Market Dynamics
5.2.1. Drivers
5.2.2. Restraints
5.2.3. Trends
5.3. Historical Market Size (US$ Mn) Analysis By Country, 2012-2016
5.3.1. Brazil
5.3.2. Mexico
5.3.3. Argentina
5.3.4. Rest of Latin America
5.4. Market Size (US$ Mn) Forecast By Country, 2017-2027
5.4.1. Brazil
5.4.2. Mexico
5.4.3. Argentina
5.4.4. Rest of Latin America
5.5. Historical Market Size (US$ Mn) and Volume Analysis By Product Type, 2012-2016
5.5.1. Hyaluronic Acid Based Dermal Fillers
5.5.2. Non-hyaluronic Acid Based Dermal Fillers
5.5.3. Botulinum Toxin
5.6. Market Size (US$ Mn) and Volume Forecast By Product Type, 2017-2027
5.6.1. Hyaluronic Acid Based Dermal Fillers
5.6.2. Non-hyaluronic Acid Based Dermal Fillers
5.6.3. Botulinum Toxin
5.7. Historical Market Size (US$ Mn) Analysis by Application, 2012-2016
5.7.1. Aesthetic Volume Restoration
5.7.2. Wrinkle Reduction
5.8. Market Size (US$ Mn) Forecast, by Application, 2017-2027
5.8.1. Aesthetic Volume Restoration
5.8.2. Wrinkle Reduction
5.9. Drivers and Restraints: Impact Analysis
5.10. Market Attractiveness Analysis
5.10.1. By Country
5.10.2. By Product Type
5.10.3. By Application
5.11. Key Representative Market Presence (Intensity Map)
6. Western Europe Dermal Fillers and Botulinum Toxin Market Analysis 2012–2016 and Forecast 2017–2027
6.1. Introduction
6.2. Regional Market Dynamics
6.2.1. Drivers
6.2.2. Restraints
6.2.3. Trends
6.3. Historical Market Size (US$ Mn) Analysis By Country, 2012-2016
6.3.1. U.K.
6.3.2. Germany
6.3.3. France
6.3.4. Italy
6.3.5. Spain
6.3.6. Nordics
6.3.7. BENELUX
6.3.8. Rest of Western Europe
6.4. Market Size (US$ Mn) Forecast By Country, 2017-2027
6.4.1. U.K.
6.4.2. Germany
6.4.3. France
6.4.4. Italy
6.4.5. Spain
6.4.6. Nordics
6.4.7. BENELUX
6.4.8. Rest of Western Europe
6.5. Historical Market Size (US$ Mn) and Volume Analysis By Product Type, 2012-2016
6.5.1. Hyaluronic Acid Based Dermal Fillers
6.5.2. Non-hyaluronic Acid Based Dermal Fillers
6.5.3. Botulinum Toxin
6.6. Market Size (US$ Mn) and Volume Forecast By Product Type, 2017-2027
6.6.1. Hyaluronic Acid Based Dermal Fillers
6.6.2. Non-hyaluronic Acid Based Dermal Fillers
6.6.3. Botulinum Toxin
6.7. Historical Market Size (US$ Mn) Analysis by Application, 2012-2016
6.7.1. Aesthetic Volume Restoration
6.7.2. Wrinkle Reduction
6.8. Market Size (US$ Mn) Forecast, by Application, 2017-2027
6.8.1. Aesthetic Volume Restoration
6.8.2. Wrinkle Reduction
6.9. Drivers and Restraints: Impact Analysis
6.10. Market Attractiveness Analysis
6.10.1. By Country
6.10.2. By Product Type
6.10.3. By Application
6.11. Key Representative Market Presence (Intensity Map)
7. Eastern Europe Dermal Fillers and Botulinum Toxin Market Analysis 2012–2016 and Forecast 2017–2027
7.1. Introduction
7.2. Regional Market Dynamics
7.2.1. Drivers
7.2.2. Restraints
7.2.3. Trends
7.3. Historical Market Size (US$ Mn) Analysis By Country, 2012-2016
7.3.1. Russia
7.3.2. Poland
7.3.3. Rest of Eastern Europe
7.4. Market Size (US$ Mn) Forecast By Country,2017-2027
7.4.1. Russia
7.4.2. Poland
7.4.3. Rest of Eastern Europe
7.5. Historical Market Size (US$ Mn) and Volume Analysis By Product Type, 2012-2016
7.5.1. Hyaluronic Acid Based Dermal Fillers
7.5.2. Non-hyaluronic Acid Based Dermal Fillers
7.5.3. Botulinum Toxin
7.6. Market Size (US$ Mn) and Volume Forecast By Product Type, 2017-2027
7.6.1. Hyaluronic Acid Based Dermal Fillers
7.6.2. Non-hyaluronic Acid Based Dermal Fillers
7.6.3. Botulinum Toxin
7.7. Historical Market Size (US$ Mn) Analysis by Application, 2012-2016
7.7.1. Aesthetic Volume Restoration
7.7.2. Wrinkle Reduction
7.8. Market Size (US$ Mn) Forecast, by Application, 2017-2027
7.8.1. Aesthetic Volume Restoration
7.8.2. Wrinkle Reduction
7.9. Drivers and Restraints: Impact Analysis
7.10. Market Attractiveness Analysis
7.10.1. By Country
7.10.2. By Product Type
7.10.3. By Application
7.11. Key Representative Market Presence (Intensity Map)
8. Asia-Pacific Excluding Japan (APEJ) Dermal Fillers and Botulinum Toxin Market Analysis 2012–2016 and Forecast 2017–2027
8.1. Introduction
8.2. Regional Market Dynamics
8.2.1. Drivers
8.2.2. Restraints
8.2.3. Trends
8.3. Historical Market Size (US$ Mn) Analysis By Country, 2012-2016
8.3.1. China
8.3.2. India
8.3.3. Australia and New Zealand
8.3.4. ASEAN
8.3.5. Rest of APEJ
8.4. Market Size (US$ Mn) Forecast By Country, 2017-2027
8.4.1. China
8.4.2. India
8.4.3. Australia and New Zealand
8.4.4. ASEAN
8.4.5. Rest of APEJ
8.5. Historical Market Size (US$ Mn) and Volume Analysis By Product Type, 2012-2016
8.5.1. Hyaluronic Acid Based Dermal Fillers
8.5.2. Non-hyaluronic Acid Based Dermal Fillers
8.5.3. Botulinum Toxin
8.6. Market Size (US$ Mn) and Volume Forecast By Product Type, 2017-2027
8.6.1. Hyaluronic Acid Based Dermal Fillers
8.6.2. Non-hyaluronic Acid Based Dermal Fillers
8.6.3. Botulinum Toxin
8.7. Historical Market Size (US$ Mn) Analysis by Application, 2012-2016
8.7.1. Aesthetic Volume Restoration
8.7.2. Wrinkle Reduction
8.8. Market Size (US$ Mn) Forecast, by Application, 2017-2027
8.8.1. Aesthetic Volume Restoration
8.8.2. Wrinkle Reduction
8.9. Drivers and Restraints: Impact Analysis
8.10. Market Attractiveness Analysis
8.10.1. By Country
8.10.2. By Product Type
8.10.3. By Application
8.11. Key Representative Market Presence (Intensity Map)
9. Japan Dermal Fillers and Botulinum Toxin Market Analysis 2012–2016 and Forecast 2017–2027
9.1. Introduction
9.2. Historical Market Size (US$ Mn) and Volume Analysis By Product Type, 2012-2016
9.2.1. Hyaluronic Acid Based Dermal Fillers
9.2.2. Non-hyaluronic Acid Based Dermal Fillers
9.2.3. Botulinum Toxin
9.3. Market Size (US$ Mn) and Volume Forecast By Product Type, 2017-2027
9.3.1. Hyaluronic Acid Based Dermal Fillers
9.3.2. Non-hyaluronic Acid Based Dermal Fillers
9.3.3. Botulinum Toxin
9.4. Historical Market Size (US$ Mn) Analysis by Application, 2012-2016
9.4.1. Aesthetic Volume Restoration
9.4.2. Wrinkle Reduction
9.5. Market Size (US$ Mn) Forecast, by Application, 2017-2027
9.5.1. Aesthetic Volume Restoration
9.5.2. Wrinkle Reduction
9.6. Drivers and Restraints: Impact Analysis
9.7. Market Attractiveness Analysis
9.7.1. By Product Type
9.7.2. By Application
9.8. Key Representative Market Presence (Intensity Map)
10. Middle East and Africa Dermal Fillers and Botulinum Toxin Market Analysis 2012–2016 and Forecast 2017–2027
10.1. Introduction
10.2. Regional Market Dynamics
10.2.1. Drivers
10.2.2. Restraints
10.2.3. Trends
10.3. Historical Market Size (US$ Mn) Analysis By Country, 2012-2016
10.3.1. GCC Countries
10.3.2. South Africa
10.3.3. Rest of MEA
10.4. Market Size (US$ Mn) Forecast By Country, 2017- 2027
10.4.1. GCC Countries
10.4.2. South Africa
10.4.3. Rest of MEA
10.5. Historical Market Size (US$ Mn) Analysis By Product Type, 2012-2016
10.5.1. Hyaluronic Acid Based Dermal Fillers
10.5.2. Non-hyaluronic Acid Based Dermal Fillers
10.5.3. Botulinum Toxin
10.6.Market Size (US$ Mn) Forecast By Product Type, 2017-2027
10.6.1. Hyaluronic Acid Based Dermal Fillers
10.6.2. Non-hyaluronic Acid Based Dermal Fillers
10.6.3. Botulinum Toxin
10.7.Historical Market Size (US$ Mn) Analysis by Application, 2012-2016
10.7.1. Aesthetic Volume Restoration
10.7.2. Wrinkle Reduction
10.8.Market Size (US$ Mn) Forecast, by Application, 2017-2027
10.8.1. Aesthetic Volume Restoration
10.8.2. Wrinkle Reduction
10.9. Drivers and Restraints: Impact Analysis
10.10. Market Attractiveness Analysis
10.10.1. By Country
10.10.2. By Product Type
10.10.3. By Application
10.11. Key Representative Market Presence (Intensity Map)
11. Forecast Factors: Relevance and Impact
12. Forecast Assumptions
13. Competition Landscape
13.1. Market Structure
13.2. Market Share Analysis
13.3. Competition Intensity Mapping By Market Taxonomy
13.4. Competition Dashboard
13.5. Company Profiles (Details – Overview, Financials, Strategy, Recent Developments
13.5.1. Allergan plc.
13.5.2. Galderma SA
13.5.3. Merz Pharma GmbH & Co. KGaA
13.5.4. Anika Therapeutics, Inc.
13.5.5. Suneva Medical, Inc.
13.5.6. Speciality European Pharma
13.5.7. HUGEL, Inc.
13.5.8. Grex Pharma SaS
13.5.9. Daewoong Pharmaceuticals
13.5.10. Medy-Tox Inc.
13.5.11. TEOXANE Laboratories
13.5.12. SciVision Biotech Inc.
14. Global Dermal Fillers and Botulinum Toxin Market Analysis 2012–2016 and Forecast 2017–2027, By Region
14.1. Introduction / Key Findings
14.2. Historical Market Size (US$ Mn) Analysis By Region, 2012-2016
14.2.1. North America
14.2.2. Latin America
14.2.3. Western Europe
14.2.4. Eastern Europe
14.2.5. Asia Pacific Excluding Japan
14.2.6. Japan
14.2.7. Middle East and Africa
14.3. Market Size (US$ Mn) Forecast By Region, 2017-2027
14.3.1. North America
14.3.2. Latin America
14.3.3. Western Europe
14.3.4. Eastern Europe
14.3.5. Asia Pacific Excluding Japan
14.3.6. Japan
14.3.7. Middle East and Africa
14.4. Market Attractiveness Analysis By Region
15. Global Dermal Fillers and Botulinum Toxin Market Analysis 2012–2016 and Forecast 2017–2027, By Product Type
15.1. Introduction
15.2. Historical Market Size (US$ Mn) and Volume Analysis By Product Type, 2012-2016
15.2.1. Hyaluronic Acid Based Dermal Fillers
15.2.2. Non-hyaluronic Acid Based Dermal Fillers
15.2.3. Botulinum Toxin
15.3. Market Size (US$ Mn) and Volume Forecast By Product Type,2017-2027
15.3.1. Hyaluronic Acid Based Dermal Fillers
15.3.2. Non-hyaluronic Acid Based Dermal Fillers
15.3.3. Botulinum Toxin
15.4. Market Attractiveness Analysis by Product Type
16. Global Dermal Fillers and Botulinum Toxin Market Analysis 2012–2016 and Forecast 2017–2027, By Application
16.1. Introduction
16.2. Historical Market Size (US$ Mn) Analysis, by Application, 2012-2016
16.2.1. Aesthetic Volume Restoration
16.2.2. Wrinkle Reduction
16.3. Market Size (US$ Mn) Forecast, by Application, 2017-2027
16.3.1. Aesthetic Volume Restoration
16.3.2. Wrinkle Reduction
16.4. Market Attractiveness Analysis by Application
17. Global Market Analysis 2012–2016 and Forecast 2017–2027
17.1. Market Size and Y-o-Y Growth
17.2. Absolute $ Opportunity
17.3. Value Chain
18. Assumptions and Acronyms Used
19. Research Methodology
Let us know your requirement to get
100% FREE customization
List of Tables
Table 01: Global Dermal Fillers and Botulinum Toxin Market – Global FDA Dermal Fillers
Table 02: North America Dermal Fillers and Botulinum Toxin Market Value (US$ Mn) Analysis-2012–2016 and Forecast 2017–2027, By Product Type
Table 03: North America Dermal Fillers Market Volume (1 ml vial) Analysis 2012–2016 and Forecast 2017–2027, By Product Type
Table 04: North America Botulinum Toxin Market Volume (100 unit vial) Analysis 2012–2016 and Forecast 2017–2027, By Product Type
Table 05: North America Dermal Fillers and Botulinum Toxin Market Value (US$ Mn) Analysis 2012–2016 and Forecast 2017–2027, By Application
Table 06: North America Dermal Fillers and Botulinum Toxin Market Value (US$ Mn) Analysis 2012–2016 and Forecast 2017–2027, By Country
Table 07: North America Dermal Fillers and Botulinum Toxin Participants Presence (Intensity Mapping)
Table 08: Latin America Dermal Fillers and Botulinum Toxin Market Value (US$ Mn) Analysis-2012–2016 and Forecast 2017–2027, By Product Type
Table 09: Latin America Dermal Fillers Market Volume (1 ml vial) Analysis 2012–2016 and Forecast 2017–2027, By Product Type
Table 10: Latin America Botulinum Toxin Market Volume (100 unit vial) Analysis 2012–2016 and Forecast 2017–2027, By Product Type
Table 11: Latin America Dermal Fillers and Botulinum Toxin Market Value (US$ Mn) Analysis 2012–2016 and Forecast 2017–2027, By Application
Table 12: Latin America Dermal Fillers and Botulinum Toxin Market Value (US$ Mn) Analysis 2012–2016 and Forecast 2017–2027, By Country
Table 13: Latin America Dermal Fillers and Botulinum Toxin Participants Presence (Intensity Mapping)
Table 14: Western Europe Dermal Fillers and Botulinum Toxin Market Value (US$ Mn) Analysis-2012–2016 and Forecast 2017–2027, By Product Type
Table 15: Western Europe Dermal Fillers Market Volume (1 ml vial) Analysis 2012–2016 and Forecast 2017–2027, By Product Type
Table 16: Western Europe Botulinum Toxin Market Volume (100 unit vial) Analysis 2012–2016 and Forecast 2017–2027, By Product Type
Table 17: Western Europe Dermal Fillers and Botulinum Toxin Market Value (US$ Mn) Analysis 2012–2016 and Forecast 2017–2027, By Application
Table 18: Western Europe Dermal Fillers and Botulinum Toxin Market Value (US$ Mn) Analysis 2012–2016 and Forecast 2017–2027, By Country
Table 19: Western Europe Dermal Fillers and Botulinum Toxin Participants Presence (Intensity Mapping)
Table 20: Eastern Europe Dermal Fillers and Botulinum Toxin Market Value (US$ Mn) Analysis-2012–2016 and Forecast 2017–2027, By Product Type
Table 21: Eastern Europe Dermal Fillers Market Volume (1 ml vial) Analysis 2012–2016 and Forecast 2017–2027, By Product Type
Table 22: Eastern Europe Botulinum Toxin Market Volume (100 unit vial) Analysis 2012–2016 and Forecast 2017–2027, By Product Type
Table 23: Eastern Europe Dermal Fillers and Botulinum Toxin Market Value (US$ Mn) Analysis 2012–2016 and Forecast 2017–2027, By Application
Table 24: Eastern Europe Dermal Fillers and Botulinum Toxin Market Value (US$ Mn) Analysis 2012–2016 and Forecast 2017–2027, By Country
Table 25: Eastern Europe Dermal Fillers and Botulinum Toxin Participants Presence (Intensity Mapping)
Table 26: APEJ Dermal Fillers and Botulinum Toxin Market Value (US$ Mn) Analysis-2012–2016 and Forecast 2017–2027, By Product Type
Table 27: APEJ Dermal Fillers Market Volume (1 ml vial) Analysis 2012–2016 and Forecast 2017–2027, By Product Type
Table 28: APEJ Botulinum Toxin Market Volume (100 unit vial) Analysis 2012–2016 and Forecast 2017–2027, By Product Type
Table 29: APEJ Dermal Fillers and Botulinum Toxin Market Value (US$ Mn) Analysis 2012–2016 and Forecast 2017–2027, By Application
Table 30: APEJ Dermal Fillers and Botulinum Toxin Market Value (US$ Mn) Analysis 2012–2016 and Forecast 2017–2027, By Country
Table 31: APEJ Dermal Fillers and Botulinum Toxin Participants Presence (Intensity Mapping)
Table 32: Japan Dermal Fillers and Botulinum Toxin Market Value (US$ Mn) Analysis-2012–2016 and Forecast 2017–2027, By Product Type
Table 33: Japan Dermal Fillers Market Volume (1 ml vial) Analysis 2012–2016 and Forecast 2017–2027, By Product Type
Table 34: Japan Botulinum Toxin Market Volume (100 unit vial) Analysis 2012–2016 and Forecast 2017–2027, By Product Type
Table 35: Japan Dermal Fillers and Botulinum Toxin Market Value (US$ Mn) Analysis 2012–2016 and Forecast 2017–2027, By Application
Table 36: Japan Dermal Fillers and Botulinum Toxin Market Value (US$ Mn) Analysis 2012–2016 and Forecast 2017–2027, By Country
Table 37: Japan Dermal Fillers and Botulinum Toxin Participants Presence (Intensity Mapping)
Table 38: MEA Dermal Fillers and Botulinum Toxin Market Value (US$ Mn) Analysis-2012–2016 and Forecast 2017–2027, By Product Type
Table 39: MEA Dermal Fillers Market Volume (1 ml vial) Analysis 2012–2016 and Forecast 2017–2027, By Product Type
Table 40: MEA Botulinum Toxin Market Volume (100 unit vial) Analysis 2012–2016 and Forecast 2017–2027, By Product Type
Table 41: MEA Dermal Fillers and Botulinum Toxin Market Value (US$ Mn) Analysis 2012–2016 and Forecast 2017–2027, By Application
Table 42: MEA Dermal Fillers and Botulinum Toxin Market Value (US$ Mn) Analysis 2012–2016 and Forecast 2017–2027, By Country
Table 43: MEA Dermal Fillers and Botulinum Toxin Participants Presence (Intensity Mapping)
Table 44 Global Dermal Fillers and Botulinum Toxin Market: Intensity Mapping by Company
Table 45 Dermal Fillers and Botulinum Toxin Market Value (US$ Mn) Analysis-2012–2016 and Forecast 2017–2027, By Country
Table 46 Global Dermal Fillers and Botulinum Toxin Market Value (US$ Mn) Analysis-2012–2016 and Forecast 2017–2027, By Product Type
Table 47 Global Dermal Fillers Market Volume (1 ml vial) Analysis 2012–2016 and Forecast 2017–2027, By Product Type
Table 48 Global Botulinum Toxin Market Volume (100 unit vial) Analysis 2012–2016 and Forecast 2017–2027, By Product Type
Table 49 Global Dermal Fillers and Botulinum Toxin Market Value (US$ Mn) Analysis 2012–2016 and Forecast 2017–2027, By Application
Find your sweet spots for generating winning opportunities in this market.
Talk to AnalystList of Charts
Figure 01: U.S FDA Regulatory Approval for Medical Devices
Figure 02: Europe Regulatory Approval for Medical Devices
Figure 03: U.S. FDA approved Dermal Fillers
Figure 04: North America Dermal Fillers and Botulinum Toxin Market Forecast 2017 and 2027
Figure 06: North America Dermal Fillers and Botulinum Toxin Market Value Share By Application (2017)
Figure 05: North America Dermal Fillers and Botulinum Toxin Market Value Share By Product Type (2017)
Figure 07: North America Dermal Fillers and Botulinum Toxin Market Value Share By Country (2017)
Figure 08: North America Dermal Fillers and Botulinum Toxin Historical Market Analysis 2012 - 2016
Figure 09: North America Dermal Fillers and Botulinum Toxin Market Forecast, 2017 - 2027
Figure 10: U.S. Dermal Fillers and Botulinum Toxin Historical Market Analysis 2012 - 2016
Figure 11: U.S. Dermal Fillers and Botulinum Toxin Market Forecast, 2017 - 2027
Figure 12: Canada Dermal Fillers and Botulinum Toxin Historical Market Analysis 2012 - 2016
Figure 13: Canada Dermal Fillers and Botulinum Toxin Market Forecast, 2017 - 2027
Figure 14: North America Dermal Fillers and Botulinum Toxin Market Attractive Analysis By Product Type, 2017-2027
Figure 15: North America Dermal Fillers and Botulinum Toxin Market Attractive Analysis By Application, 2017-2027
Figure 16: North America Dermal Fillers and Botulinum Toxin Market Attractive Analysis By Country, 2017-2027
Figure 17: North America - Drivers & Restrains Impact Analysis
Figure 18: Latin America Dermal Fillers and Botulinum Toxin Market Forecast 2017 and 2027
Figure 19: Latin America Dermal Fillers and Botulinum Toxin Market Value Share By Product Type (2017)
Figure 20: Latin America Dermal Fillers and Botulinum Toxin Market Value Share By Application (2017)
Figure 21: Latin America Dermal Fillers and Botulinum Toxin Market Value Share By Country (2017)
Figure 22: Latin America Dermal Fillers and Botulinum Toxin Historical Market Analysis 2012 - 2016
Figure 23: Latin America Dermal Fillers and Botulinum Toxin Market Forecast, 2017 - 2027
Figure 24: Brazil Dermal Fillers and Botulinum Toxin Historical Market Analysis 2012 - 2016
Figure 25: Brazil Dermal Fillers and Botulinum Toxin Market Forecast, 2017 - 2027
Figure 26: Mexico Dermal Fillers and Botulinum Toxin Historical Market Analysis 2012 - 2016
Figure 27: Mexico Dermal Fillers and Botulinum Toxin Market Forecast, 2017 - 2027
Figure 28: Argentina Dermal Fillers and Botulinum Toxin Historical Market Analysis 2012 - 2016
Figure 29: Argentina Dermal Fillers and Botulinum Toxin Market Forecast, 2017 - 2027
Figure 30: Rest of Latin America Dermal Fillers and Botulinum Toxin Historical Market Analysis 2012 - 2016
Figure 31: Rest of Latin America Dermal Fillers and Botulinum Toxin Market Forecast, 2012 - 2016
Figure 32: Latin America Dermal Fillers and Botulinum Toxin Market Attractive Analysis By Product Type, 2017-2027
Figure 33: Latin America Dermal Fillers and Botulinum Toxin Market Attractive Analysis By Application, 2017-2027
Figure 34: Latin America Dermal Fillers and Botulinum Toxin Market Attractive Analysis By Country, 2017-2027
Figure 35: Latin America - Drivers & Restraint Impact Analysis
Figure 36: Western Europe Dermal Fillers and Botulinum Toxin Market Forecast 2017 and 2027
Figure 37: Western Europe Dermal Fillers and Botulinum Toxin Market Value Share By Product Type (2017)
Figure 38: Western Europe Dermal Fillers and Botulinum Toxin Market Value Share By Application (2017)
Figure 39: Western Europe Dermal Fillers and Botulinum Toxin Market Value Share By Country (2017)
Figure 40: Western Europe Dermal Fillers and Botulinum Toxin Historical Market Analysis 2012 - 2016
Figure 41: Western Europe Dermal Fillers and Botulinum Toxin Market Forecast, 2017 - 2027
Figure 42: U.K. Dermal Fillers and Botulinum Toxin Historical Market Analysis 2012 - 2016
Figure 43: U.K. Dermal Fillers and Botulinum Toxin Market Forecast, 2017 - 2027
Figure 44: Germany Dermal Fillers and Botulinum Toxin Historical Market Analysis 2012 - 2016
Figure 45: Germany Dermal Fillers and Botulinum Toxin Market Forecast, 2017 - 2027
Figure 46: France Dermal Fillers and Botulinum Toxin Historical Market Analysis 2012 - 2016
Figure 47: France Dermal Fillers and Botulinum Toxin Market Forecast, 2017 - 2027
Figure 48: Italy Dermal Fillers and Botulinum Toxin Historical Market Analysis 2012 - 2016
Figure 49: Italy Dermal Fillers and Botulinum Toxin Market Forecast, 2017 - 2027
Figure 50: Spain Dermal Fillers and Botulinum Toxin Historical Market Analysis 2012 - 2016
Figure 51: Spain Dermal Fillers and Botulinum Toxin Market Forecast, 2017 - 2027
Figure 52: Nordics Dermal Fillers and Botulinum Toxin Historical Market Analysis 2012 - 2016
Figure 53: Nordics Dermal Fillers and Botulinum Toxin Market Forecast, 2017 - 2027
Figure 54: Benelux Dermal Fillers and Botulinum Toxin Historical Market Analysis 2012 - 2016
Figure 55: Benelux Dermal Fillers and Botulinum Toxin Market Forecast, 2017 - 2027
Figure 56: Rest of Western Europe Dermal Fillers and Botulinum Toxin Historical Market Analysis 2012 - 2016
Figure 57: Rest of Western Europe Dermal Fillers and Botulinum Toxin Market Forecast, 2017 - 2027
Figure 58: Western Europe Dermal Fillers and Botulinum Toxin Market Attractive Analysis By Product Type, 2017-2027
Figure 59: Western Europe Dermal Fillers and Botulinum Toxin Market Attractive Analysis By Application, 2017-2027
Figure 60: Western Europe Dermal Fillers and Botulinum Toxin Market Attractive Analysis By Product Type, 2017-2027
Figure 61: Western Europe - Drivers & Restraint Impact Analysis
Figure 62: Eastern Europe Dermal Fillers and Botulinum Toxin Market Forecast 2017 and 2027
Figure 63: Eastern Europe Dermal Fillers and Botulinum Toxin Market Value Share By Product Type (2017)
Figure 64: Eastern Europe Dermal Fillers and Botulinum Toxin Market Value Share By Application (2017)
Figure 65: Eastern Europe Dermal Fillers and Botulinum Toxin Market Value Share By Country (2017)
Figure 66: Eastern Europe Dermal Fillers and Botulinum Toxin Historical Market Analysis 2012 - 2016
Figure 67: Eastern Europe Dermal Fillers and Botulinum Toxin Market Forecast, 2017 - 2027
Figure 68: Russia Dermal Fillers and Botulinum Toxin Historical Market Analysis 2012 - 2016
Figure 69: Russia Dermal Fillers and Botulinum Toxin Market Forecast, 2017 - 2027
Figure 70: Poland Dermal Fillers and Botulinum Toxin Historical Market Analysis 2012 - 2016
Figure 71: Poland Dermal Fillers and Botulinum Toxin Market Forecast, 2017 - 2027
Figure 72: Rest of Eastern Europe Dermal Fillers and Botulinum Toxin Historical Market Analysis 2012 - 2016
Figure 73: Rest of Eastern Europe Dermal Fillers and Botulinum Toxin Market Forecast, 2017 - 2027
Figure 74: Eastern Europe Dermal Fillers and Botulinum Toxin Market Attractive Analysis By Product Type, 2017-2027
Figure 75: Eastern Europe Dermal Fillers and Botulinum Toxin Market Attractive Analysis By Application, 2017-2027
Figure 76: Eastern Europe Dermal Fillers and Botulinum Toxin Market Attractive Analysis By Product Type, 2017-2027
Figure 77: Eastern Europe - Drivers & Restraint Impact Analysis
Figure 78: APEJ Dermal Fillers and Botulinum Toxin Market Forecast 2017 and 2027
Figure 79: APEJ Dermal Fillers and Botulinum Toxin Market Value Share By Product Type (2017)
Figure 80: APEJ Dermal Fillers and Botulinum Toxin Market Value Share By Application (2017)
Figure 81: APEJ Dermal Fillers and Botulinum Toxin Market Value Share By Country (2017)
Figure 82: APEJ Dermal Fillers and Botulinum Toxin Historical Market Analysis 2012 - 2016
Figure 83: APEJ Dermal Fillers and Botulinum Toxin Market Forecast, 2017 - 2027
Figure 84: China Dermal Fillers and Botulinum Toxin Historical Market Analysis 2012 - 2016
Figure 85: China Dermal Fillers and Botulinum Toxin Market Forecast, 2017 - 2027
Figure 86: India Dermal Fillers and Botulinum Toxin Historical Market Analysis 2012 - 2016
Figure 87: India Dermal Fillers and Botulinum Toxin Market Forecast, 2017 - 2027
Figure 88: Australia and NZ Dermal Fillers and Botulinum Toxin Historical Market Analysis 2012 - 2016
Figure 89: Australia and NZ Dermal Fillers and Botulinum Toxin Market Forecast, 2017 - 2027
Figure 90: ASEAN Dermal Fillers and Botulinum Toxin Historical Market Analysis 2012 - 2016
Figure 91: ASEAN Dermal Fillers and Botulinum Toxin Market Forecast, 2017 - 2027
Figure 92: Rest of APEJ Dermal Fillers and Botulinum Toxin Historical Market Analysis 2012 - 2016
Figure 93: Rest of APEJ Dermal Fillers and Botulinum Toxin Market Forecast, 2017 - 2027
Figure 94: APEJ Dermal Fillers and Botulinum Toxin Market Attractive Analysis By Product Type, 2017-2027
Figure 95: APEJ Dermal Fillers and Botulinum Toxin Market Attractive Analysis By Application, 2017-2027
Figure 96: APEJ Dermal Fillers and Botulinum Toxin Market Attractive Analysis By Product Type, 2017-2027
Figure 97: APEJ - Drivers & Restraint Impact Analysis
Figure 98: Japan Dermal Fillers and Botulinum Toxin Market Forecast 2017 and 2027
Figure 99: Figure Japan Dermal Fillers and Botulinum Toxin Market Value Share By Product Type (2017)
Figure 100: Japan Dermal Fillers and Botulinum Toxin Market Value Share By Application (2017)
Figure 101: Japan Dermal Fillers and Botulinum Toxin Historical Market Analysis 2012 - 2016
Figure 102: Japan Dermal Fillers and Botulinum Toxin Market Forecast, 2017 - 2027
Figure 103: Japan Dermal Fillers and Botulinum Toxin Market Attractive Analysis By Product Type, 2017-2027
Figure 104: Japan Dermal Fillers and Botulinum Toxin Market Attractive Analysis By Application, 2017-2027
Figure 105: Japan- Drivers & Restraint Impact Analysis
Figure 106: MEA Dermal Fillers and Botulinum Toxin Market Forecast 2017 and 2027
Figure 108: MEA Dermal Fillers and Botulinum Toxin Market Value Share By Application (2017)
Figure 107: MEA Dermal Fillers and Botulinum Toxin Market Value Share By Product Type (2017)
Figure 109: MEA Dermal Fillers and Botulinum Toxin Market Value Share By Country (2017)
Figure 110: MEA Dermal Fillers and Botulinum Toxin Historical Market Analysis 2012 - 2016
Figure 111: MEA Dermal Fillers and Botulinum Toxin Market Forecast, 2017 - 2027
Figure 112: South Africa Dermal Fillers and Botulinum Toxin Historical Market Analysis 2012 - 2016
Figure 113: South Africa Dermal Fillers and Botulinum Toxin Market Forecast, 2017 - 2027
Figure 114: GCC Countries Dermal Fillers and Botulinum Toxin Historical Market Analysis 2012 - 2016
Figure 115: GCC Countries Dermal Fillers and Botulinum Toxin Market Forecast, 2017 - 2027
Figure 116: Rest of MEA Dermal Fillers and Botulinum Toxin Historical Market Analysis 2012 - 2016
Figure 117: Rest of MEA Dermal Fillers and Botulinum Toxin Market Forecast, 2017 - 2027
Figure 118: MEA Dermal Fillers and Botulinum Toxin Market Attractive Analysis By Product Type, 2017-2027
Figure 119: MEA Dermal Fillers and Botulinum Toxin Market Attractive Analysis By Application, 2017-2027
Figure 120: MEA Dermal Fillers and Botulinum Toxin Market Attractive Analysis By Product Type, 2017-2027
Figure 121: MEA Drivers & Restraint Impact Analysis
Figure 122 : Dermal Fillers and Botulinum Toxin Market Forecast Factors – Relevance and Impact
Figure 123: Global Dermal Fillers and Botulinum Toxin Market Share Analysis
Figure 124: Global Dermal Fillers Market Share Analysis
Figure 125: Global Botulinum Toxin Market Share Analysis
Figure 126: Global Bone Dermal Fillers and Botulinum Toxin Market Value (US$ Mn) By Region, 2017 & 2027
Figure 127: Global Dermal Fillers and Botulinum Toxin Market Attractive Analysis By Region, 2017-2027
Figure 128: Global Bone Dermal Fillers and Botulinum Toxin Market Value (US$ Mn) By Product Type, 2017 & 2027
Figure 129: Global Dermal Fillers and Botulinum Toxin Market Attractive Analysis By Product Type, 2017-2027
Figure 130: Global Bone Dermal Fillers and Botulinum Toxin Market Value (US$ Mn) By Application, 2017 & 2027
Figure 131: Global Dermal Fillers and Botulinum Toxin Market Attractive Analysis By Application, 2017-2027
Figure 132: Global Dermal Fillers and Botulinum Toxin Historical Market Analysis 2012 - 2016
Figure 133: Global Dermal Fillers and Botulinum Toxin Market Forecast, 2017 - 2027
Figure 134: Global Dermal Fillers and Botulinum Toxin Market Absolute $ Opportunity, 2012 - 2016
Figure 135: Global Dermal Fillers and Botulinum Toxin Market Absolute $ Opportunity, 2017 - 2027
Figure 136: Global Dermal Fillers and Botulinum Toxin Market - Value Chain
Need specific information?
Request CustomizationExplore Healthcare Insights
View Reports