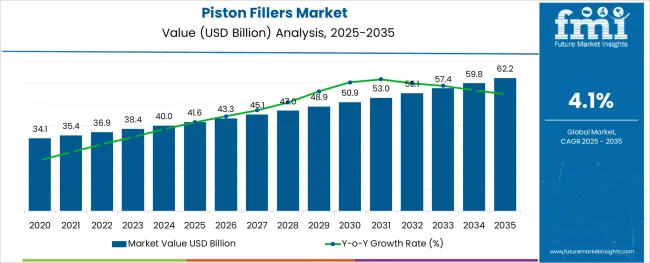
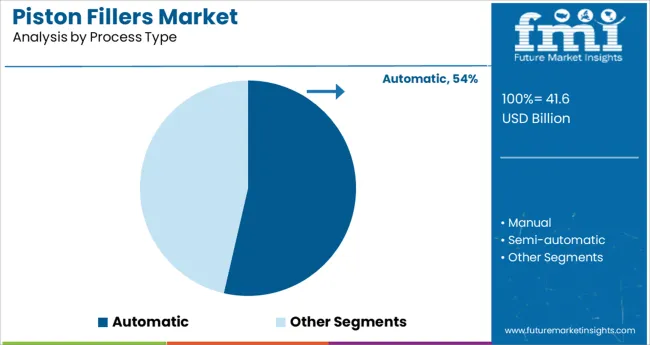
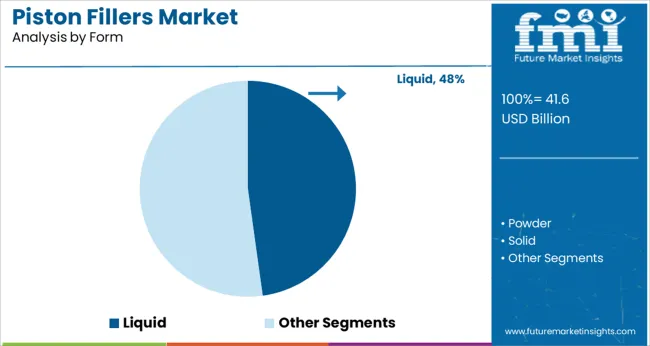
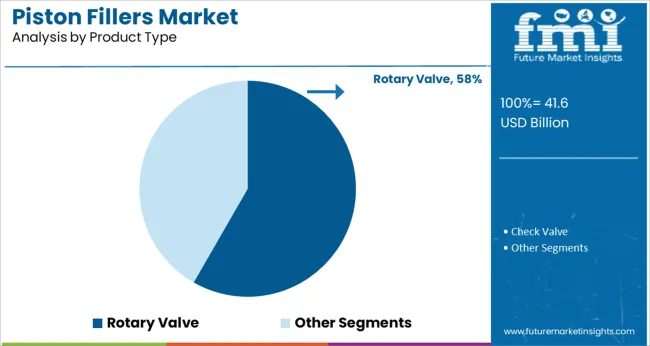
The global piston fillers market size is anticipated to exhibit growth at a CAGR of 4.1% in the forecast period (2022 to 2032). Increasing demand for automatic filling processes in end-use industries to eliminate contaminants from products is set to drive growth in future.
Sales of piston fillers are projected to reach USD 36.9 Billion in 2022 and USD 67.3 Billion in 2032, mentions FMI in its study. Rapid development of new variants of piston fillers and technologically advanced filling equipment to meet high consumer demand is likely to bolster the market.
Report Attribute | Details |
---|---|
Piston Fillers Market Estimated Base Year Value (2021) | USD 35.2 Billion |
Piston Fillers Market Expected Market Value (2022) | USD 36.9 Billion |
Piston Fillers Market Anticipated Forecast Value (2032) | USD 67.3 Billion |
Piston Fillers Market Projected Growth Rate (2022 to 2032) | 4.1% CAGR |
In the packaging industry, filling has become a significant process in recent years. Ongoing expansion of the packaging sector in both developed and developing countries is anticipated to boost the market.
Demand for piston fillers is expected to surge at a considerable pace in the assessment period on the back of rising focus of the packaging sector on process automation. Manufacturers are likely to develop cutting-edge filling equipment to meet the changing consumer demand.
Moreover, ability of piston fillers to fill thick and highly viscous products, such as chunky, semi-paste, paste products is set to augment growth. These are also extensively utilized to fill chemical preparations, such as adhesives, greases, epoxies, waxes, and lubricant oils.
Increasing initiatives by key players to comply with strict food grade standards implemented by regulatory bodies worldwide is another vital factor that would contribute to growth. Also, ability of piston fillers to measure a particular product by using a reciprocating piston of a preset volume is expected to aid growth.
As piston fillers are solely based on conventional technology, these are easy to operate and relatively low cost for the majority of the end-use industries. High demand for cost-effective and rapid filling technologies for faster production is a crucial factor that is expected to foster the global piston fillers market growth in the evaluation period.
Besides, surging need for customized filling and packaging equipment to attain operational excellence is likely to bode well for the global market. High demand for pharmaceutical and cosmetics products across the globe owing to rising disposable income and changing lifestyles is another major factor that is predicted to fuel growth in the market.
Piston fillers are difficult to clean after usage and thus require high maintenance cost. Chances of leakage is also high with the usage of piston fillers. Latest variants are expensive and would incur high installation cost. Often, debris block the pipeline and the nozzle of the filling drips the liquid. Spurred by the aforementioned disadvantages, sales of piston fillers may decline in the upcoming years.
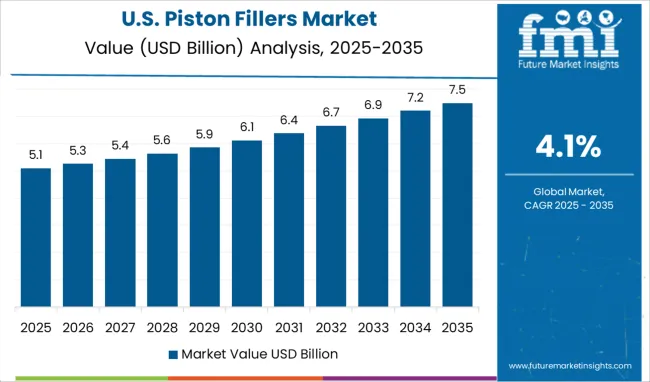
North America is estimated to remain at the forefront by generating the largest piston fillers market share in the forthcoming years. Wider acceptance of innovative technologies in the USA and Canada is expected to bolster the regional market. In addition to that, increasing demand for packaged food items across North America is set to aid growth.
The presence of a large number of renowned cosmetics manufacturers in North America is another significant factor that would spur growth. New product launches, high demand for organic cosmetics, and surging consciousness about external beauty are some of the factors responsible for pushing the demand for cosmetics and personal care products in North America.
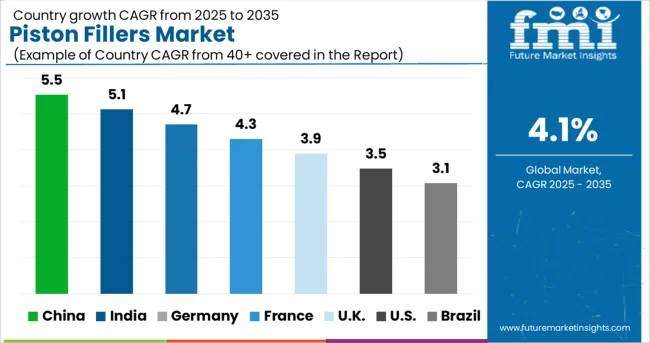
Ongoing expansion of the food and beverage industry in India, China, South Korea, and Japan is expected to expand the Asia Pacific piston fillers market size in future. Increasing demand for cost-effective and automated solutions in emerging economies is another factor that is set to propel the regional market.
Further, extensive consumption of ready-to-eat meals among college students and working professionals is likely to bolster growth. Growing pressure on brands to provide new products that are better for the environment is resulting in the shift of companies towards the development of vegan or plant-based ingredients. Increasing number of supermarkets, grocery stores, and hypermarkets across Asia Pacific is also expected to drive growth.
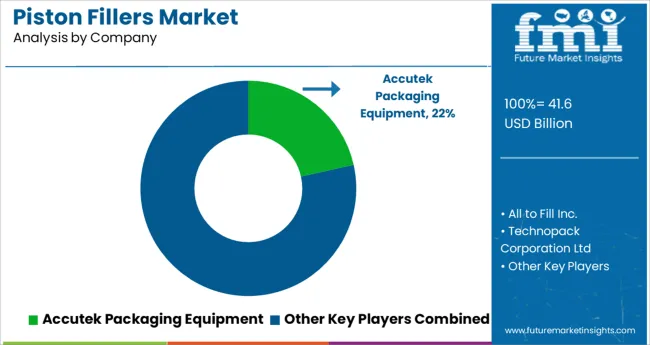
Some of the prominent companies operating in the global piston fillers market include Biner-Ellison Packaging Systems, All-Fill Inc., Busch Machinery, Cleveland Equipment & Machinery, Accutek Packaging Equipment Companies, Inc., Raque Food Systems, E-PAK Machinery, Technopack Corporation Ltd, Unifiller Systems Inc., Apacks, Filling Equipment Co. Inc., Simplex Filler Company, and JBT among others.
The global market is highly competitive in nature with the presence of various large- and small-scale companies. They are mainly focusing on mergers and acquisitions with local companies to expand their presence in the global market.
Some of the other key players are investing huge sums in research and development activities to come up with novel, yet cost-effective piston fillers to help food manufacturers keep up with strict government norms.
Report Attribute | Details |
---|---|
Growth Rate | CAGR of 4.1% from 2022 to 2032 |
Base Year for Estimation | 2021 |
Historical Data | 2015 to 2020 |
Forecast Period | 2022 to 2032 |
Quantitative Units | Revenue in USD Million and CAGR from 2022 to 2032 |
Report Coverage | Revenue Forecast, Volume Forecast, Company Ranking, Competitive Landscape, Growth Factors, Trends and Pricing Analysis |
Segments Covered |
Process Type, Form, Product Type, Design, Application, Region |
Regions Covered |
North America; Latin America; Western Europe; Eastern Europe; APEJ; Japan; Middle East and Africa |
Key Countries Profiled | USA, Canada, Brazil, Argentina, Germany, UK, France, Spain, Italy, Nordics, BENELUX, Australia & New Zealand, China, India, ASEAN, GCC, South Africa |
Key Companies Profiled |
Biner-Ellison Packaging Systems; All-Fill Inc.; Busch Machinery; Cleveland Equipment & Machinery; Accutek Packaging Equipment Companies, Inc.; Raque Food Systems; E-PAK Machinery; Technopack Corporation Ltd; Unifiller Systems Inc.; Apacks; Filling Equipment Co. Inc.; Simplex Filler Company; JBT |
Customization | Available Upon Request |
Table 1: Global Piston Fillers Market Value (US$ Mn) Forecast by Region, 2017-2032
Table 2: Global Piston Fillers Market Volume (Units) Forecast by Region, 2017-2032
Table 3: Global Piston Fillers Market Value (US$ Mn) Forecast by Process Type, 2017-2032
Table 4: Global Piston Fillers Market Volume (Units) Forecast by Process Type, 2017-2032
Table 5: Global Piston Fillers Market Value (US$ Mn) Forecast by Form, 2017-2032
Table 6: Global Piston Fillers Market Volume (Units) Forecast by Form, 2017-2032
Table 7: Global Piston Fillers Market Value (US$ Mn) Forecast by Product Type, 2017-2032
Table 8: Global Piston Fillers Market Volume (Units) Forecast by Product Type, 2017-2032
Table 9: Global Piston Fillers Market Value (US$ Mn) Forecast by Design, 2017-2032
Table 10: Global Piston Fillers Market Volume (Units) Forecast by Design, 2017-2032
Table 11: Global Piston Fillers Market Value (US$ Mn) Forecast by Application, 2017-2032
Table 12: Global Piston Fillers Market Volume (Units) Forecast by Application, 2017-2032
Table 13: North America Piston Fillers Market Value (US$ Mn) Forecast by Country, 2017-2032
Table 14: North America Piston Fillers Market Volume (Units) Forecast by Country, 2017-2032
Table 15: North America Piston Fillers Market Value (US$ Mn) Forecast by Process Type, 2017-2032
Table 16: North America Piston Fillers Market Volume (Units) Forecast by Process Type, 2017-2032
Table 17: North America Piston Fillers Market Value (US$ Mn) Forecast by Form, 2017-2032
Table 18: North America Piston Fillers Market Volume (Units) Forecast by Form, 2017-2032
Table 19: North America Piston Fillers Market Value (US$ Mn) Forecast by Product Type, 2017-2032
Table 20: North America Piston Fillers Market Volume (Units) Forecast by Product Type, 2017-2032
Table 21: North America Piston Fillers Market Value (US$ Mn) Forecast by Design, 2017-2032
Table 22: North America Piston Fillers Market Volume (Units) Forecast by Design, 2017-2032
Table 23: North America Piston Fillers Market Value (US$ Mn) Forecast by Application, 2017-2032
Table 24: North America Piston Fillers Market Volume (Units) Forecast by Application, 2017-2032
Table 25: Latin America Piston Fillers Market Value (US$ Mn) Forecast by Country, 2017-2032
Table 26: Latin America Piston Fillers Market Volume (Units) Forecast by Country, 2017-2032
Table 27: Latin America Piston Fillers Market Value (US$ Mn) Forecast by Process Type, 2017-2032
Table 28: Latin America Piston Fillers Market Volume (Units) Forecast by Process Type, 2017-2032
Table 29: Latin America Piston Fillers Market Value (US$ Mn) Forecast by Form, 2017-2032
Table 30: Latin America Piston Fillers Market Volume (Units) Forecast by Form, 2017-2032
Table 31: Latin America Piston Fillers Market Value (US$ Mn) Forecast by Product Type, 2017-2032
Table 32: Latin America Piston Fillers Market Volume (Units) Forecast by Product Type, 2017-2032
Table 33: Latin America Piston Fillers Market Value (US$ Mn) Forecast by Design, 2017-2032
Table 34: Latin America Piston Fillers Market Volume (Units) Forecast by Design, 2017-2032
Table 35: Latin America Piston Fillers Market Value (US$ Mn) Forecast by Application, 2017-2032
Table 36: Latin America Piston Fillers Market Volume (Units) Forecast by Application, 2017-2032
Table 37: Europe Piston Fillers Market Value (US$ Mn) Forecast by Country, 2017-2032
Table 38: Europe Piston Fillers Market Volume (Units) Forecast by Country, 2017-2032
Table 39: Europe Piston Fillers Market Value (US$ Mn) Forecast by Process Type, 2017-2032
Table 40: Europe Piston Fillers Market Volume (Units) Forecast by Process Type, 2017-2032
Table 41: Europe Piston Fillers Market Value (US$ Mn) Forecast by Form, 2017-2032
Table 42: Europe Piston Fillers Market Volume (Units) Forecast by Form, 2017-2032
Table 43: Europe Piston Fillers Market Value (US$ Mn) Forecast by Product Type, 2017-2032
Table 44: Europe Piston Fillers Market Volume (Units) Forecast by Product Type, 2017-2032
Table 45: Europe Piston Fillers Market Value (US$ Mn) Forecast by Design, 2017-2032
Table 46: Europe Piston Fillers Market Volume (Units) Forecast by Design, 2017-2032
Table 47: Europe Piston Fillers Market Value (US$ Mn) Forecast by Application, 2017-2032
Table 48: Europe Piston Fillers Market Volume (Units) Forecast by Application, 2017-2032
Table 49: Asia Pacific Piston Fillers Market Value (US$ Mn) Forecast by Country, 2017-2032
Table 50: Asia Pacific Piston Fillers Market Volume (Units) Forecast by Country, 2017-2032
Table 51: Asia Pacific Piston Fillers Market Value (US$ Mn) Forecast by Process Type, 2017-2032
Table 52: Asia Pacific Piston Fillers Market Volume (Units) Forecast by Process Type, 2017-2032
Table 53: Asia Pacific Piston Fillers Market Value (US$ Mn) Forecast by Form, 2017-2032
Table 54: Asia Pacific Piston Fillers Market Volume (Units) Forecast by Form, 2017-2032
Table 55: Asia Pacific Piston Fillers Market Value (US$ Mn) Forecast by Product Type, 2017-2032
Table 56: Asia Pacific Piston Fillers Market Volume (Units) Forecast by Product Type, 2017-2032
Table 57: Asia Pacific Piston Fillers Market Value (US$ Mn) Forecast by Design, 2017-2032
Table 58: Asia Pacific Piston Fillers Market Volume (Units) Forecast by Design, 2017-2032
Table 59: Asia Pacific Piston Fillers Market Value (US$ Mn) Forecast by Application, 2017-2032
Table 60: Asia Pacific Piston Fillers Market Volume (Units) Forecast by Application, 2017-2032
Table 61: Middle East and Africa Piston Fillers Market Value (US$ Mn) Forecast by Country, 2017-2032
Table 62: Middle East and Africa Piston Fillers Market Volume (Units) Forecast by Country, 2017-2032
Table 63: Middle East and Africa Piston Fillers Market Value (US$ Mn) Forecast by Process Type, 2017-2032
Table 64: Middle East and Africa Piston Fillers Market Volume (Units) Forecast by Process Type, 2017-2032
Table 65: Middle East and Africa Piston Fillers Market Value (US$ Mn) Forecast by Form, 2017-2032
Table 66: Middle East and Africa Piston Fillers Market Volume (Units) Forecast by Form, 2017-2032
Table 67: Middle East and Africa Piston Fillers Market Value (US$ Mn) Forecast by Product Type, 2017-2032
Table 68: Middle East and Africa Piston Fillers Market Volume (Units) Forecast by Product Type, 2017-2032
Table 69: Middle East and Africa Piston Fillers Market Value (US$ Mn) Forecast by Design, 2017-2032
Table 70: Middle East and Africa Piston Fillers Market Volume (Units) Forecast by Design, 2017-2032
Table 71: Middle East and Africa Piston Fillers Market Value (US$ Mn) Forecast by Application, 2017-2032
Table 72: Middle East and Africa Piston Fillers Market Volume (Units) Forecast by Application, 2017-2032
Figure 1: Global Piston Fillers Market Value (US$ Mn) by Process Type, 2022-2032
Figure 2: Global Piston Fillers Market Value (US$ Mn) by Form, 2022-2032
Figure 3: Global Piston Fillers Market Value (US$ Mn) by Product Type, 2022-2032
Figure 4: Global Piston Fillers Market Value (US$ Mn) by Design, 2022-2032
Figure 5: Global Piston Fillers Market Value (US$ Mn) by Application, 2022-2032
Figure 6: Global Piston Fillers Market Value (US$ Mn) by Region, 2022-2032
Figure 7: Global Piston Fillers Market Value (US$ Mn) Analysis by Region, 2017-2032
Figure 8: Global Piston Fillers Market Volume (Units) Analysis by Region, 2017-2032
Figure 9: Global Piston Fillers Market Value Share (%) and BPS Analysis by Region, 2022-2032
Figure 10: Global Piston Fillers Market Y-o-Y Growth (%) Projections by Region, 2022-2032
Figure 11: Global Piston Fillers Market Value (US$ Mn) Analysis by Process Type, 2017-2032
Figure 12: Global Piston Fillers Market Volume (Units) Analysis by Process Type, 2017-2032
Figure 13: Global Piston Fillers Market Value Share (%) and BPS Analysis by Process Type, 2022-2032
Figure 14: Global Piston Fillers Market Y-o-Y Growth (%) Projections by Process Type, 2022-2032
Figure 15: Global Piston Fillers Market Value (US$ Mn) Analysis by Form, 2017-2032
Figure 16: Global Piston Fillers Market Volume (Units) Analysis by Form, 2017-2032
Figure 17: Global Piston Fillers Market Value Share (%) and BPS Analysis by Form, 2022-2032
Figure 18: Global Piston Fillers Market Y-o-Y Growth (%) Projections by Form, 2022-2032
Figure 19: Global Piston Fillers Market Value (US$ Mn) Analysis by Product Type, 2017-2032
Figure 20: Global Piston Fillers Market Volume (Units) Analysis by Product Type, 2017-2032
Figure 21: Global Piston Fillers Market Value Share (%) and BPS Analysis by Product Type, 2022-2032
Figure 22: Global Piston Fillers Market Y-o-Y Growth (%) Projections by Product Type, 2022-2032
Figure 23: Global Piston Fillers Market Value (US$ Mn) Analysis by Design, 2017-2032
Figure 24: Global Piston Fillers Market Volume (Units) Analysis by Design, 2017-2032
Figure 25: Global Piston Fillers Market Value Share (%) and BPS Analysis by Design, 2022-2032
Figure 26: Global Piston Fillers Market Y-o-Y Growth (%) Projections by Design, 2022-2032
Figure 27: Global Piston Fillers Market Value (US$ Mn) Analysis by Application, 2017-2032
Figure 28: Global Piston Fillers Market Volume (Units) Analysis by Application, 2017-2032
Figure 29: Global Piston Fillers Market Value Share (%) and BPS Analysis by Application, 2022-2032
Figure 30: Global Piston Fillers Market Y-o-Y Growth (%) Projections by Application, 2022-2032
Figure 31: Global Piston Fillers Market Attractiveness by Process Type, 2022-2032
Figure 32: Global Piston Fillers Market Attractiveness by Form, 2022-2032
Figure 33: Global Piston Fillers Market Attractiveness by Product Type, 2022-2032
Figure 34: Global Piston Fillers Market Attractiveness by Design, 2022-2032
Figure 35: Global Piston Fillers Market Attractiveness by Application, 2022-2032
Figure 36: Global Piston Fillers Market Attractiveness by Region, 2022-2032
Figure 37: North America Piston Fillers Market Value (US$ Mn) by Process Type, 2022-2032
Figure 38: North America Piston Fillers Market Value (US$ Mn) by Form, 2022-2032
Figure 39: North America Piston Fillers Market Value (US$ Mn) by Product Type, 2022-2032
Figure 40: North America Piston Fillers Market Value (US$ Mn) by Design, 2022-2032
Figure 41: North America Piston Fillers Market Value (US$ Mn) by Application, 2022-2032
Figure 42: North America Piston Fillers Market Value (US$ Mn) by Country, 2022-2032
Figure 43: North America Piston Fillers Market Value (US$ Mn) Analysis by Country, 2017-2032
Figure 44: North America Piston Fillers Market Volume (Units) Analysis by Country, 2017-2032
Figure 45: North America Piston Fillers Market Value Share (%) and BPS Analysis by Country, 2022-2032
Figure 46: North America Piston Fillers Market Y-o-Y Growth (%) Projections by Country, 2022-2032
Figure 47: North America Piston Fillers Market Value (US$ Mn) Analysis by Process Type, 2017-2032
Figure 48: North America Piston Fillers Market Volume (Units) Analysis by Process Type, 2017-2032
Figure 49: North America Piston Fillers Market Value Share (%) and BPS Analysis by Process Type, 2022-2032
Figure 50: North America Piston Fillers Market Y-o-Y Growth (%) Projections by Process Type, 2022-2032
Figure 51: North America Piston Fillers Market Value (US$ Mn) Analysis by Form, 2017-2032
Figure 52: North America Piston Fillers Market Volume (Units) Analysis by Form, 2017-2032
Figure 53: North America Piston Fillers Market Value Share (%) and BPS Analysis by Form, 2022-2032
Figure 54: North America Piston Fillers Market Y-o-Y Growth (%) Projections by Form, 2022-2032
Figure 55: North America Piston Fillers Market Value (US$ Mn) Analysis by Product Type, 2017-2032
Figure 56: North America Piston Fillers Market Volume (Units) Analysis by Product Type, 2017-2032
Figure 57: North America Piston Fillers Market Value Share (%) and BPS Analysis by Product Type, 2022-2032
Figure 58: North America Piston Fillers Market Y-o-Y Growth (%) Projections by Product Type, 2022-2032
Figure 59: North America Piston Fillers Market Value (US$ Mn) Analysis by Design, 2017-2032
Figure 60: North America Piston Fillers Market Volume (Units) Analysis by Design, 2017-2032
Figure 61: North America Piston Fillers Market Value Share (%) and BPS Analysis by Design, 2022-2032
Figure 62: North America Piston Fillers Market Y-o-Y Growth (%) Projections by Design, 2022-2032
Figure 63: North America Piston Fillers Market Value (US$ Mn) Analysis by Application, 2017-2032
Figure 64: North America Piston Fillers Market Volume (Units) Analysis by Application, 2017-2032
Figure 65: North America Piston Fillers Market Value Share (%) and BPS Analysis by Application, 2022-2032
Figure 66: North America Piston Fillers Market Y-o-Y Growth (%) Projections by Application, 2022-2032
Figure 67: North America Piston Fillers Market Attractiveness by Process Type, 2022-2032
Figure 68: North America Piston Fillers Market Attractiveness by Form, 2022-2032
Figure 69: North America Piston Fillers Market Attractiveness by Product Type, 2022-2032
Figure 70: North America Piston Fillers Market Attractiveness by Design, 2022-2032
Figure 71: North America Piston Fillers Market Attractiveness by Application, 2022-2032
Figure 72: North America Piston Fillers Market Attractiveness by Country, 2022-2032
Figure 73: Latin America Piston Fillers Market Value (US$ Mn) by Process Type, 2022-2032
Figure 74: Latin America Piston Fillers Market Value (US$ Mn) by Form, 2022-2032
Figure 75: Latin America Piston Fillers Market Value (US$ Mn) by Product Type, 2022-2032
Figure 76: Latin America Piston Fillers Market Value (US$ Mn) by Design, 2022-2032
Figure 77: Latin America Piston Fillers Market Value (US$ Mn) by Application, 2022-2032
Figure 78: Latin America Piston Fillers Market Value (US$ Mn) by Country, 2022-2032
Figure 79: Latin America Piston Fillers Market Value (US$ Mn) Analysis by Country, 2017-2032
Figure 80: Latin America Piston Fillers Market Volume (Units) Analysis by Country, 2017-2032
Figure 81: Latin America Piston Fillers Market Value Share (%) and BPS Analysis by Country, 2022-2032
Figure 82: Latin America Piston Fillers Market Y-o-Y Growth (%) Projections by Country, 2022-2032
Figure 83: Latin America Piston Fillers Market Value (US$ Mn) Analysis by Process Type, 2017-2032
Figure 84: Latin America Piston Fillers Market Volume (Units) Analysis by Process Type, 2017-2032
Figure 85: Latin America Piston Fillers Market Value Share (%) and BPS Analysis by Process Type, 2022-2032
Figure 86: Latin America Piston Fillers Market Y-o-Y Growth (%) Projections by Process Type, 2022-2032
Figure 87: Latin America Piston Fillers Market Value (US$ Mn) Analysis by Form, 2017-2032
Figure 88: Latin America Piston Fillers Market Volume (Units) Analysis by Form, 2017-2032
Figure 89: Latin America Piston Fillers Market Value Share (%) and BPS Analysis by Form, 2022-2032
Figure 90: Latin America Piston Fillers Market Y-o-Y Growth (%) Projections by Form, 2022-2032
Figure 91: Latin America Piston Fillers Market Value (US$ Mn) Analysis by Product Type, 2017-2032
Figure 92: Latin America Piston Fillers Market Volume (Units) Analysis by Product Type, 2017-2032
Figure 93: Latin America Piston Fillers Market Value Share (%) and BPS Analysis by Product Type, 2022-2032
Figure 94: Latin America Piston Fillers Market Y-o-Y Growth (%) Projections by Product Type, 2022-2032
Figure 95: Latin America Piston Fillers Market Value (US$ Mn) Analysis by Design, 2017-2032
Figure 96: Latin America Piston Fillers Market Volume (Units) Analysis by Design, 2017-2032
Figure 97: Latin America Piston Fillers Market Value Share (%) and BPS Analysis by Design, 2022-2032
Figure 98: Latin America Piston Fillers Market Y-o-Y Growth (%) Projections by Design, 2022-2032
Figure 99: Latin America Piston Fillers Market Value (US$ Mn) Analysis by Application, 2017-2032
Figure 100: Latin America Piston Fillers Market Volume (Units) Analysis by Application, 2017-2032
Figure 101: Latin America Piston Fillers Market Value Share (%) and BPS Analysis by Application, 2022-2032
Figure 102: Latin America Piston Fillers Market Y-o-Y Growth (%) Projections by Application, 2022-2032
Figure 103: Latin America Piston Fillers Market Attractiveness by Process Type, 2022-2032
Figure 104: Latin America Piston Fillers Market Attractiveness by Form, 2022-2032
Figure 105: Latin America Piston Fillers Market Attractiveness by Product Type, 2022-2032
Figure 106: Latin America Piston Fillers Market Attractiveness by Design, 2022-2032
Figure 107: Latin America Piston Fillers Market Attractiveness by Application, 2022-2032
Figure 108: Latin America Piston Fillers Market Attractiveness by Country, 2022-2032
Figure 109: Europe Piston Fillers Market Value (US$ Mn) by Process Type, 2022-2032
Figure 110: Europe Piston Fillers Market Value (US$ Mn) by Form, 2022-2032
Figure 111: Europe Piston Fillers Market Value (US$ Mn) by Product Type, 2022-2032
Figure 112: Europe Piston Fillers Market Value (US$ Mn) by Design, 2022-2032
Figure 113: Europe Piston Fillers Market Value (US$ Mn) by Application, 2022-2032
Figure 114: Europe Piston Fillers Market Value (US$ Mn) by Country, 2022-2032
Figure 115: Europe Piston Fillers Market Value (US$ Mn) Analysis by Country, 2017-2032
Figure 116: Europe Piston Fillers Market Volume (Units) Analysis by Country, 2017-2032
Figure 117: Europe Piston Fillers Market Value Share (%) and BPS Analysis by Country, 2022-2032
Figure 118: Europe Piston Fillers Market Y-o-Y Growth (%) Projections by Country, 2022-2032
Figure 119: Europe Piston Fillers Market Value (US$ Mn) Analysis by Process Type, 2017-2032
Figure 120: Europe Piston Fillers Market Volume (Units) Analysis by Process Type, 2017-2032
Figure 121: Europe Piston Fillers Market Value Share (%) and BPS Analysis by Process Type, 2022-2032
Figure 122: Europe Piston Fillers Market Y-o-Y Growth (%) Projections by Process Type, 2022-2032
Figure 123: Europe Piston Fillers Market Value (US$ Mn) Analysis by Form, 2017-2032
Figure 124: Europe Piston Fillers Market Volume (Units) Analysis by Form, 2017-2032
Figure 125: Europe Piston Fillers Market Value Share (%) and BPS Analysis by Form, 2022-2032
Figure 126: Europe Piston Fillers Market Y-o-Y Growth (%) Projections by Form, 2022-2032
Figure 127: Europe Piston Fillers Market Value (US$ Mn) Analysis by Product Type, 2017-2032
Figure 128: Europe Piston Fillers Market Volume (Units) Analysis by Product Type, 2017-2032
Figure 129: Europe Piston Fillers Market Value Share (%) and BPS Analysis by Product Type, 2022-2032
Figure 130: Europe Piston Fillers Market Y-o-Y Growth (%) Projections by Product Type, 2022-2032
Figure 131: Europe Piston Fillers Market Value (US$ Mn) Analysis by Design, 2017-2032
Figure 132: Europe Piston Fillers Market Volume (Units) Analysis by Design, 2017-2032
Figure 133: Europe Piston Fillers Market Value Share (%) and BPS Analysis by Design, 2022-2032
Figure 134: Europe Piston Fillers Market Y-o-Y Growth (%) Projections by Design, 2022-2032
Figure 135: Europe Piston Fillers Market Value (US$ Mn) Analysis by Application, 2017-2032
Figure 136: Europe Piston Fillers Market Volume (Units) Analysis by Application, 2017-2032
Figure 137: Europe Piston Fillers Market Value Share (%) and BPS Analysis by Application, 2022-2032
Figure 138: Europe Piston Fillers Market Y-o-Y Growth (%) Projections by Application, 2022-2032
Figure 139: Europe Piston Fillers Market Attractiveness by Process Type, 2022-2032
Figure 140: Europe Piston Fillers Market Attractiveness by Form, 2022-2032
Figure 141: Europe Piston Fillers Market Attractiveness by Product Type, 2022-2032
Figure 142: Europe Piston Fillers Market Attractiveness by Design, 2022-2032
Figure 143: Europe Piston Fillers Market Attractiveness by Application, 2022-2032
Figure 144: Europe Piston Fillers Market Attractiveness by Country, 2022-2032
Figure 145: Asia Pacific Piston Fillers Market Value (US$ Mn) by Process Type, 2022-2032
Figure 146: Asia Pacific Piston Fillers Market Value (US$ Mn) by Form, 2022-2032
Figure 147: Asia Pacific Piston Fillers Market Value (US$ Mn) by Product Type, 2022-2032
Figure 148: Asia Pacific Piston Fillers Market Value (US$ Mn) by Design, 2022-2032
Figure 149: Asia Pacific Piston Fillers Market Value (US$ Mn) by Application, 2022-2032
Figure 150: Asia Pacific Piston Fillers Market Value (US$ Mn) by Country, 2022-2032
Figure 151: Asia Pacific Piston Fillers Market Value (US$ Mn) Analysis by Country, 2017-2032
Figure 152: Asia Pacific Piston Fillers Market Volume (Units) Analysis by Country, 2017-2032
Figure 153: Asia Pacific Piston Fillers Market Value Share (%) and BPS Analysis by Country, 2022-2032
Figure 154: Asia Pacific Piston Fillers Market Y-o-Y Growth (%) Projections by Country, 2022-2032
Figure 155: Asia Pacific Piston Fillers Market Value (US$ Mn) Analysis by Process Type, 2017-2032
Figure 156: Asia Pacific Piston Fillers Market Volume (Units) Analysis by Process Type, 2017-2032
Figure 157: Asia Pacific Piston Fillers Market Value Share (%) and BPS Analysis by Process Type, 2022-2032
Figure 158: Asia Pacific Piston Fillers Market Y-o-Y Growth (%) Projections by Process Type, 2022-2032
Figure 159: Asia Pacific Piston Fillers Market Value (US$ Mn) Analysis by Form, 2017-2032
Figure 160: Asia Pacific Piston Fillers Market Volume (Units) Analysis by Form, 2017-2032
Figure 161: Asia Pacific Piston Fillers Market Value Share (%) and BPS Analysis by Form, 2022-2032
Figure 162: Asia Pacific Piston Fillers Market Y-o-Y Growth (%) Projections by Form, 2022-2032
Figure 163: Asia Pacific Piston Fillers Market Value (US$ Mn) Analysis by Product Type, 2017-2032
Figure 164: Asia Pacific Piston Fillers Market Volume (Units) Analysis by Product Type, 2017-2032
Figure 165: Asia Pacific Piston Fillers Market Value Share (%) and BPS Analysis by Product Type, 2022-2032
Figure 166: Asia Pacific Piston Fillers Market Y-o-Y Growth (%) Projections by Product Type, 2022-2032
Figure 167: Asia Pacific Piston Fillers Market Value (US$ Mn) Analysis by Design, 2017-2032
Figure 168: Asia Pacific Piston Fillers Market Volume (Units) Analysis by Design, 2017-2032
Figure 169: Asia Pacific Piston Fillers Market Value Share (%) and BPS Analysis by Design, 2022-2032
Figure 170: Asia Pacific Piston Fillers Market Y-o-Y Growth (%) Projections by Design, 2022-2032
Figure 171: Asia Pacific Piston Fillers Market Value (US$ Mn) Analysis by Application, 2017-2032
Figure 172: Asia Pacific Piston Fillers Market Volume (Units) Analysis by Application, 2017-2032
Figure 173: Asia Pacific Piston Fillers Market Value Share (%) and BPS Analysis by Application, 2022-2032
Figure 174: Asia Pacific Piston Fillers Market Y-o-Y Growth (%) Projections by Application, 2022-2032
Figure 175: Asia Pacific Piston Fillers Market Attractiveness by Process Type, 2022-2032
Figure 176: Asia Pacific Piston Fillers Market Attractiveness by Form, 2022-2032
Figure 177: Asia Pacific Piston Fillers Market Attractiveness by Product Type, 2022-2032
Figure 178: Asia Pacific Piston Fillers Market Attractiveness by Design, 2022-2032
Figure 179: Asia Pacific Piston Fillers Market Attractiveness by Application, 2022-2032
Figure 180: Asia Pacific Piston Fillers Market Attractiveness by Country, 2022-2032
Figure 181: Middle East and Africa Piston Fillers Market Value (US$ Mn) by Process Type, 2022-2032
Figure 182: Middle East and Africa Piston Fillers Market Value (US$ Mn) by Form, 2022-2032
Figure 183: Middle East and Africa Piston Fillers Market Value (US$ Mn) by Product Type, 2022-2032
Figure 184: Middle East and Africa Piston Fillers Market Value (US$ Mn) by Design, 2022-2032
Figure 185: Middle East and Africa Piston Fillers Market Value (US$ Mn) by Application, 2022-2032
Figure 186: Middle East and Africa Piston Fillers Market Value (US$ Mn) by Country, 2022-2032
Figure 187: Middle East and Africa Piston Fillers Market Value (US$ Mn) Analysis by Country, 2017-2032
Figure 188: Middle East and Africa Piston Fillers Market Volume (Units) Analysis by Country, 2017-2032
Figure 189: Middle East and Africa Piston Fillers Market Value Share (%) and BPS Analysis by Country, 2022-2032
Figure 190: Middle East and Africa Piston Fillers Market Y-o-Y Growth (%) Projections by Country, 2022-2032
Figure 191: Middle East and Africa Piston Fillers Market Value (US$ Mn) Analysis by Process Type, 2017-2032
Figure 192: Middle East and Africa Piston Fillers Market Volume (Units) Analysis by Process Type, 2017-2032
Figure 193: Middle East and Africa Piston Fillers Market Value Share (%) and BPS Analysis by Process Type, 2022-2032
Figure 194: Middle East and Africa Piston Fillers Market Y-o-Y Growth (%) Projections by Process Type, 2022-2032
Figure 195: Middle East and Africa Piston Fillers Market Value (US$ Mn) Analysis by Form, 2017-2032
Figure 196: Middle East and Africa Piston Fillers Market Volume (Units) Analysis by Form, 2017-2032
Figure 197: Middle East and Africa Piston Fillers Market Value Share (%) and BPS Analysis by Form, 2022-2032
Figure 198: Middle East and Africa Piston Fillers Market Y-o-Y Growth (%) Projections by Form, 2022-2032
Figure 199: Middle East and Africa Piston Fillers Market Value (US$ Mn) Analysis by Product Type, 2017-2032
Figure 200: Middle East and Africa Piston Fillers Market Volume (Units) Analysis by Product Type, 2017-2032
Figure 201: Middle East and Africa Piston Fillers Market Value Share (%) and BPS Analysis by Product Type, 2022-2032
Figure 202: Middle East and Africa Piston Fillers Market Y-o-Y Growth (%) Projections by Product Type, 2022-2032
Figure 203: Middle East and Africa Piston Fillers Market Value (US$ Mn) Analysis by Design, 2017-2032
Figure 204: Middle East and Africa Piston Fillers Market Volume (Units) Analysis by Design, 2017-2032
Figure 205: Middle East and Africa Piston Fillers Market Value Share (%) and BPS Analysis by Design, 2022-2032
Figure 206: Middle East and Africa Piston Fillers Market Y-o-Y Growth (%) Projections by Design, 2022-2032
Figure 207: Middle East and Africa Piston Fillers Market Value (US$ Mn) Analysis by Application, 2017-2032
Figure 208: Middle East and Africa Piston Fillers Market Volume (Units) Analysis by Application, 2017-2032
Figure 209: Middle East and Africa Piston Fillers Market Value Share (%) and BPS Analysis by Application, 2022-2032
Figure 210: Middle East and Africa Piston Fillers Market Y-o-Y Growth (%) Projections by Application, 2022-2032
Figure 211: Middle East and Africa Piston Fillers Market Attractiveness by Process Type, 2022-2032
Figure 212: Middle East and Africa Piston Fillers Market Attractiveness by Form, 2022-2032
Figure 213: Middle East and Africa Piston Fillers Market Attractiveness by Product Type, 2022-2032
Figure 214: Middle East and Africa Piston Fillers Market Attractiveness by Design, 2022-2032
Figure 215: Middle East and Africa Piston Fillers Market Attractiveness by Application, 2022-2032
Figure 216: Middle East and Africa Piston Fillers Market Attractiveness by Country, 2022-2032
The global piston fillers market is set to surpass USD 67.3 Billion in 2032.
North America is set to lead the piston fillers market in the forecast period.
Biner-Ellison Packaging Systems, All-Fill Inc., Busch Machinery, Cleveland Equipment & Machinery, and Accutek Packaging Equipment Companies, Inc. are some of the renowned companies in the piston fillers market.
Explore Similar Insights
Thank you!
You will receive an email from our Business Development Manager. Please be sure to check your SPAM/JUNK folder too.