Fillers & Extenders Market Size and Share Forecast Outlook 2025 to 2035

The global Fillers & Extenders Market has been valued at USD 2,401.40 Million in 2025 and is projected to reach USD 5,102.30 Million by 2035, marking an incremental gain of USD 2,700.90 Million across the decadeThe expansion equates to a 7.80% CAGR, more than doubling the market value within the forecast horizon.
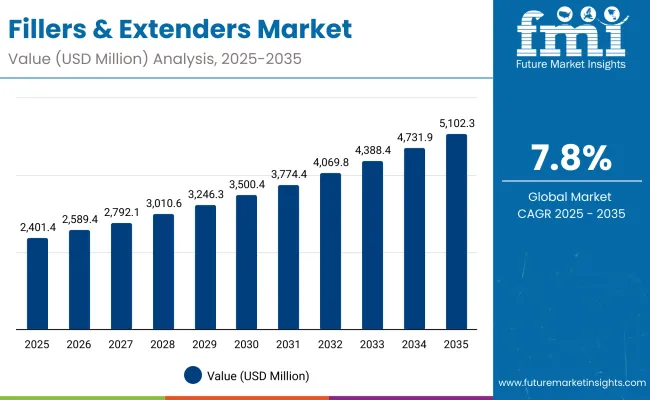
Quick Stats for Fillers & Extenders Market

  • Fillers & Extenders Market Value (2025): USD 2,401.40 Million
  • Fillers & Extenders Market Forecast Value (2035): USD 5,102.30 Million
  • Fillers & Extenders Market Forecast CAGR (2025 to 2035): 7.80%
  • Leading Segment in 2025: Silica (34.20%)
  • Key Growth Regions in the Fillers & Extenders Market: China, India, Japan, Europe, USA.
  • Top Key Players in the Fillers & Extenders Market: BASF, Clariant, Evonik, Merck KGaA, Croda, Sensient, Givaudan, Ashland, Kobo Products, Seppic

Fillers And Extenders Market

Fillers & Extenders Market Key Takeaways

Metric Value
Fillers & Extenders Market Estimated Value in (2025E) USD 2,401.40 Million
Fillers & Extenders Market Forecast Value in (2035F) USD 5,102.30 Million
Forecast CAGR (2025 to 2035) 7.80%

The trajectory reflects consistent demand acceleration across personal care, skincare, and color cosmetics, where texture modification, soft-focus performance, and stability optimization continue to be prioritized in B2B formulation strategies.

During the first five years, from 2025 to 2030, the market is set to rise from USD 2,401.40 Million to USD 3,500.40 Million, accounting for USD 1,099.00 Million of additional value, or 41% of decade growth. This phase is expected to witness steady adoption in face powders & foundations as leading brands seek blurring and mattifying benefits that support premium sensorial positioning. Silica is anticipated to dominate the material mix with 34.20% share in 2025, reflecting its role in opacity control and stability enhancement within pressed and loose powder systems.

From 2030 to 2035, the market is projected to expand from USD 3,500.40 Million to USD 5,102.30 Million, delivering USD 1,601.90 Million of growth, or 59% of total decade gains. This acceleration is likely to be driven by rising hybrid skincare-makeup launches and stronger penetration of optical-enhancement claims in mass markets. Face powders & foundations are expected to hold a leading 42.10% application share, while texture modification will remain the key function at 39.30% share in 2025, sustaining demand momentum for engineered filler solutions across global formulations.

From 2020 to 2024, the Fillers & Extenders Market advanced steadily as demand for optical blurring, mattifying, and rheology-modifying solutions in personal care accelerated. Suppliers with strong formulation support and validated purity profiles captured competitive advantage, particularly in color cosmetics and premium skincare formulations. By 2025, demand will expand to USD 2,401.40 Million, and the market is expected to more than double by 2035, reaching USD 5,102.30 Million with sustained 7.80% CAGR.

The competitive landscape is anticipated to remain fragmented, with BASF leading at 8.40% share, while niche ingredient specialists continue to scale presence through texture innovation and clean-label compliance.Value creation is expected to shift toward engineered particle morphology and multifunctional filler systems that align with hybrid makeup-skincare trends and pharmaceutical-grade topicals.Regions such as China and India are forecast to post double-digit CAGRs, reshaping global demand flows. The advantage is projected to migrate from raw material supply alone to holistic ecosystem support, documentation rigor, and responsiveness to evolving regulatory thresholds.

Why the Fillers & Extenders Market is growing?

Growth in the Fillers & Extenders Market is being driven by rising demand for advanced formulation ingredients that enhance texture, opacity, and stability in personal care and cosmetic products. Increased consumer preference for hybrid makeup-skincare solutions has accelerated the use of engineered fillers that deliver both functional and sensorial benefits. Optical performance attributes such as blurring, mattifying, and soft-focus effects are being prioritized as brands seek differentiation in complexion and color cosmetics.

Expansion is also being fueled by strong momentum in emerging markets, where rising disposable incomes and rapid urbanization are increasing uptake of premium personal-care products. In regions such as China and India, double-digit growth rates are projected, supported by innovation in dermocosmetic lines and pharmaceutical topicals. Regulatory tightening around safety and heavy-metal control is encouraging the adoption of high-purity fillers with validated traceability, favoring suppliers with advanced quality systemas. As sustainable and multifunctional ingredient solutions gain traction, the Fillers & Extenders Market is expected to remain on a strong upward trajectory through 2035.

Segmental Analysis

The Fillers & Extenders Market has been segmented by material type, function, and application, offering insights into how demand is distributed across the industry. These categories reflect the evolving role of fillers in enhancing texture, stability, and sensory performance across cosmetic and personal care formulations. By material type, differences in particle morphology and chemical properties shape adoption in powders, creams, and hybrid systems. By function, texture modification, oil control, and optical effects guide selection in both skincare and color cosmetics. Applications further reveal demand clustering in face powders, foundations, and emulsions, where visual finish and formulation consistency are critical. Understanding these segments highlights how functional benefits and consumer-driven claims are shaping procurement decisions, creating opportunities for suppliers to position specialized ingredients across value-added formulations.
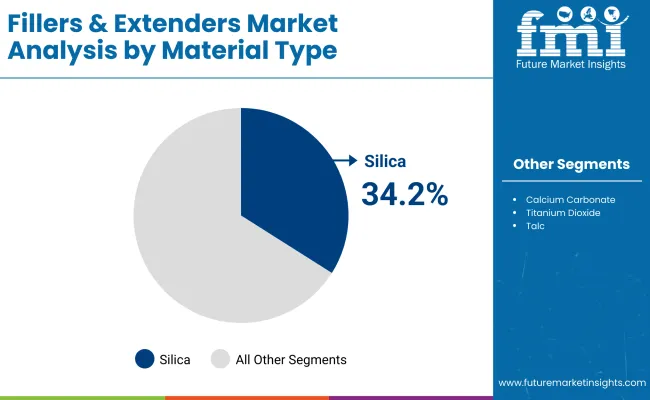
Insights into the Material Type Segment with Silica Leading Market Share

Fillers And Extenders Market By Material Type

Material Type Market Value Share, 2025
Silica 34.2%
Others 65.8%

Silica is projected to account for 34.20% share (USD 821.28 Million) in 2025, while other materials collectively represent 65.80% share (USD 1,580.12 Million) in the Fillers & Extenders Market. Silica is being adopted for its opacity control, rheology balance, and soft-focus effects that align with premium skincare and complexion products. Growth is expected to be supported by rising demand for lightweight textures and oil-control properties in both mass and prestige formulations. Alternatives are projected to remain vital due to cost-performance optimization and broad compatibility. Innovation in particle engineering is likely to sustain competition across material classes, ensuring silica retains its strategic role while other materials support diverse formulation needs.
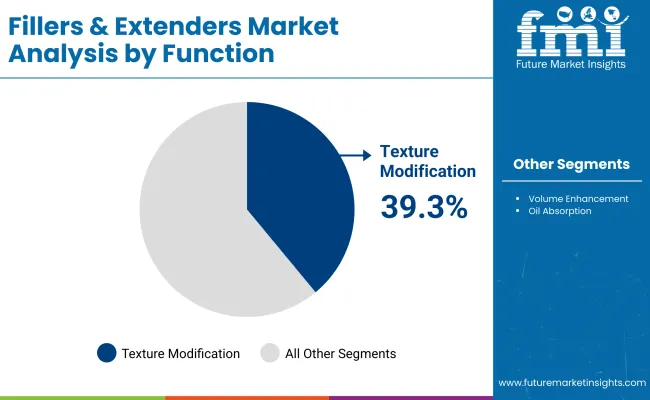
Insights into the Function Segment with Texture Modification Dominating Demand

Fillers And Extenders Market By Function

Function Market Value Share, 2025
Texture modification 39.3%
Others 60.7%

Texture modification is anticipated to capture 39.30% share (USD 943.75 Million) in 2025, while other functions hold 60.70% share (USD 1,457.65 Million) in the Fillers & Extenders Market. Demand is being shaped by preference for smooth, spreadable formulations that enhance coverage, payoff, and sensorial elegance across cosmetics and skincare. Hybrid products that merge skincare efficacy with cosmetic performance are expected to reinforce the dominance of this segment. Long-wear and transfer-resistant claims are projected to further drive adoption, positioning texture-focused fillers at the center of formulation innovation. While other functions collectively maintain a larger share, texture modification is likely to remain the primary driver of adoption across the decade.
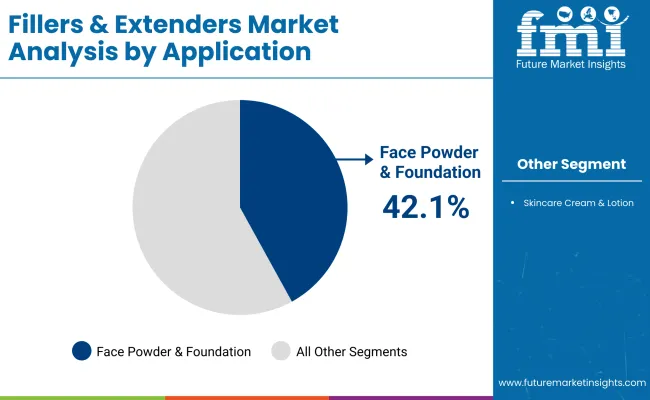
Insights into the Application Segment with Face Powders & Foundations Driving Growth

Fillers And Extenders Market By Application

Application Market Value Share, 2025
Face powders & foundations 42.1%
Others 57.9%

Face powders & foundations are forecasted to command 42.10% share (USD 1,010.99 Million) in 2025, while other applications represent 57.90% share (USD 1,390.41 Million) in the Fillers & Extenders Market. This leadership reflects sustained demand for complexion-enhancing products that provide mattifying, blurring, and oil-absorbing benefits. Consumer preference for hybrid formulations that combine color coverage with skincare attributes is expected to strengthen this trend. Increasing demand for long-wear, natural finish, and transfer-resistant performance is projected to deepen reliance on engineered fillers tailored for optical and tactile effects. Although other applications such as skincare creams, lotions, and color cosmetics are expanding, face powders & foundations are anticipated to remain the anchor of filler consumption globally.

What are the Drivers, Restraints, and Key Trends of the Fillers & Extenders Market?

Complex formulation needs, regulatory scrutiny, and evolving consumer expectations are reshaping the Fillers & Extenders Market, where functional innovation and compliance assurance are weighed against margin pressures, driving both opportunities and constraints in ingredient adoption across global personal care and cosmetic applications.

Shift Toward Multifunctional Ingredient Platforms

A significant driver is being observed in the transition from single-function fillers to multifunctional ingredient platforms that combine optical enhancement, oil absorption, and texture modulation within a single material class.This evolution is projected to reduce formulation complexity and streamline supply chains for brand owners seeking efficiency in high-volume SKUs. Functional layering is expected to be minimized, enabling cleaner label claims and faster development cycles. Integration of multifunctional fillers into hybrid skincare-makeup products is anticipated to accelerate, as demand shifts toward versatile solutions that enhance both performance and sustainability credentials. Suppliers with validated multifunctional profiles are likely to secure preferred-vendor status, reflecting heightened procurement prioritization of cost-efficiency and reduced inventory redundancy.

Regulatory-Driven Transparency in Ingredient Profiling

A defining trend is being shaped by intensified regulatory oversight requiring greater transparency in filler characterization, including crystalline silica thresholds, heavy-metal testing, and traceability of raw materials. Formulators are expected to demand granular data sheets supported by third-party validations to protect against compliance risks. Consumer-facing communication strategies are anticipated to extend beyond basic safety assurance, emphasizing ethical sourcing, sustainability certifications, and region-specific regulatory alignment. As digital ingredient passports and blockchain-backed traceability tools become more widely adopted, suppliers demonstrating transparent disclosure practices are projected to gain competitive advantage. This shift toward regulatory-driven transparency is expected to redefine supplier selection criteria and elevate documentation from a compliance formality to a central element of brand equity.
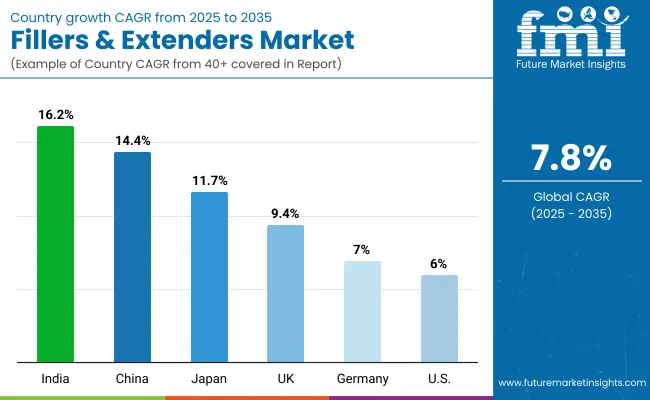
Analysis of Fillers & Extenders Market By Key Countries

Country Wise Fillers And Extenders Market

Country CAGR
China 14.4%
USA 6.0%
India 16.2%
UK 9.4%
Germany 7.0%
Japan 11.7%

The Fillers & Extenders Market demonstrates varied growth momentum across major economies, shaped by differences in consumer behavior, industrial sophistication, and regulatory intensity. India is projected to record the fastest trajectory at 16.2% CAGR, supported by accelerated penetration of premium personal care and skincare products, alongside expansion of local manufacturing hubs catering to export-driven formulations. China follows closely with 14.4% CAGR, where strong domestic demand for hybrid skincare-makeup formats and government focus on quality compliance are expected to sustain rapid adoption. Local suppliers are anticipated to leverage cost-competitive manufacturing, while global players expand presence through innovation partnerships.

Japan, at 11.7% CAGR, is likely to benefit from its established beauty culture emphasizing texture and sensorial performance, driving reliance on advanced filler technologies.The UK and broader Europe, with 9.4% and 8.7% CAGRs respectively, are anticipated to maintain steady growth anchored by stringent regulatory frameworks and demand for clean-label ingredients. Germany, at 7.0%, reflects the influence of high-quality assurance standards that drive reliance on traceable and compliant filler systems. The USA is expected to expand at a more moderate 6.0% CAGR, reflecting market maturity and high baseline penetration, with incremental growth sustained by multifunctional ingredient innovation and evolving consumer claims around transparency and safety.
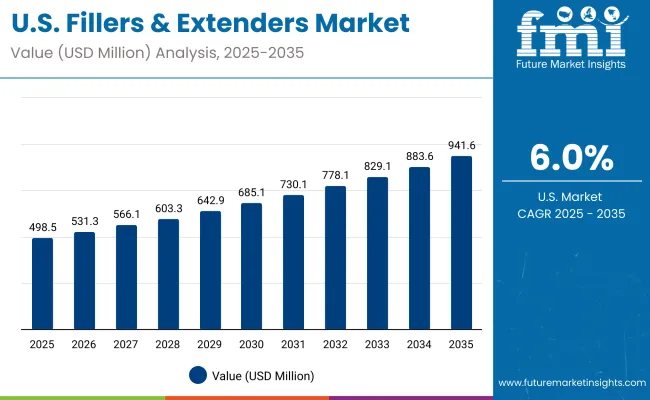
Sales Outlook for Fillers & Extenders in the United States

Usa Fillers And Extenders Market

Year USA Fillers & Extenders Market (USD Million)
2025 498.57
2026 531.30
2027 566.19
2028 603.36
2029 642.97
2030 685.18
2031 730.16
2032 778.10
2033 829.18
2034 883.61
2035 941.62

The Fillers & Extenders Market in the United States is projected to grow at a CAGR of 6.0% during 2025-2035, supported by steady expansion in cosmetics, skincare, and pharmaceutical topicals.Increasing alignment with multifunctional fillers designed to provide texture modification and blurring benefits is expected to strengthen adoption across face powders, foundations, and hybrid skincare-makeup products.

High regulatory scrutiny regarding heavy-metal content and crystalline silica thresholds is likely to reinforce supplier selection based on compliance and documentation rigor.Formulators are expected to prefer partners capable of delivering consistent particle morphology and validated safety profiles to support evolving product claims.

  • The growth of hybrid formulations combining skincare and makeup is creating new opportunities for silica-based fillers in complexion products.
  • Stringent USA regulatory compliance standards are shaping supplier competitiveness, with traceability and purity certification projected to become critical differentiators.

Growth and Expansion Outlook for Fillers & Extenders Market in the United Kingdom

The Fillers & Extenders Market in the United Kingdom is projected to grow at a CAGR of 9.4% between 2025 and 2035, supported by rising emphasis on clean-label and regulatory-compliant formulations.Gradual adoption of multifunctional fillers is anticipated as cosmetic and skincare brands seek ingredients that deliver texture modification and stability alongside sustainability assurances.Formulation shifts are expected to prioritize traceable ingredients due to growing consumer scrutiny and evolving compliance standards.Hybrid formulations combining functional performance with natural positioning are projected to expand rapidly in both skincare and color cosmetics.Procurement teams are expected to reward suppliers demonstrating low-carbon footprints and advanced safety testing frameworks.

  • Demand for clean-label, traceable ingredients is strengthening supplier differentiation.
  • Hybrid skincare-makeup formats are accelerating filler adoption in complexion products.
  • Regulatory compliance and sustainability are shaping purchasing decisions.
  • Local innovation hubs are supporting adoption of advanced filler technologies.

Growth and Expansion Outlook for Fillers & Extenders Market in India

The Fillers & Extenders Market in India is expected to expand at the fastest CAGR of 16.2% from 2025 to 2035, reflecting strong consumer appetite for premium skincare and cosmetics.Increased urbanization and rising disposable incomes are projected to support large-scale adoption.Face powders and foundations are anticipated to anchor demand, reflecting cultural preferences for complexion-focused products.Local manufacturers are expected to strengthen competitiveness by integrating advanced fillers into mass and premium lines, addressing both affordability and performance.Consumer expectations for sensorial benefits and natural finish are projected to boost reliance on engineered fillers with multifunctional properties.International suppliers are anticipated to collaborate with local partners to secure market access while aligning with evolving safety and documentation frameworks.

  • Complexion-driven preferences are reinforcing demand for fillers in color cosmetics.
  • Hybrid products are creating opportunities for multifunctional filler adoption.
  • Local production hubs are expanding global supply chain integration.
  • International partnerships are strengthening distribution and compliance alignment.

Sales Outlook for Fillers & Extenders in China

The Fillers & Extenders Market in China is forecasted to grow at a CAGR of 14.4% during 2025-2035, driven by rapid expansion of hybrid skincare-makeup formats and strong consumer preference for texture-enhancing ingredients.Urban millennial and Gen Z consumers are expected to prioritize products delivering blurring, mattifying, and long-wear benefits, fueling demand for silica and multifunctional fillers.Local suppliers are projected to scale production capacity, while multinational firms are anticipated to invest in R&D hubs and compliance frameworks to address China’s evolving regulatory environment.Premium brands are expected to integrate engineered fillers into formulations offering sensorial elegance, while mid-tier players are projected to focus on cost-performance optimization.
  • Hybrid skincare-makeup adoption is accelerating demand for fillers.
  • Regulatory frameworks are increasing demand for traceable and certified inputs
  • Local suppliers are enhancing competitiveness with scaled production.
  • Multinational R&D hubs are strengthening compliance and innovation.

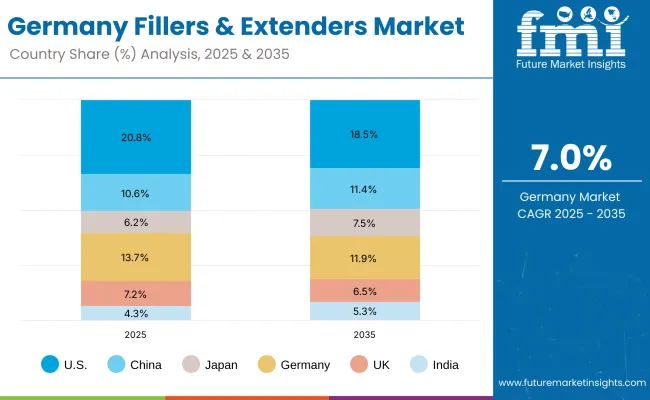
In-depth Analysis of Fillers & Extenders in Germany

Europe Fillers And Extenders Market

Country 2025
USA 20.8%
China 10.6%
Japan 6.2%
Germany 13.7%
UK 7.2%
India 4.3%
Country 2035
USA 18.5%
China 11.4%
Japan 7.5%
Germany 11.9%
UK 6.5%
India 5.3%

The Fillers & Extenders Market in Germany is projected to expand at a CAGR of 7.0% between 2025 and 2035, supported by stringent regulatory oversight and demand for high-purity fillers within cosmetic and pharmaceutical formulations.Procurement strategies are anticipated to focus on suppliers delivering robust documentation, validated purity profiles, and sustainability certifications to comply with EU standards.Growth is expected to be reinforced by dermocosmetic and prescription-linked skincare channels, where tolerability and safety are prioritized.Germany’s role as a hub for regulatory-driven innovation is anticipated to create opportunities for suppliers investing in eco-friendly filler solutions.Local consumer demand for clean, sustainable, and dermatologically tested formulations is expected to influence the adoption of advanced particle-engineered fillers.
  • Strict EU compliance is reinforcing demand for high-purity fillers.
  • Dermocosmetic channels are supporting advanced filler uptake.
  • Sustainability-linked certifications are shaping supplier competitiveness.
  • Germany’s innovation ecosystem is driving eco-friendly filler development.

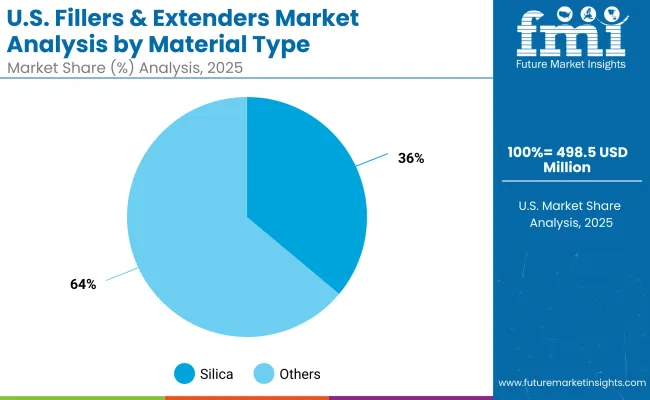
Growth Outlook for Fillers & Extenders Market in USA

Usa Fillers And Extenders Market1

USA By Material Type Market Value Share, 2025
Silica 36.1%
Others 63.9%

The Fillers & Extenders Market in the USA is projected at USD 498.57 Million in 2025.Silica contributes 36.1%, while other materials hold 63.9%, reflecting a diverse material mix shaped by both performance-driven and cost-sensitive choices.The strong role of silica stems from its ability to deliver soft-focus, opacity control, and rheology balance, which are critical for face powders and foundations.Others collectively dominate due to broader availability and flexibility across emulsions, pressed powders, and hybrid systems.

Growth is expected to be influenced by compliance with stringent USA safety standards, driving preference for fillers with validated purity and traceable supply chains.Engineered silica is projected to gain higher value over the decade as multifunctional performance and regulatory alignment become decisive factors in procurement.
  • The USA Fillers & Extenders Market is valued at USD 498.57 Million in 2025
  • Silica accounts for 36.1% share, supported by demand in complexion products
  • Others dominate with 63.9% share, reflecting broader adoption in diverse formulations
  • Compliance-driven selection and multifunctional innovation are shaping long-term growth

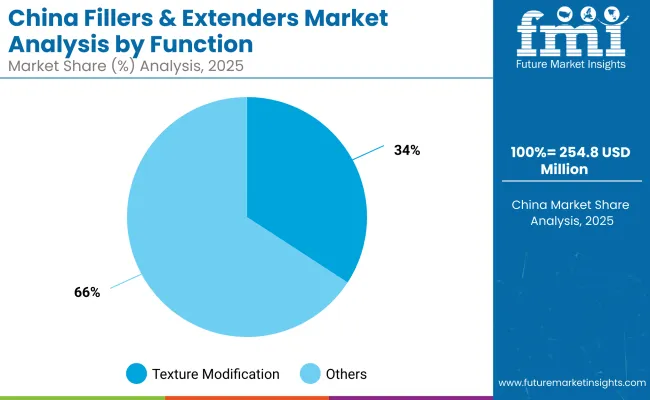
Opportunity Analysis of China Fillers & Extenders Market

China Fillers And Extenders Market

China By Function Market Value Share, 2025
Texture modification 34.2%
Others 65.8%

The Fillers & Extenders Market in China is projected at USD 254.83 Million in 2025.Texture modification contributes 34.2%, while other functions account for 65.8%, reflecting balanced reliance on performance-enhancing fillers across diverse product categories.Texture modification is being prioritized as local brands emphasize sensorial excellence, smooth payoff, and improved spreadability in complexion-focused and hybrid skincare-makeup formats.

Growth is anticipated to be reinforced by consumer expectations for natural finish, long-wear stability, and pore-blurring claims, making texture-driven fillers essential in premium and mass segments.Other functions remain dominant, as fillers continue to be integrated into a wider range of formulations including emulsions, creams, and lotions, supporting both performance and affordability.
  • The China Fillers & Extenders Market is valued at USD 254.83 Million in 2025
  • Texture modification accounts for 34.2% share, driven by demand for smooth, spreadable formulations
  • Others dominate with 65.8% share, reflecting broad integration into creams and lotions
  • Hybrid makeup-skincare trends and premium sensorial claims are expected to accelerate future adoption

Competitive Landscape of Fillers & Extenders Market

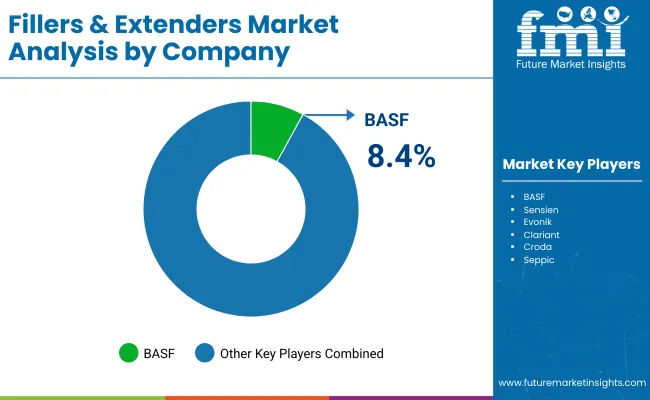
Fillers And Extenders Market By Company

Company Global Value Share 2025
BASF 8.4%
Others 91.6%

The Fillers & Extenders Market is moderately fragmented, with global chemical majors, regional suppliers, and niche specialists competing across personal care, cosmetic, and pharmaceutical applications.BASF is identified as the leading player, holding 8.4% global market share in 2025, while the remaining 91.6% is distributed among a wide array of competitors.Strategies of leading players are increasingly oriented toward multifunctional filler platforms, compliance assurance, and sustainability certifications to address rising consumer and regulatory demands.

BASF’s scale, product diversification, and global supply chain presence enable it to maintain dominance, especially in high-volume categories such as face powders and foundations.Mid-sized companies including Clariant, Evonik, and Merck KGaA are focusing on specialty grades, emphasizing clean-label claims and advanced particle engineering to strengthen positioning in premium skincare and dermocosmetic segments.

Specialist ingredient companies such as Croda, Sensient, Kobo Products, and Seppic are advancing by tailoring formulations to niche consumer demands, particularly in hybrid makeup-skincare and sustainable ingredient solutions.The competitive advantage is shifting toward suppliers capable of providing regulatory-compliant, high-purity fillers with validated traceability, supported by digital product passports and lifecycle transparency frameworks.

Competitive differentiation is expected to intensify as formulation houses prioritize suppliers delivering documentation rigor, sensorial libraries, and global service reliability, beyond simple material availability.

Key Developments in Fillers & Extenders Market

  • In February 2025, Symatese secured FDA approval for Evolysse Form and Evolysse Smooth injectable hyaluronic acid gels for the USA market. These products using Cold-X™ technology were positioned to offer longer-lasting, natural-looking results in aesthetic filler applications.
  • In June 2025, Evolus’s Evolysse line was recognized in the Shape Skin Awards as “Best Filler” shortly after its launch. The recognition highlighted its Cold-X technology and elevated its visibility in performance beauty and aesthetic injectable portfolios.

Scope of the Report

Item Value
Market Size (2025E) USD 2,401.40 Million
Market Size (2035F) USD 5,102.30 Million
Forecast CAGR (2025-2035) 7.80%
Time Horizon 2025 to 2035
Material Type Silica; Others
Function Texture modification; Others
Application Face powders & foundations; Others
End-use Industry Cosmetics & skincare; Personal care toiletries; Pharmaceutical topicals
Regions Covered North America; Europe; East Asia; South Asia & Pacific; Latin America; Middle East & Africa
Countries Covered United States; China; India; United Kingdom; Germany; Japan
Key Companies Profiled BASF; Clariant; Evonik; Merck KGaA; Croda; Sensient; Givaudan; Ashland; Kobo Products; Seppic
Additional Attributes 2025 shares: Silica 34.20% (USD 821.28 Million); Texture modification 39.30% (USD 943.75 Million); Face powders & foundations 42.10% (USD 1,010.99 Million). Country CAGRs (2025-2035): India 16.20%, China 14.40%, Japan 11.70%, UK 9.40%, Germany 7.00%, USA 6.00%. Competitive split: BASF 8.40% (Global Value Share 2025).

Key Segments

By Material Type:

  • Silica
  • Calcium carbonate
  • Titanium dioxide
  • Talc
  • Polymeric microspheres

By Function:

  • Texture modification
  • Volume enhancement
  • Oil absorption
  • Soft-focus/blur effect

By Application:

  • Face powders & foundations
  • Skincare creams & lotions
  • Color cosmetics
  • Sun care

By Physical Form:

  • Powder
  • Granule
  • Dispersion

By End Use:

  • Cosmetics & skincare
  • Personal care toiletries
  • Pharmaceutical topicals

By Region:

  • North America
  • Latin America
  • Europe
  • East Asia
  • South Asia & Pacific
  • Middle East and Africa

Table of Content

  1. Executive Summary
    • Global Market Outlook
    • Demand-side Trends
    • Supply-side Trends
    • Technology Roadmap Analysis
    • Analysis and Recommendations
  2. Market Overview
    • Market Coverage / Taxonomy
    • Market Definition / Scope / Limitations
  3. Market Background
    • Market Dynamics
      • Drivers
      • Restraints
      • Opportunity
      • Trends
    • Scenario Forecast
      • Demand in Optimistic Scenario
      • Demand in Likely Scenario
      • Demand in Conservative Scenario
    • Opportunity Map Analysis
    • Product Life Cycle Analysis
    • Supply Chain Analysis
      • Supply Side Participants and their Roles
        • Producers
        • Mid-Level Participants (Traders/ Agents/ Brokers)
        • Wholesalers and Distributors
      • Value Added and Value Created at Node in the Supply Chain
      • List of Raw Material Suppliers
      • List of Existing and Potential Buyer’s
    • Investment Feasibility Matrix
    • Value Chain Analysis
      • Profit Margin Analysis
      • Wholesalers and Distributors
      • Retailers
    • PESTLE and Porter’s Analysis
    • Regulatory Landscape
      • By Key Regions
      • By Key Countries
    • Regional Parent Market Outlook
    • Production and Consumption Statistics
    • Import and Export Statistics
  4. Global Market Analysis 2020 to 2024 and Forecast, 2025 to 2035
    • Historical Market Size Value (USD Million) & Volume (Units) Analysis, 2020 to 2024
    • Current and Future Market Size Value (USD Million) & Volume (Units) Projections, 2025 to 2035
      • Y-o-Y Growth Trend Analysis
      • Absolute $ Opportunity Analysis
  5. Global Market Analysis 2020 to 2024 and Forecast 2025 to 2035, By Material Type
    • Introduction / Key Findings
    • Historical Market Size Value (USD Million) & Volume (Units) Analysis By Material Type, 2020 to 2024
    • Current and Future Market Size Value (USD Million) & Volume (Units) Analysis and Forecast By Material Type, 2025 to 2035
      • Silica
      • Calcium carbonate
      • Titanium dioxide
      • Talc
      • Polymeric microspheres
    • Y-o-Y Growth Trend Analysis By Material Type, 2020 to 2024
    • Absolute $ Opportunity Analysis By Material Type, 2025 to 2035
  6. Global Market Analysis 2020 to 2024 and Forecast 2025 to 2035, By Function
    • Introduction / Key Findings
    • Historical Market Size Value (USD Million) & Volume (Units) Analysis By Function, 2020 to 2024
    • Current and Future Market Size Value (USD Million) & Volume (Units) Analysis and Forecast By Function, 2025 to 2035
      • Texture modification
      • Volume enhancement
      • Oil absorption
      • Soft-focus/blur effect
    • Y-o-Y Growth Trend Analysis By Function, 2020 to 2024
    • Absolute $ Opportunity Analysis By Function, 2025 to 2035
  7. Global Market Analysis 2020 to 2024 and Forecast 2025 to 2035, By Application
    • Introduction / Key Findings
    • Historical Market Size Value (USD Million) & Volume (Units) Analysis By Application, 2020 to 2024
    • Current and Future Market Size Value (USD Million) & Volume (Units) Analysis and Forecast By Application, 2025 to 2035
      • Face powders & foundations
      • Skincare creams & lotions
      • Color cosmetics
      • Sun care
    • Y-o-Y Growth Trend Analysis By Application, 2020 to 2024
    • Absolute $ Opportunity Analysis By Application, 2025 to 2035
  8. Global Market Analysis 2020 to 2024 and Forecast 2025 to 2035, By Physical Form
    • Introduction / Key Findings
    • Historical Market Size Value (USD Million) & Volume (Units) Analysis By Physical Form, 2020 to 2024
    • Current and Future Market Size Value (USD Million) & Volume (Units) Analysis and Forecast By Physical Form, 2025 to 2035
      • Powder
      • Granule
      • Dispersion
    • Y-o-Y Growth Trend Analysis By Physical Form, 2020 to 2024
    • Absolute $ Opportunity Analysis By Physical Form, 2025 to 2035
  9. Global Market Analysis 2020 to 2024 and Forecast 2025 to 2035, By End Use
    • Introduction / Key Findings
    • Historical Market Size Value (USD Million) & Volume (Units) Analysis By End Use, 2020 to 2024
    • Current and Future Market Size Value (USD Million) & Volume (Units) Analysis and Forecast By End Use, 2025 to 2035
      • Cosmetics & skincare
      • Personal care toiletries
      • Pharmaceutical topicals
    • Y-o-Y Growth Trend Analysis By End Use, 2020 to 2024
    • Absolute $ Opportunity Analysis By End Use, 2025 to 2035
  10. Global Market Analysis 2020 to 2024 and Forecast 2025 to 2035, By Region
    • Introduction
    • Historical Market Size Value (USD Million) & Volume (Units) Analysis By Region, 2020 to 2024
    • Current Market Size Value (USD Million) & Volume (Units) Analysis and Forecast By Region, 2025 to 2035
      • North America
      • Latin America
      • Europe
      • East Asia
      • South Asia & Pacific
      • Middle East and Africa
    • Market Attractiveness Analysis By Region
  11. North America Market Analysis 2020 to 2024 and Forecast 2025 to 2035, By Country
    • Historical Market Size Value (USD Million) & Volume (Units) Trend Analysis By Market Taxonomy, 2020 to 2024
    • Market Size Value (USD Million) & Volume (Units) Forecast By Market Taxonomy, 2025 to 2035
      • By Country
        • USA
        • Canada
      • By Material Type
      • By Function
      • By Application
      • By Physical Form
      • By End Use
    • Market Attractiveness Analysis
      • By Country
      • By Material Type
      • By Function
      • By Application
      • By Physical Form
      • By End Use
    • Key Takeaways
  12. Latin America Market Analysis 2020 to 2024 and Forecast 2025 to 2035, By Country
    • Historical Market Size Value (USD Million) & Volume (Units) Trend Analysis By Market Taxonomy, 2020 to 2024
    • Market Size Value (USD Million) & Volume (Units) Forecast By Market Taxonomy, 2025 to 2035
      • By Country
        • Brazil
        • Mexico
        • Colombia
        • Rest of Latin America
      • By Material Type
      • By Function
      • By Application
      • By Physical Form
      • By End Use
    • Market Attractiveness Analysis
      • By Country
      • By Material Type
      • By Function
      • By Application
      • By Physical Form
      • By End Use
    • Key Takeaways
  13. Europe Market Analysis 2020 to 2024 and Forecast 2025 to 2035, By Country
    • Historical Market Size Value (USD Million) & Volume (Units) Trend Analysis By Market Taxonomy, 2020 to 2024
    • Market Size Value (USD Million) & Volume (Units) Forecast By Market Taxonomy, 2025 to 2035
      • By Country
        • Germany
        • UK
        • France
        • Italy
        • Spain
        • Belgium
        • Netherlands
        • Nordic
        • Switzerland
        • Russia
        • Poland
        • Rest of Europe
      • By Material Type
      • By Function
      • By Application
      • By Physical Form
      • By End Use
    • Market Attractiveness Analysis
      • By Country
      • By Material Type
      • By Function
      • By Application
      • By Physical Form
      • By End Use
    • Key Takeaways
  14. East Asia Market Analysis 2020 to 2024 and Forecast 2025 to 2035, By Country
    • Historical Market Size Value (USD Million) & Volume (Units) Trend Analysis By Market Taxonomy, 2020 to 2024
    • Market Size Value (USD Million) & Volume (Units) Forecast By Market Taxonomy, 2025 to 2035
      • By Country
        • China
        • Japan
        • South Korea
      • By Material Type
      • By Function
      • By Application
      • By Physical Form
      • By End Use
    • Market Attractiveness Analysis
      • By Country
      • By Material Type
      • By Function
      • By Application
      • By Physical Form
      • By End Use
    • Key Takeaways
  15. South Asia & Pacific Market Analysis 2020 to 2024 and Forecast 2025 to 2035, By Country
    • Historical Market Size Value (USD Million) & Volume (Units) Trend Analysis By Market Taxonomy, 2020 to 2024
    • Market Size Value (USD Million) & Volume (Units) Forecast By Market Taxonomy, 2025 to 2035
      • By Country
        • India
        • Thailand
        • Malaysia
        • Indonesia
        • Singapore
        • Vietnam
        • Australia
        • New Zealand
        • Rest of South Asia
      • By Material Type
      • By Function
      • By Application
      • By Physical Form
      • By End Use
    • Market Attractiveness Analysis
      • By Country
      • By Material Type
      • By Function
      • By Application
      • By Physical Form
      • By End Use
    • Key Takeaways
  16. Middle East and Africa Market Analysis 2020 to 2024 and Forecast 2025 to 2035, By Country
    • Historical Market Size Value (USD Million) & Volume (Units) Trend Analysis By Market Taxonomy, 2020 to 2024
    • Market Size Value (USD Million) & Volume (Units) Forecast By Market Taxonomy, 2025 to 2035
      • By Country
        • Turkey
        • UAE
        • Saudi Arabia
        • Israel
        • Other GCC Countries
        • North Africa
        • South Africa
      • By Material Type
      • By Function
      • By Application
      • By Physical Form
      • By End Use
    • Market Attractiveness Analysis
      • By Country
      • By Material Type
      • By Function
      • By Application
      • By Physical Form
      • By End Use
    • Key Takeaways
  17. Key Countries Market Analysis
    • USA
      • Pricing Analysis
      • Market Share Analysis, 2024
        • By Material Type
        • By Function
        • By Application
        • By Physical Form
        • By End Use
    • Canada
      • Pricing Analysis
      • Market Share Analysis, 2024
        • By Material Type
        • By Function
        • By Application
        • By Physical Form
        • By End Use
    • Brazil
      • Pricing Analysis
      • Market Share Analysis, 2024
        • By Material Type
        • By Function
        • By Application
        • By Physical Form
        • By End Use
    • Mexico
      • Pricing Analysis
      • Market Share Analysis, 2024
        • By Material Type
        • By Function
        • By Application
        • By Physical Form
        • By End Use
    • Colombia
      • Pricing Analysis
      • Market Share Analysis, 2024
        • By Material Type
        • By Function
        • By Application
        • By Physical Form
        • By End Use
    • Germany
      • Pricing Analysis
      • Market Share Analysis, 2024
        • By Material Type
        • By Function
        • By Application
        • By Physical Form
        • By End Use
    • UK
      • Pricing Analysis
      • Market Share Analysis, 2024
        • By Material Type
        • By Function
        • By Application
        • By Physical Form
        • By End Use
    • France
      • Pricing Analysis
      • Market Share Analysis, 2024
        • By Material Type
        • By Function
        • By Application
        • By Physical Form
        • By End Use
    • Italy
      • Pricing Analysis
      • Market Share Analysis, 2024
        • By Material Type
        • By Function
        • By Application
        • By Physical Form
        • By End Use
    • Spain
      • Pricing Analysis
      • Market Share Analysis, 2024
        • By Material Type
        • By Function
        • By Application
        • By Physical Form
        • By End Use
    • Belgium
      • Pricing Analysis
      • Market Share Analysis, 2024
        • By Material Type
        • By Function
        • By Application
        • By Physical Form
        • By End Use
    • Netherlands
      • Pricing Analysis
      • Market Share Analysis, 2024
        • By Material Type
        • By Function
        • By Application
        • By Physical Form
        • By End Use
    • Nordic
      • Pricing Analysis
      • Market Share Analysis, 2024
        • By Material Type
        • By Function
        • By Application
        • By Physical Form
        • By End Use
    • Switzerland
      • Pricing Analysis
      • Market Share Analysis, 2024
        • By Material Type
        • By Function
        • By Application
        • By Physical Form
        • By End Use
    • Russia
      • Pricing Analysis
      • Market Share Analysis, 2024
        • By Material Type
        • By Function
        • By Application
        • By Physical Form
        • By End Use
    • Poland
      • Pricing Analysis
      • Market Share Analysis, 2024
        • By Material Type
        • By Function
        • By Application
        • By Physical Form
        • By End Use
    • China
      • Pricing Analysis
      • Market Share Analysis, 2024
        • By Material Type
        • By Function
        • By Application
        • By Physical Form
        • By End Use
    • Japan
      • Pricing Analysis
      • Market Share Analysis, 2024
        • By Material Type
        • By Function
        • By Application
        • By Physical Form
        • By End Use
    • South Korea
      • Pricing Analysis
      • Market Share Analysis, 2024
        • By Material Type
        • By Function
        • By Application
        • By Physical Form
        • By End Use
    • India
      • Pricing Analysis
      • Market Share Analysis, 2024
        • By Material Type
        • By Function
        • By Application
        • By Physical Form
        • By End Use
    • Thailand
      • Pricing Analysis
      • Market Share Analysis, 2024
        • By Material Type
        • By Function
        • By Application
        • By Physical Form
        • By End Use
    • Indonesia
      • Pricing Analysis
      • Market Share Analysis, 2024
        • By Material Type
        • By Function
        • By Application
        • By Physical Form
        • By End Use
    • Australia
      • Pricing Analysis
      • Market Share Analysis, 2024
        • By Material Type
        • By Function
        • By Application
        • By Physical Form
        • By End Use
    • New Zealand
      • Pricing Analysis
      • Market Share Analysis, 2024
        • By Material Type
        • By Function
        • By Application
        • By Physical Form
        • By End Use
    • Turkey
      • Pricing Analysis
      • Market Share Analysis, 2024
        • By Material Type
        • By Function
        • By Application
        • By Physical Form
        • By End Use
    • UAE
      • Pricing Analysis
      • Market Share Analysis, 2024
        • By Material Type
        • By Function
        • By Application
        • By Physical Form
        • By End Use
    • Saudi Arabia
      • Pricing Analysis
      • Market Share Analysis, 2024
        • By Material Type
        • By Function
        • By Application
        • By Physical Form
        • By End Use
    • Israel
      • Pricing Analysis
      • Market Share Analysis, 2024
        • By Material Type
        • By Function
        • By Application
        • By Physical Form
        • By End Use
    • North Africa
      • Pricing Analysis
      • Market Share Analysis, 2024
        • By Material Type
        • By Function
        • By Application
        • By Physical Form
        • By End Use
    • South Africa
      • Pricing Analysis
      • Market Share Analysis, 2024
        • By Material Type
        • By Function
        • By Application
        • By Physical Form
        • By End Use
  18. Market Structure Analysis
    • Competition Dashboard
    • Competition Benchmarking
    • Market Share Analysis of Top Players
      • By Regional
      • By Material Type
      • By Function
      • By Application
      • By Physical Form
      • By End Use
  19. Competition Analysis
    • Competition Deep Dive
      • BASF
        • Overview
        • Product Portfolio
        • Profitability by Market Segments (Product/Age /Sales Channel/Region)
        • Sales Footprint
        • Strategy Overview
          • Marketing Strategy
          • Product Strategy
          • Channel Strategy
      • Clariant
        • Overview
        • Product Portfolio
        • Profitability by Market Segments (Product/Age /Sales Channel/Region)
        • Sales Footprint
        • Strategy Overview
          • Marketing Strategy
          • Product Strategy
          • Channel Strategy
      • Evonik
        • Overview
        • Product Portfolio
        • Profitability by Market Segments (Product/Age /Sales Channel/Region)
        • Sales Footprint
        • Strategy Overview
          • Marketing Strategy
          • Product Strategy
          • Channel Strategy
      • Merck KGaA
        • Overview
        • Product Portfolio
        • Profitability by Market Segments (Product/Age /Sales Channel/Region)
        • Sales Footprint
        • Strategy Overview
          • Marketing Strategy
          • Product Strategy
          • Channel Strategy
      • Croda
        • Overview
        • Product Portfolio
        • Profitability by Market Segments (Product/Age /Sales Channel/Region)
        • Sales Footprint
        • Strategy Overview
          • Marketing Strategy
          • Product Strategy
          • Channel Strategy
      • Sensient
        • Overview
        • Product Portfolio
        • Profitability by Market Segments (Product/Age /Sales Channel/Region)
        • Sales Footprint
        • Strategy Overview
          • Marketing Strategy
          • Product Strategy
          • Channel Strategy
      • Givaudan
        • Overview
        • Product Portfolio
        • Profitability by Market Segments (Product/Age /Sales Channel/Region)
        • Sales Footprint
        • Strategy Overview
          • Marketing Strategy
          • Product Strategy
          • Channel Strategy
      • Ashland
        • Overview
        • Product Portfolio
        • Profitability by Market Segments (Product/Age /Sales Channel/Region)
        • Sales Footprint
        • Strategy Overview
          • Marketing Strategy
          • Product Strategy
          • Channel Strategy
      • Kobo Products
        • Overview
        • Product Portfolio
        • Profitability by Market Segments (Product/Age /Sales Channel/Region)
        • Sales Footprint
        • Strategy Overview
          • Marketing Strategy
          • Product Strategy
          • Channel Strategy
      • Seppic
        • Overview
        • Product Portfolio
        • Profitability by Market Segments (Product/Age /Sales Channel/Region)
        • Sales Footprint
        • Strategy Overview
          • Marketing Strategy
          • Product Strategy
          • Channel Strategy
      • Others
        • Overview
        • Product Portfolio
        • Profitability by Market Segments (Product/Age /Sales Channel/Region)
        • Sales Footprint
        • Strategy Overview
          • Marketing Strategy
          • Product Strategy
          • Channel Strategy
  20. Assumptions & Acronyms Used
  21. Research Methodology

List of Tables

  • Table 1: Global Market Value (USD Million) Forecast by Region, 2020-2035
  • Table 2: Global Market Volume (Units) Forecast by Region, 2020-2035
  • Table 3: Global Market Value (USD Million) Forecast by Material Type, 2020-2035
  • Table 4: Global Market Volume (Units) Forecast by Material Type, 2020-2035
  • Table 5: Global Market Value (USD Million) Forecast by Function, 2020-2035
  • Table 6: Global Market Volume (Units) Forecast by Function, 2020-2035
  • Table 7: Global Market Value (USD Million) Forecast by Application, 2020-2035
  • Table 8: Global Market Volume (Units) Forecast by Application, 2020-2035
  • Table 9: Global Market Value (USD Million) Forecast by Physical Form, 2020-2035
  • Table 10: Global Market Volume (Units) Forecast by Physical Form, 2020-2035
  • Table 11: Global Market Value (USD Million) Forecast by End Use, 2020-2035
  • Table 12: Global Market Volume (Units) Forecast by End Use, 2020-2035
  • Table 13: North America Market Value (USD Million) Forecast by Country, 2020-2035
  • Table 14: North America Market Volume (Units) Forecast by Country, 2020-2035
  • Table 15: North America Market Value (USD Million) Forecast by Material Type, 2020-2035
  • Table 16: North America Market Volume (Units) Forecast by Material Type, 2020-2035
  • Table 17: North America Market Value (USD Million) Forecast by Function, 2020-2035
  • Table 18: North America Market Volume (Units) Forecast by Function, 2020-2035
  • Table 19: North America Market Value (USD Million) Forecast by Application, 2020-2035
  • Table 20: North America Market Volume (Units) Forecast by Application, 2020-2035
  • Table 21: North America Market Value (USD Million) Forecast by Physical Form, 2020-2035
  • Table 22: North America Market Volume (Units) Forecast by Physical Form, 2020-2035
  • Table 23: North America Market Value (USD Million) Forecast by End Use, 2020-2035
  • Table 24: North America Market Volume (Units) Forecast by End Use, 2020-2035
  • Table 25: Latin America Market Value (USD Million) Forecast by Country, 2020-2035
  • Table 26: Latin America Market Volume (Units) Forecast by Country, 2020-2035
  • Table 27: Latin America Market Value (USD Million) Forecast by Material Type, 2020-2035
  • Table 28: Latin America Market Volume (Units) Forecast by Material Type, 2020-2035
  • Table 29: Latin America Market Value (USD Million) Forecast by Function, 2020-2035
  • Table 30: Latin America Market Volume (Units) Forecast by Function, 2020-2035
  • Table 31: Latin America Market Value (USD Million) Forecast by Application, 2020-2035
  • Table 32: Latin America Market Volume (Units) Forecast by Application, 2020-2035
  • Table 33: Latin America Market Value (USD Million) Forecast by Physical Form, 2020-2035
  • Table 34: Latin America Market Volume (Units) Forecast by Physical Form, 2020-2035
  • Table 35: Latin America Market Value (USD Million) Forecast by End Use, 2020-2035
  • Table 36: Latin America Market Volume (Units) Forecast by End Use, 2020-2035
  • Table 37: Europe Market Value (USD Million) Forecast by Country, 2020-2035
  • Table 38: Europe Market Volume (Units) Forecast by Country, 2020-2035
  • Table 39: Europe Market Value (USD Million) Forecast by Material Type, 2020-2035
  • Table 40: Europe Market Volume (Units) Forecast by Material Type, 2020-2035
  • Table 41: Europe Market Value (USD Million) Forecast by Function, 2020-2035
  • Table 42: Europe Market Volume (Units) Forecast by Function, 2020-2035
  • Table 43: Europe Market Value (USD Million) Forecast by Application, 2020-2035
  • Table 44: Europe Market Volume (Units) Forecast by Application, 2020-2035
  • Table 45: Europe Market Value (USD Million) Forecast by Physical Form, 2020-2035
  • Table 46: Europe Market Volume (Units) Forecast by Physical Form, 2020-2035
  • Table 47: Europe Market Value (USD Million) Forecast by End Use, 2020-2035
  • Table 48: Europe Market Volume (Units) Forecast by End Use, 2020-2035
  • Table 49: East Asia Market Value (USD Million) Forecast by Country, 2020-2035
  • Table 50: East Asia Market Volume (Units) Forecast by Country, 2020-2035
  • Table 51: East Asia Market Value (USD Million) Forecast by Material Type, 2020-2035
  • Table 52: East Asia Market Volume (Units) Forecast by Material Type, 2020-2035
  • Table 53: East Asia Market Value (USD Million) Forecast by Function, 2020-2035
  • Table 54: East Asia Market Volume (Units) Forecast by Function, 2020-2035
  • Table 55: East Asia Market Value (USD Million) Forecast by Application, 2020-2035
  • Table 56: East Asia Market Volume (Units) Forecast by Application, 2020-2035
  • Table 57: East Asia Market Value (USD Million) Forecast by Physical Form, 2020-2035
  • Table 58: East Asia Market Volume (Units) Forecast by Physical Form, 2020-2035
  • Table 59: East Asia Market Value (USD Million) Forecast by End Use, 2020-2035
  • Table 60: East Asia Market Volume (Units) Forecast by End Use, 2020-2035
  • Table 61: South Asia & Pacific Market Value (USD Million) Forecast by Country, 2020-2035
  • Table 62: South Asia & Pacific Market Volume (Units) Forecast by Country, 2020-2035
  • Table 63: South Asia & Pacific Market Value (USD Million) Forecast by Material Type, 2020-2035
  • Table 64: South Asia & Pacific Market Volume (Units) Forecast by Material Type, 2020-2035
  • Table 65: South Asia & Pacific Market Value (USD Million) Forecast by Function, 2020-2035
  • Table 66: South Asia & Pacific Market Volume (Units) Forecast by Function, 2020-2035
  • Table 67: South Asia & Pacific Market Value (USD Million) Forecast by Application, 2020-2035
  • Table 68: South Asia & Pacific Market Volume (Units) Forecast by Application, 2020-2035
  • Table 69: South Asia & Pacific Market Value (USD Million) Forecast by Physical Form, 2020-2035
  • Table 70: South Asia & Pacific Market Volume (Units) Forecast by Physical Form, 2020-2035
  • Table 71: South Asia & Pacific Market Value (USD Million) Forecast by End Use, 2020-2035
  • Table 72: South Asia & Pacific Market Volume (Units) Forecast by End Use, 2020-2035
  • Table 73: Middle East and Africa Market Value (USD Million) Forecast by Country, 2020-2035
  • Table 74: Middle East and Africa Market Volume (Units) Forecast by Country, 2020-2035
  • Table 75: Middle East and Africa Market Value (USD Million) Forecast by Material Type, 2020-2035
  • Table 76: Middle East and Africa Market Volume (Units) Forecast by Material Type, 2020-2035
  • Table 77: Middle East and Africa Market Value (USD Million) Forecast by Function, 2020-2035
  • Table 78: Middle East and Africa Market Volume (Units) Forecast by Function, 2020-2035
  • Table 79: Middle East and Africa Market Value (USD Million) Forecast by Application, 2020-2035
  • Table 80: Middle East and Africa Market Volume (Units) Forecast by Application, 2020-2035
  • Table 81: Middle East and Africa Market Value (USD Million) Forecast by Physical Form, 2020-2035
  • Table 82: Middle East and Africa Market Volume (Units) Forecast by Physical Form, 2020-2035
  • Table 83: Middle East and Africa Market Value (USD Million) Forecast by End Use, 2020-2035
  • Table 84: Middle East and Africa Market Volume (Units) Forecast by End Use, 2020-2035

List of Figures

  • Figure 1: Global Market Value (USD Million) by Material Type, 2025-2035
  • Figure 2: Global Market Value (USD Million) by Function, 2025-2035
  • Figure 3: Global Market Value (USD Million) by Application, 2025-2035
  • Figure 4: Global Market Value (USD Million) by Physical Form, 2025-2035
  • Figure 5: Global Market Value (USD Million) by End Use, 2025-2035
  • Figure 6: Global Market Value (USD Million) by Region, 2025-2035
  • Figure 7: Global Market Value (USD Million) Analysis by Region, 2020-2035
  • Figure 8: Global Market Volume (Units) Analysis by Region, 2020-2035
  • Figure 9: Global Market Value Share (%) and BPS Analysis by Region, 2025-2035
  • Figure 10: Global Market Y-o-Y Growth (%) Projections by Region, 2025-2035
  • Figure 11: Global Market Value (USD Million) Analysis by Material Type, 2020-2035
  • Figure 12: Global Market Volume (Units) Analysis by Material Type, 2020-2035
  • Figure 13: Global Market Value Share (%) and BPS Analysis by Material Type, 2025-2035
  • Figure 14: Global Market Y-o-Y Growth (%) Projections by Material Type, 2025-2035
  • Figure 15: Global Market Value (USD Million) Analysis by Function, 2020-2035
  • Figure 16: Global Market Volume (Units) Analysis by Function, 2020-2035
  • Figure 17: Global Market Value Share (%) and BPS Analysis by Function, 2025-2035
  • Figure 18: Global Market Y-o-Y Growth (%) Projections by Function, 2025-2035
  • Figure 19: Global Market Value (USD Million) Analysis by Application, 2020-2035
  • Figure 20: Global Market Volume (Units) Analysis by Application, 2020-2035
  • Figure 21: Global Market Value Share (%) and BPS Analysis by Application, 2025-2035
  • Figure 22: Global Market Y-o-Y Growth (%) Projections by Application, 2025-2035
  • Figure 23: Global Market Value (USD Million) Analysis by Physical Form, 2020-2035
  • Figure 24: Global Market Volume (Units) Analysis by Physical Form, 2020-2035
  • Figure 25: Global Market Value Share (%) and BPS Analysis by Physical Form, 2025-2035
  • Figure 26: Global Market Y-o-Y Growth (%) Projections by Physical Form, 2025-2035
  • Figure 27: Global Market Value (USD Million) Analysis by End Use, 2020-2035
  • Figure 28: Global Market Volume (Units) Analysis by End Use, 2020-2035
  • Figure 29: Global Market Value Share (%) and BPS Analysis by End Use, 2025-2035
  • Figure 30: Global Market Y-o-Y Growth (%) Projections by End Use, 2025-2035
  • Figure 31: Global Market Attractiveness by Material Type, 2025-2035
  • Figure 32: Global Market Attractiveness by Function, 2025-2035
  • Figure 33: Global Market Attractiveness by Application, 2025-2035
  • Figure 34: Global Market Attractiveness by Physical Form, 2025-2035
  • Figure 35: Global Market Attractiveness by End Use, 2025-2035
  • Figure 36: Global Market Attractiveness by Region, 2025-2035
  • Figure 37: North America Market Value (USD Million) by Material Type, 2025-2035
  • Figure 38: North America Market Value (USD Million) by Function, 2025-2035
  • Figure 39: North America Market Value (USD Million) by Application, 2025-2035
  • Figure 40: North America Market Value (USD Million) by Physical Form, 2025-2035
  • Figure 41: North America Market Value (USD Million) by End Use, 2025-2035
  • Figure 42: North America Market Value (USD Million) by Country, 2025-2035
  • Figure 43: North America Market Value (USD Million) Analysis by Country, 2020-2035
  • Figure 44: North America Market Volume (Units) Analysis by Country, 2020-2035
  • Figure 45: North America Market Value Share (%) and BPS Analysis by Country, 2025-2035
  • Figure 46: North America Market Y-o-Y Growth (%) Projections by Country, 2025-2035
  • Figure 47: North America Market Value (USD Million) Analysis by Material Type, 2020-2035
  • Figure 48: North America Market Volume (Units) Analysis by Material Type, 2020-2035
  • Figure 49: North America Market Value Share (%) and BPS Analysis by Material Type, 2025-2035
  • Figure 50: North America Market Y-o-Y Growth (%) Projections by Material Type, 2025-2035
  • Figure 51: North America Market Value (USD Million) Analysis by Function, 2020-2035
  • Figure 52: North America Market Volume (Units) Analysis by Function, 2020-2035
  • Figure 53: North America Market Value Share (%) and BPS Analysis by Function, 2025-2035
  • Figure 54: North America Market Y-o-Y Growth (%) Projections by Function, 2025-2035
  • Figure 55: North America Market Value (USD Million) Analysis by Application, 2020-2035
  • Figure 56: North America Market Volume (Units) Analysis by Application, 2020-2035
  • Figure 57: North America Market Value Share (%) and BPS Analysis by Application, 2025-2035
  • Figure 58: North America Market Y-o-Y Growth (%) Projections by Application, 2025-2035
  • Figure 59: North America Market Value (USD Million) Analysis by Physical Form, 2020-2035
  • Figure 60: North America Market Volume (Units) Analysis by Physical Form, 2020-2035
  • Figure 61: North America Market Value Share (%) and BPS Analysis by Physical Form, 2025-2035
  • Figure 62: North America Market Y-o-Y Growth (%) Projections by Physical Form, 2025-2035
  • Figure 63: North America Market Value (USD Million) Analysis by End Use, 2020-2035
  • Figure 64: North America Market Volume (Units) Analysis by End Use, 2020-2035
  • Figure 65: North America Market Value Share (%) and BPS Analysis by End Use, 2025-2035
  • Figure 66: North America Market Y-o-Y Growth (%) Projections by End Use, 2025-2035
  • Figure 67: North America Market Attractiveness by Material Type, 2025-2035
  • Figure 68: North America Market Attractiveness by Function, 2025-2035
  • Figure 69: North America Market Attractiveness by Application, 2025-2035
  • Figure 70: North America Market Attractiveness by Physical Form, 2025-2035
  • Figure 71: North America Market Attractiveness by End Use, 2025-2035
  • Figure 72: North America Market Attractiveness by Country, 2025-2035
  • Figure 73: Latin America Market Value (USD Million) by Material Type, 2025-2035
  • Figure 74: Latin America Market Value (USD Million) by Function, 2025-2035
  • Figure 75: Latin America Market Value (USD Million) by Application, 2025-2035
  • Figure 76: Latin America Market Value (USD Million) by Physical Form, 2025-2035
  • Figure 77: Latin America Market Value (USD Million) by End Use, 2025-2035
  • Figure 78: Latin America Market Value (USD Million) by Country, 2025-2035
  • Figure 79: Latin America Market Value (USD Million) Analysis by Country, 2020-2035
  • Figure 80: Latin America Market Volume (Units) Analysis by Country, 2020-2035
  • Figure 81: Latin America Market Value Share (%) and BPS Analysis by Country, 2025-2035
  • Figure 82: Latin America Market Y-o-Y Growth (%) Projections by Country, 2025-2035
  • Figure 83: Latin America Market Value (USD Million) Analysis by Material Type, 2020-2035
  • Figure 84: Latin America Market Volume (Units) Analysis by Material Type, 2020-2035
  • Figure 85: Latin America Market Value Share (%) and BPS Analysis by Material Type, 2025-2035
  • Figure 86: Latin America Market Y-o-Y Growth (%) Projections by Material Type, 2025-2035
  • Figure 87: Latin America Market Value (USD Million) Analysis by Function, 2020-2035
  • Figure 88: Latin America Market Volume (Units) Analysis by Function, 2020-2035
  • Figure 89: Latin America Market Value Share (%) and BPS Analysis by Function, 2025-2035
  • Figure 90: Latin America Market Y-o-Y Growth (%) Projections by Function, 2025-2035
  • Figure 91: Latin America Market Value (USD Million) Analysis by Application, 2020-2035
  • Figure 92: Latin America Market Volume (Units) Analysis by Application, 2020-2035
  • Figure 93: Latin America Market Value Share (%) and BPS Analysis by Application, 2025-2035
  • Figure 94: Latin America Market Y-o-Y Growth (%) Projections by Application, 2025-2035
  • Figure 95: Latin America Market Value (USD Million) Analysis by Physical Form, 2020-2035
  • Figure 96: Latin America Market Volume (Units) Analysis by Physical Form, 2020-2035
  • Figure 97: Latin America Market Value Share (%) and BPS Analysis by Physical Form, 2025-2035
  • Figure 98: Latin America Market Y-o-Y Growth (%) Projections by Physical Form, 2025-2035
  • Figure 99: Latin America Market Value (USD Million) Analysis by End Use, 2020-2035
  • Figure 100: Latin America Market Volume (Units) Analysis by End Use, 2020-2035
  • Figure 101: Latin America Market Value Share (%) and BPS Analysis by End Use, 2025-2035
  • Figure 102: Latin America Market Y-o-Y Growth (%) Projections by End Use, 2025-2035
  • Figure 103: Latin America Market Attractiveness by Material Type, 2025-2035
  • Figure 104: Latin America Market Attractiveness by Function, 2025-2035
  • Figure 105: Latin America Market Attractiveness by Application, 2025-2035
  • Figure 106: Latin America Market Attractiveness by Physical Form, 2025-2035
  • Figure 107: Latin America Market Attractiveness by End Use, 2025-2035
  • Figure 108: Latin America Market Attractiveness by Country, 2025-2035
  • Figure 109: Europe Market Value (USD Million) by Material Type, 2025-2035
  • Figure 110: Europe Market Value (USD Million) by Function, 2025-2035
  • Figure 111: Europe Market Value (USD Million) by Application, 2025-2035
  • Figure 112: Europe Market Value (USD Million) by Physical Form, 2025-2035
  • Figure 113: Europe Market Value (USD Million) by End Use, 2025-2035
  • Figure 114: Europe Market Value (USD Million) by Country, 2025-2035
  • Figure 115: Europe Market Value (USD Million) Analysis by Country, 2020-2035
  • Figure 116: Europe Market Volume (Units) Analysis by Country, 2020-2035
  • Figure 117: Europe Market Value Share (%) and BPS Analysis by Country, 2025-2035
  • Figure 118: Europe Market Y-o-Y Growth (%) Projections by Country, 2025-2035
  • Figure 119: Europe Market Value (USD Million) Analysis by Material Type, 2020-2035
  • Figure 120: Europe Market Volume (Units) Analysis by Material Type, 2020-2035
  • Figure 121: Europe Market Value Share (%) and BPS Analysis by Material Type, 2025-2035
  • Figure 122: Europe Market Y-o-Y Growth (%) Projections by Material Type, 2025-2035
  • Figure 123: Europe Market Value (USD Million) Analysis by Function, 2020-2035
  • Figure 124: Europe Market Volume (Units) Analysis by Function, 2020-2035
  • Figure 125: Europe Market Value Share (%) and BPS Analysis by Function, 2025-2035
  • Figure 126: Europe Market Y-o-Y Growth (%) Projections by Function, 2025-2035
  • Figure 127: Europe Market Value (USD Million) Analysis by Application, 2020-2035
  • Figure 128: Europe Market Volume (Units) Analysis by Application, 2020-2035
  • Figure 129: Europe Market Value Share (%) and BPS Analysis by Application, 2025-2035
  • Figure 130: Europe Market Y-o-Y Growth (%) Projections by Application, 2025-2035
  • Figure 131: Europe Market Value (USD Million) Analysis by Physical Form, 2020-2035
  • Figure 132: Europe Market Volume (Units) Analysis by Physical Form, 2020-2035
  • Figure 133: Europe Market Value Share (%) and BPS Analysis by Physical Form, 2025-2035
  • Figure 134: Europe Market Y-o-Y Growth (%) Projections by Physical Form, 2025-2035
  • Figure 135: Europe Market Value (USD Million) Analysis by End Use, 2020-2035
  • Figure 136: Europe Market Volume (Units) Analysis by End Use, 2020-2035
  • Figure 137: Europe Market Value Share (%) and BPS Analysis by End Use, 2025-2035
  • Figure 138: Europe Market Y-o-Y Growth (%) Projections by End Use, 2025-2035
  • Figure 139: Europe Market Attractiveness by Material Type, 2025-2035
  • Figure 140: Europe Market Attractiveness by Function, 2025-2035
  • Figure 141: Europe Market Attractiveness by Application, 2025-2035
  • Figure 142: Europe Market Attractiveness by Physical Form, 2025-2035
  • Figure 143: Europe Market Attractiveness by End Use, 2025-2035
  • Figure 144: Europe Market Attractiveness by Country, 2025-2035
  • Figure 145: East Asia Market Value (USD Million) by Material Type, 2025-2035
  • Figure 146: East Asia Market Value (USD Million) by Function, 2025-2035
  • Figure 147: East Asia Market Value (USD Million) by Application, 2025-2035
  • Figure 148: East Asia Market Value (USD Million) by Physical Form, 2025-2035
  • Figure 149: East Asia Market Value (USD Million) by End Use, 2025-2035
  • Figure 150: East Asia Market Value (USD Million) by Country, 2025-2035
  • Figure 151: East Asia Market Value (USD Million) Analysis by Country, 2020-2035
  • Figure 152: East Asia Market Volume (Units) Analysis by Country, 2020-2035
  • Figure 153: East Asia Market Value Share (%) and BPS Analysis by Country, 2025-2035
  • Figure 154: East Asia Market Y-o-Y Growth (%) Projections by Country, 2025-2035
  • Figure 155: East Asia Market Value (USD Million) Analysis by Material Type, 2020-2035
  • Figure 156: East Asia Market Volume (Units) Analysis by Material Type, 2020-2035
  • Figure 157: East Asia Market Value Share (%) and BPS Analysis by Material Type, 2025-2035
  • Figure 158: East Asia Market Y-o-Y Growth (%) Projections by Material Type, 2025-2035
  • Figure 159: East Asia Market Value (USD Million) Analysis by Function, 2020-2035
  • Figure 160: East Asia Market Volume (Units) Analysis by Function, 2020-2035
  • Figure 161: East Asia Market Value Share (%) and BPS Analysis by Function, 2025-2035
  • Figure 162: East Asia Market Y-o-Y Growth (%) Projections by Function, 2025-2035
  • Figure 163: East Asia Market Value (USD Million) Analysis by Application, 2020-2035
  • Figure 164: East Asia Market Volume (Units) Analysis by Application, 2020-2035
  • Figure 165: East Asia Market Value Share (%) and BPS Analysis by Application, 2025-2035
  • Figure 166: East Asia Market Y-o-Y Growth (%) Projections by Application, 2025-2035
  • Figure 167: East Asia Market Value (USD Million) Analysis by Physical Form, 2020-2035
  • Figure 168: East Asia Market Volume (Units) Analysis by Physical Form, 2020-2035
  • Figure 169: East Asia Market Value Share (%) and BPS Analysis by Physical Form, 2025-2035
  • Figure 170: East Asia Market Y-o-Y Growth (%) Projections by Physical Form, 2025-2035
  • Figure 171: East Asia Market Value (USD Million) Analysis by End Use, 2020-2035
  • Figure 172: East Asia Market Volume (Units) Analysis by End Use, 2020-2035
  • Figure 173: East Asia Market Value Share (%) and BPS Analysis by End Use, 2025-2035
  • Figure 174: East Asia Market Y-o-Y Growth (%) Projections by End Use, 2025-2035
  • Figure 175: East Asia Market Attractiveness by Material Type, 2025-2035
  • Figure 176: East Asia Market Attractiveness by Function, 2025-2035
  • Figure 177: East Asia Market Attractiveness by Application, 2025-2035
  • Figure 178: East Asia Market Attractiveness by Physical Form, 2025-2035
  • Figure 179: East Asia Market Attractiveness by End Use, 2025-2035
  • Figure 180: East Asia Market Attractiveness by Country, 2025-2035
  • Figure 181: South Asia & Pacific Market Value (USD Million) by Material Type, 2025-2035
  • Figure 182: South Asia & Pacific Market Value (USD Million) by Function, 2025-2035
  • Figure 183: South Asia & Pacific Market Value (USD Million) by Application, 2025-2035
  • Figure 184: South Asia & Pacific Market Value (USD Million) by Physical Form, 2025-2035
  • Figure 185: South Asia & Pacific Market Value (USD Million) by End Use, 2025-2035
  • Figure 186: South Asia & Pacific Market Value (USD Million) by Country, 2025-2035
  • Figure 187: South Asia & Pacific Market Value (USD Million) Analysis by Country, 2020-2035
  • Figure 188: South Asia & Pacific Market Volume (Units) Analysis by Country, 2020-2035
  • Figure 189: South Asia & Pacific Market Value Share (%) and BPS Analysis by Country, 2025-2035
  • Figure 190: South Asia & Pacific Market Y-o-Y Growth (%) Projections by Country, 2025-2035
  • Figure 191: South Asia & Pacific Market Value (USD Million) Analysis by Material Type, 2020-2035
  • Figure 192: South Asia & Pacific Market Volume (Units) Analysis by Material Type, 2020-2035
  • Figure 193: South Asia & Pacific Market Value Share (%) and BPS Analysis by Material Type, 2025-2035
  • Figure 194: South Asia & Pacific Market Y-o-Y Growth (%) Projections by Material Type, 2025-2035
  • Figure 195: South Asia & Pacific Market Value (USD Million) Analysis by Function, 2020-2035
  • Figure 196: South Asia & Pacific Market Volume (Units) Analysis by Function, 2020-2035
  • Figure 197: South Asia & Pacific Market Value Share (%) and BPS Analysis by Function, 2025-2035
  • Figure 198: South Asia & Pacific Market Y-o-Y Growth (%) Projections by Function, 2025-2035
  • Figure 199: South Asia & Pacific Market Value (USD Million) Analysis by Application, 2020-2035
  • Figure 200: South Asia & Pacific Market Volume (Units) Analysis by Application, 2020-2035
  • Figure 201: South Asia & Pacific Market Value Share (%) and BPS Analysis by Application, 2025-2035
  • Figure 202: South Asia & Pacific Market Y-o-Y Growth (%) Projections by Application, 2025-2035
  • Figure 203: South Asia & Pacific Market Value (USD Million) Analysis by Physical Form, 2020-2035
  • Figure 204: South Asia & Pacific Market Volume (Units) Analysis by Physical Form, 2020-2035
  • Figure 205: South Asia & Pacific Market Value Share (%) and BPS Analysis by Physical Form, 2025-2035
  • Figure 206: South Asia & Pacific Market Y-o-Y Growth (%) Projections by Physical Form, 2025-2035
  • Figure 207: South Asia & Pacific Market Value (USD Million) Analysis by End Use, 2020-2035
  • Figure 208: South Asia & Pacific Market Volume (Units) Analysis by End Use, 2020-2035
  • Figure 209: South Asia & Pacific Market Value Share (%) and BPS Analysis by End Use, 2025-2035
  • Figure 210: South Asia & Pacific Market Y-o-Y Growth (%) Projections by End Use, 2025-2035
  • Figure 211: South Asia & Pacific Market Attractiveness by Material Type, 2025-2035
  • Figure 212: South Asia & Pacific Market Attractiveness by Function, 2025-2035
  • Figure 213: South Asia & Pacific Market Attractiveness by Application, 2025-2035
  • Figure 214: South Asia & Pacific Market Attractiveness by Physical Form, 2025-2035
  • Figure 215: South Asia & Pacific Market Attractiveness by End Use, 2025-2035
  • Figure 216: South Asia & Pacific Market Attractiveness by Country, 2025-2035
  • Figure 217: Middle East and Africa Market Value (USD Million) by Material Type, 2025-2035
  • Figure 218: Middle East and Africa Market Value (USD Million) by Function, 2025-2035
  • Figure 219: Middle East and Africa Market Value (USD Million) by Application, 2025-2035
  • Figure 220: Middle East and Africa Market Value (USD Million) by Physical Form, 2025-2035
  • Figure 221: Middle East and Africa Market Value (USD Million) by End Use, 2025-2035
  • Figure 222: Middle East and Africa Market Value (USD Million) by Country, 2025-2035
  • Figure 223: Middle East and Africa Market Value (USD Million) Analysis by Country, 2020-2035
  • Figure 224: Middle East and Africa Market Volume (Units) Analysis by Country, 2020-2035
  • Figure 225: Middle East and Africa Market Value Share (%) and BPS Analysis by Country, 2025-2035
  • Figure 226: Middle East and Africa Market Y-o-Y Growth (%) Projections by Country, 2025-2035
  • Figure 227: Middle East and Africa Market Value (USD Million) Analysis by Material Type, 2020-2035
  • Figure 228: Middle East and Africa Market Volume (Units) Analysis by Material Type, 2020-2035
  • Figure 229: Middle East and Africa Market Value Share (%) and BPS Analysis by Material Type, 2025-2035
  • Figure 230: Middle East and Africa Market Y-o-Y Growth (%) Projections by Material Type, 2025-2035
  • Figure 231: Middle East and Africa Market Value (USD Million) Analysis by Function, 2020-2035
  • Figure 232: Middle East and Africa Market Volume (Units) Analysis by Function, 2020-2035
  • Figure 233: Middle East and Africa Market Value Share (%) and BPS Analysis by Function, 2025-2035
  • Figure 234: Middle East and Africa Market Y-o-Y Growth (%) Projections by Function, 2025-2035
  • Figure 235: Middle East and Africa Market Value (USD Million) Analysis by Application, 2020-2035
  • Figure 236: Middle East and Africa Market Volume (Units) Analysis by Application, 2020-2035
  • Figure 237: Middle East and Africa Market Value Share (%) and BPS Analysis by Application, 2025-2035
  • Figure 238: Middle East and Africa Market Y-o-Y Growth (%) Projections by Application, 2025-2035
  • Figure 239: Middle East and Africa Market Value (USD Million) Analysis by Physical Form, 2020-2035
  • Figure 240: Middle East and Africa Market Volume (Units) Analysis by Physical Form, 2020-2035
  • Figure 241: Middle East and Africa Market Value Share (%) and BPS Analysis by Physical Form, 2025-2035
  • Figure 242: Middle East and Africa Market Y-o-Y Growth (%) Projections by Physical Form, 2025-2035
  • Figure 243: Middle East and Africa Market Value (USD Million) Analysis by End Use, 2020-2035
  • Figure 244: Middle East and Africa Market Volume (Units) Analysis by End Use, 2020-2035
  • Figure 245: Middle East and Africa Market Value Share (%) and BPS Analysis by End Use, 2025-2035
  • Figure 246: Middle East and Africa Market Y-o-Y Growth (%) Projections by End Use, 2025-2035
  • Figure 247: Middle East and Africa Market Attractiveness by Material Type, 2025-2035
  • Figure 248: Middle East and Africa Market Attractiveness by Function, 2025-2035
  • Figure 249: Middle East and Africa Market Attractiveness by Application, 2025-2035
  • Figure 250: Middle East and Africa Market Attractiveness by Physical Form, 2025-2035
  • Figure 251: Middle East and Africa Market Attractiveness by End Use, 2025-2035
  • Figure 252: Middle East and Africa Market Attractiveness by Country, 2025-2035

Frequently Asked Questions

How big is the Fillers & Extenders Market in 2025?

The global Fillers & Extenders Market is estimated to be valued at USD 2,401.40 Million in 2025.

What will be the size of the Fillers & Extenders Market in 2035?

The market size for the Fillers & Extenders Market is projected to reach USD 5,102.30 Million by 2035.

How much will be the Fillers & Extenders Market growth between 2025 and 2035?

The Fillers & Extenders Market is expected to grow at a CAGR of 7.80% between 2025 and 2035.

What are the key product types in the Fillers & Extenders Market?

The key product types in the Fillers & Extenders Market are silica and other fillers, reflecting diverse applications in cosmetics, personal care, and pharmaceutical topicals.

Which application segment is expected to contribute significant share in the Fillers & Extenders Market in 2025?

In terms of application, the face powders & foundations segment is expected to command 42.10% share in the Fillers & Extenders Market in 2025.

Explore Similar Insights

Future Market Insights

Fillers & Extenders Market

Chat With MaRIA

Chat With

MaRIA

Hi There, I am MaRIA, Your Market Research Intelligence Assistant. How may I help you?