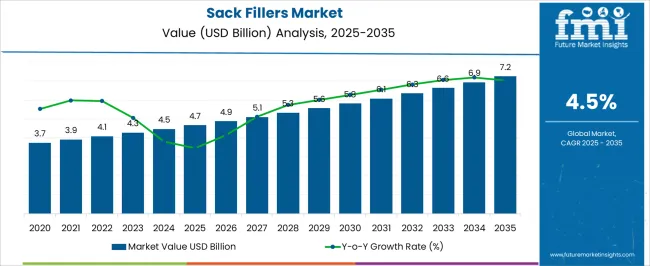
The global sack fillers market size is anticipated to gain astonishing growth from 2023 to 2033. According to the research report, the global market is predicted to exceed a valuation of USD 4,272.1 million in 2023. It is anticipated to hit a valuation of USD 6,634.4 million by 2033. The market is estimated to showcase a modest CAGR of 4.5% from 2023 to 2033.
Sack fillers are machines that are used to fill sacks or bags with various types of materials. These materials may be powders, grains, or other products. The multi-function capabilities of sack fillers are expected to boost their adoption and foster market development.
Growing consumption of packaged foods is expected to be a prominent growth driver for the market. Shifting inclination toward pre-packaged foods drives sack fillers demand. The ever-increasing global population is leading to the expansion of the food and beverage industry. Sack fillers streamline packaging processes in the food and beverage industry.
The snowballing food production proliferates demand for sack fillers. They are cost-effective and the rising automation across the food and beverage industry is likely to boost sack fillers sales. Intensifying industrialization is anticipated to bolster market growth substantially.
The increasing proliferation of technology in manufacturing activities is a prime factor driving the global sales of sack filler machines. Technological developments have made sack fillers more efficient and versatile.
For instance, modern sack fillers are now able to handle a variety of materials and packaging sizes. This reduces waste generation and improves accuracy across required processes. The rising technological developments by key market players to address dynamically evolving market trends and demand flourish market expansion.
The increasing global trade is enlarging the need for reliable and efficient sack fillers. The expansion of the e-commerce industry further propels this demand. The burgeoning packaging and transportation of products are likely to boost the demand for sack fillers.
Attributes | Details |
---|---|
Sack Fillers Market Share (2022) | USD 4,088.1 million |
Sack Fillers Market Share (2023) | USD 4,272.1 million |
Sack Fillers Market Share (2033) | USD 6,634.4 million |
Sack Fillers Market Share (2023 to 2033) | 4.5% |
The global sack fillers market expanded at a modest CAGR of 4.1% from 2012 to 2022. In 2018, the global market size stood at USD 3,467.8 million. In the following years from 2018 to 2022, the market witnessed significant growth, accounting for USD 4,088.1 million in 2022.
The increasing industrialization is a prime factor augmenting the demand for sack fillers. The growth of the global economy has boosted the demand for several kinds of goods. The surge in demand for goods results in swelling more packaging, thereby boosting sack fillers demand.
The growing popularity of online shopping is playing a vital role in boosting market growth. The swiftly rising digitalization and improving income levels are enabling people to shop online more. This trend is increasing the demand for shipping and packaging products. As a result, the demand for sack fillers to fill boxes and bags is rising.
The increasing construction activities and urbanization also substantially amplify the market growth. Sack fillers are used to fill construction materials, such as sand, gravel, cement, and others. The increasing infrastructural development across developed and developing nations bolster market expansion. Furthermore, the swelling mining and earthmoving activities promote market development.
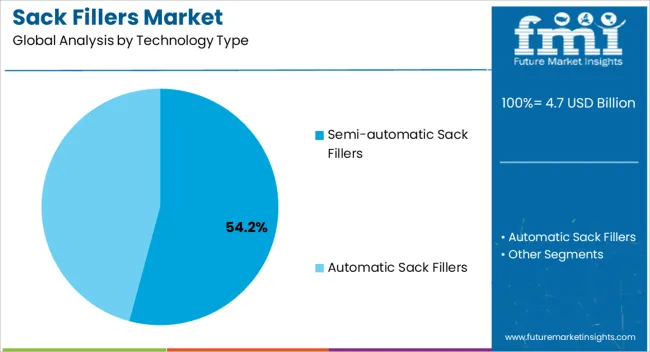
Automatic sack fillers are anticipated to be the dominating segment by technology type. The segment captured nearly 89.5% market share in 2022. High precision is required in the packaging of different kinds of products. From handling and filling industrial and chemical powders to agricultural products such as seeds, corn, wheat, and others, automated sack fillers play a vital role in improving operational efficiency.
Artificial Intelligence and automation are transforming operational methods across industries. Through the progressions in innovation, robotics, and sensors, automated sack fillers are witnessing significant evolution. New launches and technological development are expected to complement market expansion.
The food sack fillers segment by end-use accounted for a huge 38.5% market share in 2022. The increasing demand for pre-packaged foods is a key growth factor. The improving income levels, evolving lifestyles, and expanding middle-class population boost demand for packaged foods. The expansion of the food and beverage industry is anticipated to foster the segment’s expansion.
Agriculture sack fillers are expected to gain considerable growth during the forecast period. The swelling food demand due to the ever-increasing global population is impelling the agriculture industry to adopt modern production methods.
Agriculture sack fillers efficiently fill sacks or bags with grains, fertilizers, and seeds. They can fill sacks accurately and quickly, thereby reducing manual labor. This also helps to mitigate product damage risks during storage and transportation. The automated agriculture sack fillers market is likely to swell as agricultural producers sought cost-effective and efficient methods of production. The increase in smart farming techniques is likely to bolster fertilizer sack fillers demand.
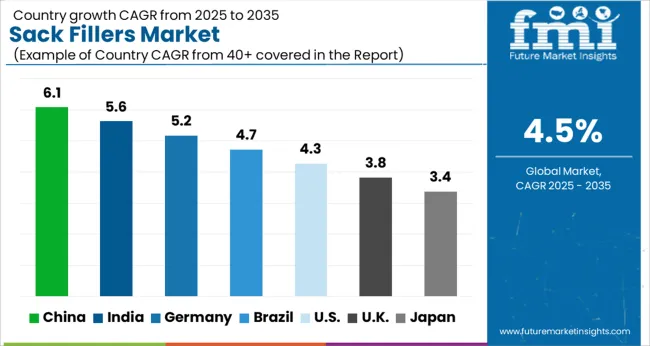
The North America sack fillers market is expected to rise at a steady pace due to the already established market in the region. North America captured a staggering 19.8% market share in 2022. However, technological advancements and innovative sack-filling machines are expected to see moderate demand over the forecast period.
Europe captured a whopping 23.4% market share in 2022. Europe’s well-established industries have already adopted technologically advanced sack fillers. Also, there is a relatively lower requirement for these devices in the region. The establishment of new factories in some countries of Europe is expected to drive sales of sack fillers in the region.
India captured nearly 5.3% market share in 2022. The country has witnessed a substantial increase in its manufacturing sector in recent years. The nation is one of the leading emerging economies in Asia. It provides lucrative opportunities for multiple products and services.
Government initiatives are supporting the growth of the manufacturing sector with subsidies and attractive investment opportunities. This trend has spawned a growth spurt in food, chemical, construction, and other industries. These industries are the main end-use industries for super sack bag fillers.
Super sack bag filler machinery and equipment sales are fueled by the growth and expansion of these sectors. Apart from rapid urbanization, increasing technological proliferation is also influencing the Indian sack fillers market. Sack filler suppliers can focus on this market and grow their global market share significantly.
Japan captured a modest 11.2% sack fillers market share in 2022. Japan is recognized as one of the most technologically advanced nations in the world. Its technological supremacy is evident in its industries and lifestyle, and this has always favored multiple markets. Technological advantage makes Japan a very lucrative market for sack fillers.
Demand for automatic sack fillers is high in Japan as the working population of the nation is very low. Additionally, Japan’s mass population comprises geriatric people who don’t work. Japan holds a prominent share of the global marketplace. It is expected to showcase a good growth outlook over the forecast years.
The market in East Asia, South Asia, and the Pacific is expected to exhibit robust growth in the shipments of sack fillers. Demand for super sack bag fillers is also expected to be high and driven by emerging economies in these regions. Demand for super sack fillers from India and China is expected to be significantly more prominent than any other nation in these regions.
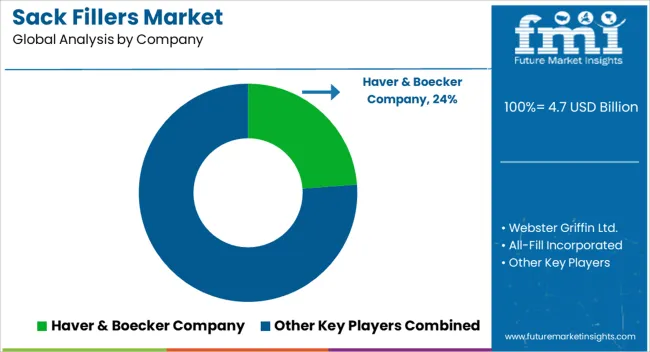
Sack filler companies are focusing on the research & development of new and innovative technologies that automate the process. They are focusing to work in the evolving technological industry. Sack filler manufacturers are also focusing on mergers and acquisitions to increase their overall global market presence in multiple geographies.
Recent Developments Observed by FMI:
Attribute | Details |
---|---|
Forecast Period | 2023 to 2033 |
Historical Data Available for | 2018 to 2022 |
Market Analysis | Unit for Sales, USD million for Value |
Key Regions Covered | North America; Latin America; Europe; East Asia; South Asia & Pacific; The Middle East & Africa (MEA) |
Key Countries Covered | United States, Canada, Brazil, Mexico, Germany, United Kingdom, France, Spain, Italy, Türkiye, South Africa, Northern Africa, GCC Countries, China, Japan, South Korea, India, Thailand, Malaysia, Indonesia, Australia, New Zealand |
Key Segments Covered | Technology Type, Machine Type, Capacity, End Use, Region |
Report Coverage | Market Forecast, Company Share Analysis, Competition Intelligence, Trend Analysis, Market Dynamics and Challenges, and Strategic Growth Initiatives |
Table 1: Global Market Value (US$ Million) Forecast by Region, 2018 to 2033
Table 2: Global Market Volume (Units) Forecast by Region, 2018 to 2033
Table 3: Global Market Value (US$ Million) Forecast by Technology, 2018 to 2033
Table 4: Global Market Volume (Units) Forecast by Technology, 2018 to 2033
Table 5: Global Market Value (US$ Million) Forecast by Machine Type, 2018 to 2033
Table 6: Global Market Volume (Units) Forecast by Machine Type, 2018 to 2033
Table 7: Global Market Value (US$ Million) Forecast by Capacity, 2018 to 2033
Table 8: Global Market Volume (Units) Forecast by Capacity, 2018 to 2033
Table 9: Global Market Value (US$ Million) Forecast by End Use Industry, 2018 to 2033
Table 10: Global Market Volume (Units) Forecast by End Use Industry, 2018 to 2033
Table 11: North America Market Value (US$ Million) Forecast by Country, 2018 to 2033
Table 12: North America Market Volume (Units) Forecast by Country, 2018 to 2033
Table 13: North America Market Value (US$ Million) Forecast by Technology, 2018 to 2033
Table 14: North America Market Volume (Units) Forecast by Technology, 2018 to 2033
Table 15: North America Market Value (US$ Million) Forecast by Machine Type, 2018 to 2033
Table 16: North America Market Volume (Units) Forecast by Machine Type, 2018 to 2033
Table 17: North America Market Value (US$ Million) Forecast by Capacity, 2018 to 2033
Table 18: North America Market Volume (Units) Forecast by Capacity, 2018 to 2033
Table 19: North America Market Value (US$ Million) Forecast by End Use Industry, 2018 to 2033
Table 20: North America Market Volume (Units) Forecast by End Use Industry, 2018 to 2033
Table 21: Latin America Market Value (US$ Million) Forecast by Country, 2018 to 2033
Table 22: Latin America Market Volume (Units) Forecast by Country, 2018 to 2033
Table 23: Latin America Market Value (US$ Million) Forecast by Technology, 2018 to 2033
Table 24: Latin America Market Volume (Units) Forecast by Technology, 2018 to 2033
Table 25: Latin America Market Value (US$ Million) Forecast by Machine Type, 2018 to 2033
Table 26: Latin America Market Volume (Units) Forecast by Machine Type, 2018 to 2033
Table 27: Latin America Market Value (US$ Million) Forecast by Capacity, 2018 to 2033
Table 28: Latin America Market Volume (Units) Forecast by Capacity, 2018 to 2033
Table 29: Latin America Market Value (US$ Million) Forecast by End Use Industry, 2018 to 2033
Table 30: Latin America Market Volume (Units) Forecast by End Use Industry, 2018 to 2033
Table 31: Europe Market Value (US$ Million) Forecast by Country, 2018 to 2033
Table 32: Europe Market Volume (Units) Forecast by Country, 2018 to 2033
Table 33: Europe Market Value (US$ Million) Forecast by Technology, 2018 to 2033
Table 34: Europe Market Volume (Units) Forecast by Technology, 2018 to 2033
Table 35: Europe Market Value (US$ Million) Forecast by Machine Type, 2018 to 2033
Table 36: Europe Market Volume (Units) Forecast by Machine Type, 2018 to 2033
Table 37: Europe Market Value (US$ Million) Forecast by Capacity, 2018 to 2033
Table 38: Europe Market Volume (Units) Forecast by Capacity, 2018 to 2033
Table 39: Europe Market Value (US$ Million) Forecast by End Use Industry, 2018 to 2033
Table 40: Europe Market Volume (Units) Forecast by End Use Industry, 2018 to 2033
Table 41: Asia Pacific Market Value (US$ Million) Forecast by Country, 2018 to 2033
Table 42: Asia Pacific Market Volume (Units) Forecast by Country, 2018 to 2033
Table 43: Asia Pacific Market Value (US$ Million) Forecast by Technology, 2018 to 2033
Table 44: Asia Pacific Market Volume (Units) Forecast by Technology, 2018 to 2033
Table 45: Asia Pacific Market Value (US$ Million) Forecast by Machine Type, 2018 to 2033
Table 46: Asia Pacific Market Volume (Units) Forecast by Machine Type, 2018 to 2033
Table 47: Asia Pacific Market Value (US$ Million) Forecast by Capacity, 2018 to 2033
Table 48: Asia Pacific Market Volume (Units) Forecast by Capacity, 2018 to 2033
Table 49: Asia Pacific Market Value (US$ Million) Forecast by End Use Industry, 2018 to 2033
Table 50: Asia Pacific Market Volume (Units) Forecast by End Use Industry, 2018 to 2033
Table 51: MEA Market Value (US$ Million) Forecast by Country, 2018 to 2033
Table 52: MEA Market Volume (Units) Forecast by Country, 2018 to 2033
Table 53: MEA Market Value (US$ Million) Forecast by Technology, 2018 to 2033
Table 54: MEA Market Volume (Units) Forecast by Technology, 2018 to 2033
Table 55: MEA Market Value (US$ Million) Forecast by Machine Type, 2018 to 2033
Table 56: MEA Market Volume (Units) Forecast by Machine Type, 2018 to 2033
Table 57: MEA Market Value (US$ Million) Forecast by Capacity, 2018 to 2033
Table 58: MEA Market Volume (Units) Forecast by Capacity, 2018 to 2033
Table 59: MEA Market Value (US$ Million) Forecast by End Use Industry, 2018 to 2033
Table 60: MEA Market Volume (Units) Forecast by End Use Industry, 2018 to 2033
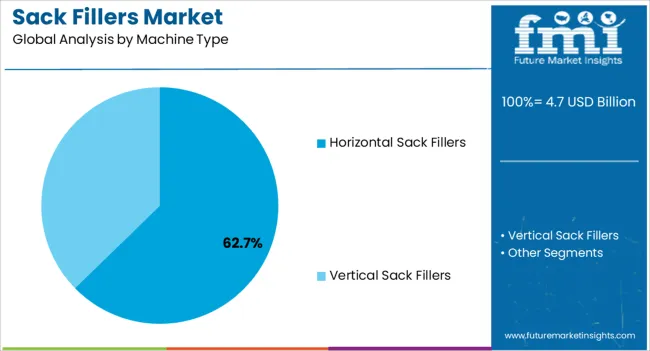
Figure 1: Global Market Value (US$ Million) by Technology, 2023 to 2033
Figure 2: Global Market Value (US$ Million) by Machine Type, 2023 to 2033
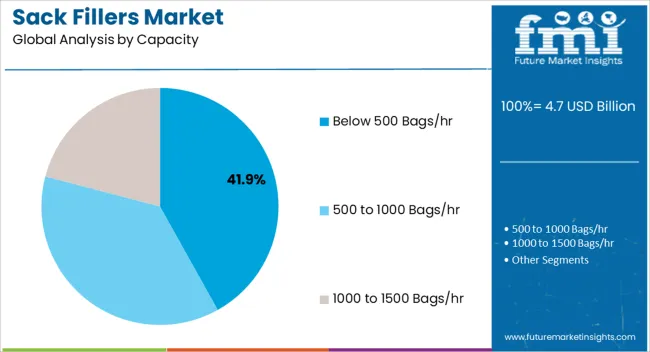
Figure 3: Global Market Value (US$ Million) by Capacity, 2023 to 2033
Figure 4: Global Market Value (US$ Million) by End Use Industry, 2023 to 2033
Figure 5: Global Market Value (US$ Million) by Region, 2023 to 2033
Figure 6: Global Market Value (US$ Million) Analysis by Region, 2018 to 2033
Figure 7: Global Market Volume (Units) Analysis by Region, 2018 to 2033
Figure 8: Global Market Value Share (%) and BPS Analysis by Region, 2023 to 2033
Figure 9: Global Market Y-o-Y Growth (%) Projections by Region, 2023 to 2033
Figure 10: Global Market Value (US$ Million) Analysis by Technology, 2018 to 2033
Figure 11: Global Market Volume (Units) Analysis by Technology, 2018 to 2033
Figure 12: Global Market Value Share (%) and BPS Analysis by Technology, 2023 to 2033
Figure 13: Global Market Y-o-Y Growth (%) Projections by Technology, 2023 to 2033
Figure 14: Global Market Value (US$ Million) Analysis by Machine Type, 2018 to 2033
Figure 15: Global Market Volume (Units) Analysis by Machine Type, 2018 to 2033
Figure 16: Global Market Value Share (%) and BPS Analysis by Machine Type, 2023 to 2033
Figure 17: Global Market Y-o-Y Growth (%) Projections by Machine Type, 2023 to 2033
Figure 18: Global Market Value (US$ Million) Analysis by Capacity, 2018 to 2033
Figure 19: Global Market Volume (Units) Analysis by Capacity, 2018 to 2033
Figure 20: Global Market Value Share (%) and BPS Analysis by Capacity, 2023 to 2033
Figure 21: Global Market Y-o-Y Growth (%) Projections by Capacity, 2023 to 2033
Figure 22: Global Market Value (US$ Million) Analysis by End Use Industry, 2018 to 2033
Figure 23: Global Market Volume (Units) Analysis by End Use Industry, 2018 to 2033
Figure 24: Global Market Value Share (%) and BPS Analysis by End Use Industry, 2023 to 2033
Figure 25: Global Market Y-o-Y Growth (%) Projections by End Use Industry, 2023 to 2033
Figure 26: Global Market Attractiveness by Technology, 2023 to 2033
Figure 27: Global Market Attractiveness by Machine Type, 2023 to 2033
Figure 28: Global Market Attractiveness by Capacity, 2023 to 2033
Figure 29: Global Market Attractiveness by End Use Industry, 2023 to 2033
Figure 30: Global Market Attractiveness by Region, 2023 to 2033
Figure 31: North America Market Value (US$ Million) by Technology, 2023 to 2033
Figure 32: North America Market Value (US$ Million) by Machine Type, 2023 to 2033
Figure 33: North America Market Value (US$ Million) by Capacity, 2023 to 2033
Figure 34: North America Market Value (US$ Million) by End Use Industry, 2023 to 2033
Figure 35: North America Market Value (US$ Million) by Country, 2023 to 2033
Figure 36: North America Market Value (US$ Million) Analysis by Country, 2018 to 2033
Figure 37: North America Market Volume (Units) Analysis by Country, 2018 to 2033
Figure 38: North America Market Value Share (%) and BPS Analysis by Country, 2023 to 2033
Figure 39: North America Market Y-o-Y Growth (%) Projections by Country, 2023 to 2033
Figure 40: North America Market Value (US$ Million) Analysis by Technology, 2018 to 2033
Figure 41: North America Market Volume (Units) Analysis by Technology, 2018 to 2033
Figure 42: North America Market Value Share (%) and BPS Analysis by Technology, 2023 to 2033
Figure 43: North America Market Y-o-Y Growth (%) Projections by Technology, 2023 to 2033
Figure 44: North America Market Value (US$ Million) Analysis by Machine Type, 2018 to 2033
Figure 45: North America Market Volume (Units) Analysis by Machine Type, 2018 to 2033
Figure 46: North America Market Value Share (%) and BPS Analysis by Machine Type, 2023 to 2033
Figure 47: North America Market Y-o-Y Growth (%) Projections by Machine Type, 2023 to 2033
Figure 48: North America Market Value (US$ Million) Analysis by Capacity, 2018 to 2033
Figure 49: North America Market Volume (Units) Analysis by Capacity, 2018 to 2033
Figure 50: North America Market Value Share (%) and BPS Analysis by Capacity, 2023 to 2033
Figure 51: North America Market Y-o-Y Growth (%) Projections by Capacity, 2023 to 2033
Figure 52: North America Market Value (US$ Million) Analysis by End Use Industry, 2018 to 2033
Figure 53: North America Market Volume (Units) Analysis by End Use Industry, 2018 to 2033
Figure 54: North America Market Value Share (%) and BPS Analysis by End Use Industry, 2023 to 2033
Figure 55: North America Market Y-o-Y Growth (%) Projections by End Use Industry, 2023 to 2033
Figure 56: North America Market Attractiveness by Technology, 2023 to 2033
Figure 57: North America Market Attractiveness by Machine Type, 2023 to 2033
Figure 58: North America Market Attractiveness by Capacity, 2023 to 2033
Figure 59: North America Market Attractiveness by End Use Industry, 2023 to 2033
Figure 60: North America Market Attractiveness by Country, 2023 to 2033
Figure 61: Latin America Market Value (US$ Million) by Technology, 2023 to 2033
Figure 62: Latin America Market Value (US$ Million) by Machine Type, 2023 to 2033
Figure 63: Latin America Market Value (US$ Million) by Capacity, 2023 to 2033
Figure 64: Latin America Market Value (US$ Million) by End Use Industry, 2023 to 2033
Figure 65: Latin America Market Value (US$ Million) by Country, 2023 to 2033
Figure 66: Latin America Market Value (US$ Million) Analysis by Country, 2018 to 2033
Figure 67: Latin America Market Volume (Units) Analysis by Country, 2018 to 2033
Figure 68: Latin America Market Value Share (%) and BPS Analysis by Country, 2023 to 2033
Figure 69: Latin America Market Y-o-Y Growth (%) Projections by Country, 2023 to 2033
Figure 70: Latin America Market Value (US$ Million) Analysis by Technology, 2018 to 2033
Figure 71: Latin America Market Volume (Units) Analysis by Technology, 2018 to 2033
Figure 72: Latin America Market Value Share (%) and BPS Analysis by Technology, 2023 to 2033
Figure 73: Latin America Market Y-o-Y Growth (%) Projections by Technology, 2023 to 2033
Figure 74: Latin America Market Value (US$ Million) Analysis by Machine Type, 2018 to 2033
Figure 75: Latin America Market Volume (Units) Analysis by Machine Type, 2018 to 2033
Figure 76: Latin America Market Value Share (%) and BPS Analysis by Machine Type, 2023 to 2033
Figure 77: Latin America Market Y-o-Y Growth (%) Projections by Machine Type, 2023 to 2033
Figure 78: Latin America Market Value (US$ Million) Analysis by Capacity, 2018 to 2033
Figure 79: Latin America Market Volume (Units) Analysis by Capacity, 2018 to 2033
Figure 80: Latin America Market Value Share (%) and BPS Analysis by Capacity, 2023 to 2033
Figure 81: Latin America Market Y-o-Y Growth (%) Projections by Capacity, 2023 to 2033
Figure 82: Latin America Market Value (US$ Million) Analysis by End Use Industry, 2018 to 2033
Figure 83: Latin America Market Volume (Units) Analysis by End Use Industry, 2018 to 2033
Figure 84: Latin America Market Value Share (%) and BPS Analysis by End Use Industry, 2023 to 2033
Figure 85: Latin America Market Y-o-Y Growth (%) Projections by End Use Industry, 2023 to 2033
Figure 86: Latin America Market Attractiveness by Technology, 2023 to 2033
Figure 87: Latin America Market Attractiveness by Machine Type, 2023 to 2033
Figure 88: Latin America Market Attractiveness by Capacity, 2023 to 2033
Figure 89: Latin America Market Attractiveness by End Use Industry, 2023 to 2033
Figure 90: Latin America Market Attractiveness by Country, 2023 to 2033
Figure 91: Europe Market Value (US$ Million) by Technology, 2023 to 2033
Figure 92: Europe Market Value (US$ Million) by Machine Type, 2023 to 2033
Figure 93: Europe Market Value (US$ Million) by Capacity, 2023 to 2033
Figure 94: Europe Market Value (US$ Million) by End Use Industry, 2023 to 2033
Figure 95: Europe Market Value (US$ Million) by Country, 2023 to 2033
Figure 96: Europe Market Value (US$ Million) Analysis by Country, 2018 to 2033
Figure 97: Europe Market Volume (Units) Analysis by Country, 2018 to 2033
Figure 98: Europe Market Value Share (%) and BPS Analysis by Country, 2023 to 2033
Figure 99: Europe Market Y-o-Y Growth (%) Projections by Country, 2023 to 2033
Figure 100: Europe Market Value (US$ Million) Analysis by Technology, 2018 to 2033
Figure 101: Europe Market Volume (Units) Analysis by Technology, 2018 to 2033
Figure 102: Europe Market Value Share (%) and BPS Analysis by Technology, 2023 to 2033
Figure 103: Europe Market Y-o-Y Growth (%) Projections by Technology, 2023 to 2033
Figure 104: Europe Market Value (US$ Million) Analysis by Machine Type, 2018 to 2033
Figure 105: Europe Market Volume (Units) Analysis by Machine Type, 2018 to 2033
Figure 106: Europe Market Value Share (%) and BPS Analysis by Machine Type, 2023 to 2033
Figure 107: Europe Market Y-o-Y Growth (%) Projections by Machine Type, 2023 to 2033
Figure 108: Europe Market Value (US$ Million) Analysis by Capacity, 2018 to 2033
Figure 109: Europe Market Volume (Units) Analysis by Capacity, 2018 to 2033
Figure 110: Europe Market Value Share (%) and BPS Analysis by Capacity, 2023 to 2033
Figure 111: Europe Market Y-o-Y Growth (%) Projections by Capacity, 2023 to 2033
Figure 112: Europe Market Value (US$ Million) Analysis by End Use Industry, 2018 to 2033
Figure 113: Europe Market Volume (Units) Analysis by End Use Industry, 2018 to 2033
Figure 114: Europe Market Value Share (%) and BPS Analysis by End Use Industry, 2023 to 2033
Figure 115: Europe Market Y-o-Y Growth (%) Projections by End Use Industry, 2023 to 2033
Figure 116: Europe Market Attractiveness by Technology, 2023 to 2033
Figure 117: Europe Market Attractiveness by Machine Type, 2023 to 2033
Figure 118: Europe Market Attractiveness by Capacity, 2023 to 2033
Figure 119: Europe Market Attractiveness by End Use Industry, 2023 to 2033
Figure 120: Europe Market Attractiveness by Country, 2023 to 2033
Figure 121: Asia Pacific Market Value (US$ Million) by Technology, 2023 to 2033
Figure 122: Asia Pacific Market Value (US$ Million) by Machine Type, 2023 to 2033
Figure 123: Asia Pacific Market Value (US$ Million) by Capacity, 2023 to 2033
Figure 124: Asia Pacific Market Value (US$ Million) by End Use Industry, 2023 to 2033
Figure 125: Asia Pacific Market Value (US$ Million) by Country, 2023 to 2033
Figure 126: Asia Pacific Market Value (US$ Million) Analysis by Country, 2018 to 2033
Figure 127: Asia Pacific Market Volume (Units) Analysis by Country, 2018 to 2033
Figure 128: Asia Pacific Market Value Share (%) and BPS Analysis by Country, 2023 to 2033
Figure 129: Asia Pacific Market Y-o-Y Growth (%) Projections by Country, 2023 to 2033
Figure 130: Asia Pacific Market Value (US$ Million) Analysis by Technology, 2018 to 2033
Figure 131: Asia Pacific Market Volume (Units) Analysis by Technology, 2018 to 2033
Figure 132: Asia Pacific Market Value Share (%) and BPS Analysis by Technology, 2023 to 2033
Figure 133: Asia Pacific Market Y-o-Y Growth (%) Projections by Technology, 2023 to 2033
Figure 134: Asia Pacific Market Value (US$ Million) Analysis by Machine Type, 2018 to 2033
Figure 135: Asia Pacific Market Volume (Units) Analysis by Machine Type, 2018 to 2033
Figure 136: Asia Pacific Market Value Share (%) and BPS Analysis by Machine Type, 2023 to 2033
Figure 137: Asia Pacific Market Y-o-Y Growth (%) Projections by Machine Type, 2023 to 2033
Figure 138: Asia Pacific Market Value (US$ Million) Analysis by Capacity, 2018 to 2033
Figure 139: Asia Pacific Market Volume (Units) Analysis by Capacity, 2018 to 2033
Figure 140: Asia Pacific Market Value Share (%) and BPS Analysis by Capacity, 2023 to 2033
Figure 141: Asia Pacific Market Y-o-Y Growth (%) Projections by Capacity, 2023 to 2033
Figure 142: Asia Pacific Market Value (US$ Million) Analysis by End Use Industry, 2018 to 2033
Figure 143: Asia Pacific Market Volume (Units) Analysis by End Use Industry, 2018 to 2033
Figure 144: Asia Pacific Market Value Share (%) and BPS Analysis by End Use Industry, 2023 to 2033
Figure 145: Asia Pacific Market Y-o-Y Growth (%) Projections by End Use Industry, 2023 to 2033
Figure 146: Asia Pacific Market Attractiveness by Technology, 2023 to 2033
Figure 147: Asia Pacific Market Attractiveness by Machine Type, 2023 to 2033
Figure 148: Asia Pacific Market Attractiveness by Capacity, 2023 to 2033
Figure 149: Asia Pacific Market Attractiveness by End Use Industry, 2023 to 2033
Figure 150: Asia Pacific Market Attractiveness by Country, 2023 to 2033
Figure 151: MEA Market Value (US$ Million) by Technology, 2023 to 2033
Figure 152: MEA Market Value (US$ Million) by Machine Type, 2023 to 2033
Figure 153: MEA Market Value (US$ Million) by Capacity, 2023 to 2033
Figure 154: MEA Market Value (US$ Million) by End Use Industry, 2023 to 2033
Figure 155: MEA Market Value (US$ Million) by Country, 2023 to 2033
Figure 156: MEA Market Value (US$ Million) Analysis by Country, 2018 to 2033
Figure 157: MEA Market Volume (Units) Analysis by Country, 2018 to 2033
Figure 158: MEA Market Value Share (%) and BPS Analysis by Country, 2023 to 2033
Figure 159: MEA Market Y-o-Y Growth (%) Projections by Country, 2023 to 2033
Figure 160: MEA Market Value (US$ Million) Analysis by Technology, 2018 to 2033
Figure 161: MEA Market Volume (Units) Analysis by Technology, 2018 to 2033
Figure 162: MEA Market Value Share (%) and BPS Analysis by Technology, 2023 to 2033
Figure 163: MEA Market Y-o-Y Growth (%) Projections by Technology, 2023 to 2033
Figure 164: MEA Market Value (US$ Million) Analysis by Machine Type, 2018 to 2033
Figure 165: MEA Market Volume (Units) Analysis by Machine Type, 2018 to 2033
Figure 166: MEA Market Value Share (%) and BPS Analysis by Machine Type, 2023 to 2033
Figure 167: MEA Market Y-o-Y Growth (%) Projections by Machine Type, 2023 to 2033
Figure 168: MEA Market Value (US$ Million) Analysis by Capacity, 2018 to 2033
Figure 169: MEA Market Volume (Units) Analysis by Capacity, 2018 to 2033
Figure 170: MEA Market Value Share (%) and BPS Analysis by Capacity, 2023 to 2033
Figure 171: MEA Market Y-o-Y Growth (%) Projections by Capacity, 2023 to 2033
Figure 172: MEA Market Value (US$ Million) Analysis by End Use Industry, 2018 to 2033
Figure 173: MEA Market Volume (Units) Analysis by End Use Industry, 2018 to 2033
Figure 174: MEA Market Value Share (%) and BPS Analysis by End Use Industry, 2023 to 2033
Figure 175: MEA Market Y-o-Y Growth (%) Projections by End Use Industry, 2023 to 2033
Figure 176: MEA Market Attractiveness by Technology, 2023 to 2033
Figure 177: MEA Market Attractiveness by Machine Type, 2023 to 2033
Figure 178: MEA Market Attractiveness by Capacity, 2023 to 2033
Figure 179: MEA Market Attractiveness by End Use Industry, 2023 to 2033
Figure 180: MEA Market Attractiveness by Country, 2023 to 2033
Imanpack Packaging, STATEC BINDER GmbH, HASSIA-REDATRON GmbH, Premier Tech Chronos, MONDIAL PACK S.r.l, and Robert Bosch Packaging Technology GmbH.
As per the sack fillers market report insights, automatic sack fillers machines currently hold a dominant market share of 89.5% in the global landscape.
The global sack fillers market is predicted to exceed a valuation of USD 4,272.1 million in 2023.
The market is estimated to showcase a splendid CAGR of 4.5% from 2023 to 2033.
The global market is anticipated to hit a valuation of USD 6,634.4 million by 2033.
The market is valued at USD 4,272.1 million in 2023.
Webster Griffin Ltd., All-Fill Incorporated, and CONCETTI S.P.A. are the vital market players.
The market is forecast to register a CAGR of 4.5% through 2033.
The market is estimated to reach USD 6,634.4 million by 2033.
From 2012 to 2022, the market registered a CAGR of 4.1%.
Explore Similar Insights
Thank you!
You will receive an email from our Business Development Manager. Please be sure to check your SPAM/JUNK folder too.