WiFi Extenders Market Overview (2023 to 2033)

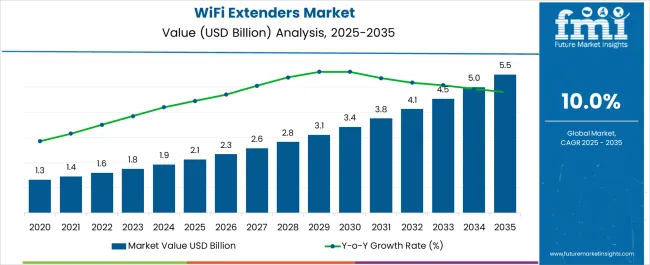
The global WiFi extenders market is projected to reach a valuation of US$ 4,714.5 million by 2033, up from US$ 1,737 million in 2023, advancing at a CAGR of 10.5% from 2023 to 2033.

In recent years, the adoption of wireless networks has witnessed immense growth and its out breakage has outnumbered every other thing that has gone viral ever. Today, every home and office is equipped with high-speed wireless network connections.

WiFi networks have limitations when it comes to the range and this is precisely when WiFi extenders come to the fore, contributing to the overall WiFi extenders market growth.

Report Attribute Details
WiFi Extenders Market Value (2023) US$ 1,737 million
WiFi Extenders Market Anticipated Forecast Value (2033) US$ 4,714.5 million
WiFi Extenders Market Projected Growth Rate (2023 to 2033) 10.5% CAGR

All WiFi extenders work in different ways, and there are several different kinds of devices available in the market, thereby catering to the demand for WiFi extenders from around the globe. The sales of WiFi extenders are also due to the weak signal coverage, and the deployment of WiFi extenders for improving coverage in localized areas is gaining traction to overcome problems associated with signal coverage.

Generally, WiFi extenders adoption trends are hugely influenced by larger homes or spaces, where there are reduced coverage areas or dead spots. The global WiFi range extenders market size is driven by ease of setup at low cost in tandem with a rise in the number of connected devices.

The development of smart homes and cities is anticipated to create lucrative WiFi range extenders market opportunities in the near future. The use of wireless routers in the commercial sector has been further boosted by the emergence of the BYOD trend in the corporate sector, in turn, fuelling the overall demand for WiFi extenders.

The WiFi extenders market outlook is predicted to be positively influenced by the growing consumer preference for the installation of smart appliances in their homes, including smartphones, tablets, and smart TVs, among other appliances.

Don't pay for what you don't need

Customize your report by selecting specific countries or regions and save 30%!

Key WiFi Extenders Market Dynamics

The need for public WiFi networks has increased, particularly for the management of infrastructure, traffic, safety, and waste and water, and the same is likely to spike the sales of WiFi extenders to a considerable extent. The WiFi extenders market key trends & opportunities are primarily fostered by the telecommunications sector's increased adoption of LTE technology.

The rising demand for WiFi extenders is also due to the fact that WiFi extenders greatly aid in offices or homes where there is one main wireless connection that needs to cover a wider coverage area than the capacity of the main router.

Increasing efforts from service providers and device vendors to eliminate problems such as poor signal quality and slow internet speeds are also expected to augur well for the WiFi extenders market future trends. There is a surge in the sales of WiFi extenders among people living in high-rises, as the buildings are closely packed, and most residents do not get a proper network.

Consumer electronics, safety, and defense industries have experienced rapid growth and development, setting the stage for new business opportunities, in turn, this is positively impacting the WiFi Extenders market trends and forecast. According to the WiFi Extenders market survey, growing public awareness of various technological advancements is a major factor influencing the demand for WiFi extenders.

The WiFi extenders market size expansion is largely due to rapidly evolving WiFi Extenders market trends and consumer preferences, including customization and testing services tailored to specific industries. The market for WiFi extenders is also growing significantly due to the rising demand for cloud computing services and applications.

Challenges that are hampering the deployment of WiFi extenders on a broad scale include low awareness, high device and installation costs, and limitations of these devices in increasing Internet throughput from public hotspots. The inability of these devices to amplify a signal from a distant Internet source to create a wireless hotspot effectively is also expected to impede the WiFi Extenders market growth.
North America is Likely to Dominate the WiFi Extenders Market

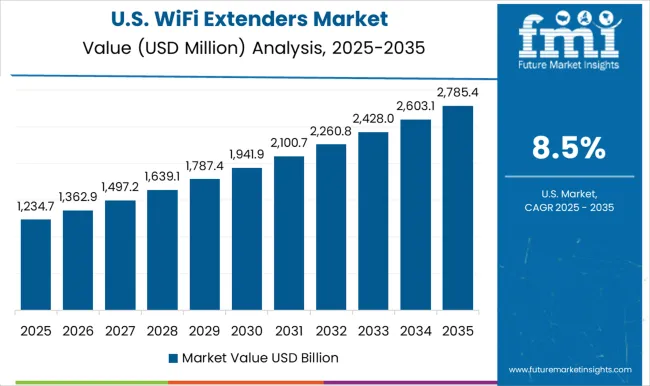
The market for WiFi extenders has advanced in the North American region because of the telecommunications and network sector's expansion and the emergence of regional players. The WiFi extenders market in the United States is steadily growing, contributing to North America’s anticipated WiFi extenders market share of 37% in 2023.

The majority of the major manufacturers of WiFi range extenders have their corporate headquarters in the region. Prior to a global launch and deployment of the product, the majority of businesses test and introduce their goods locally, pushing forward the region’s market growth.

North America’s WiFi extenders market statistics are expected to get on a higher trajectory due to the rising number of devices per household, quick adoption of new technology, and growing emphasis on digitalization.
Sudip Saha
Sudip Saha

Principal Consultant

Talk to Analyst

Find your sweet spots for generating winning opportunities in this market.

Europe’s WiFi Extenders Market Evolving

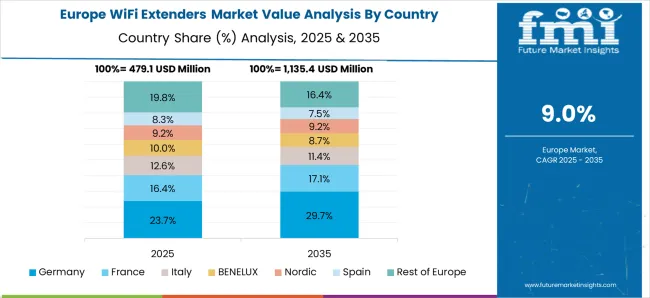
Europe is likely to acquire a WiFi extenders market share of 21% as of 2023, owing to the soaring sales of WiFi extenders in the European region being fuelled by technological developments and a growing consumer electronics market.

One of the market's top players, Tesla, has introduced the Smart WiFi booster Gen 3 that is intended for remote workers. The WiFi 6 technology used in the booster's construction was entirely made of recycled plastic.

This factor has raised the product's value throughout Europe and in other nations where there are restrictions on the use of plastics, in turn, eliciting emerging trends in the WiFi extenders market.
Start-up Ecosystem in the WiFi Extenders Market

  • Galgus has received €4 million to continue developing intelligent WiFi technology that enhances network performance and offers cutting-edge geolocation analytics. GED Capital, Mundi Ventures, and GoHub Ventures took the lead in providing funding for the Seville-based business.
  • Since its founding in 2013, Galgus has been using its unique WiFi technology in various settings. Galgus keeps us connected everywhere, from airplanes and trains to football stadiums, shopping centers, hotels, convention centers, businesses, rural areas, and beyond.
  • The Cognitive HotspotTM Technology from Galgus is one of the key patents (CHT). This generic embedded software maximizes spectral efficiencies for WiFi routers and access points, giving WiFi networks intelligence (APs).

Get the data you need at a Fraction of the cost

Personalize your report by choosing insights you need
and save 40%!

Competition Landscape of the WiFi Extenders Market

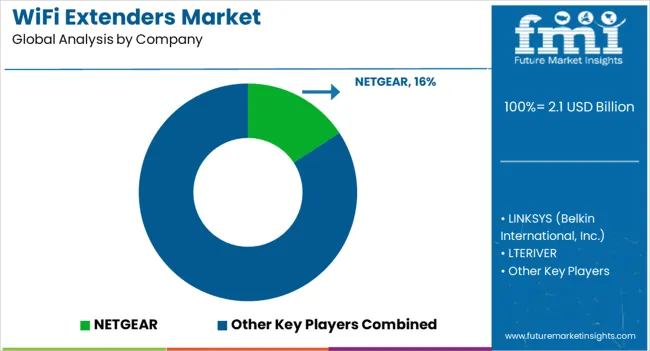
Key players operating in the global WiFi extenders market are NETGEAR, LINKSYS (Belkin International, Inc.), LTERIVER, D-Link Corporation, TP-Link Technologies Co., Ltd, Amped Wireless, Zyxel Communications Corp and Hawking Technologies, Inc., Lutron Electronics Co., Inc., Asustec Computer Inc.

With the concept of WiFi extender being both evolutionary and of sufficient value, an increasing number of vendors are expected to bring about emerging trends in the WiFi extenders market.

  • The Shenzhen Tenda Technology Co., Ltd announced the MX6-3 AX1800, a whole-home mesh Wi-Fi 6 system targeted for larger families, in June 2022. An extendable mesh network encompasses many Wi-Fi sites and fills a 6000-square-foot space flawlessly.
  • Linksys declared the debut of two novel wifi 6 mesh systems in May 2022, with the goal of providing peak wifi efficiency to consumers, specifically distant workers, multimedia streaming, and multi-user gaming. The Linksys Hydra 6 and Linksys Atlas 6 are the organization's latest entry-level dual-band equipment, along with one of the most affordable models.

Report Scope

Report Attribute Details
Growth Rate CAGR of 10.5% from 2023 to 2033
WiFi Extenders Market Value (2023) US$ 1,737 million
WiFi Extenders Market Anticipated Forecast Value (2033) US$ 4,714.5 million
Base Year for Estimation 2022
Historical Data 2018 to 2022
Forecast Period 2023 to 2033
Quantitative Units Revenue in US$ million and CAGR from 2023 to 2033
Report Coverage Revenue Forecast, Volume Forecast, Company Ranking, Competitive Landscape, Growth Factors, Trends and Pricing Analysis
Segments Covered
  • Product Type
  • End Use
  • Region
Regions Covered
  • North America
  • Latin America
  • Western Europe
  • Eastern Europe
  • South Asia & Pacific
  • East Asia
  • Middle East & Africa
Key Countries Profiled
  • United States
  • Canada
  • Brazil
  • Mexico
  • Germany
  • United Kingdom
  • France
  • Spain
  • Italy
  • Poland
  • Russia
  • Czech Republic
  • Romania
  • India
  • Bangladesh
  • Australia
  • New Zealand
  • China
  • Japan
  • South Korea
  • GCC Countries
  • South Africa
  • Israel
Key Companies Profiled
  • NETGEAR
  • LINKSYS (Belkin International Inc.)
  • LTERIVER
  • D-Link Corporation
  • TP-Link Technologies Co., Ltd.
  • Amped Wireless
  • Zyxel Communications Corp.
  • Hawking Technologies Inc.
  • Lutron Electronics Co. Inc.
  • Asustec Computer Inc.
Customization & Pricing Available upon Request

Key Segments Profiled in the WiFi Extenders Market Survey

By Product Type:

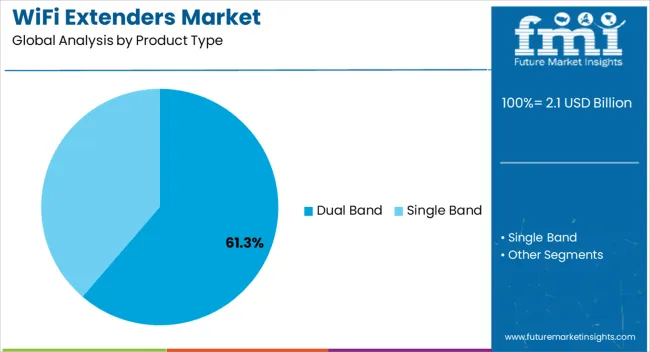
  • Single Band
  • Dual Band

By End Use:

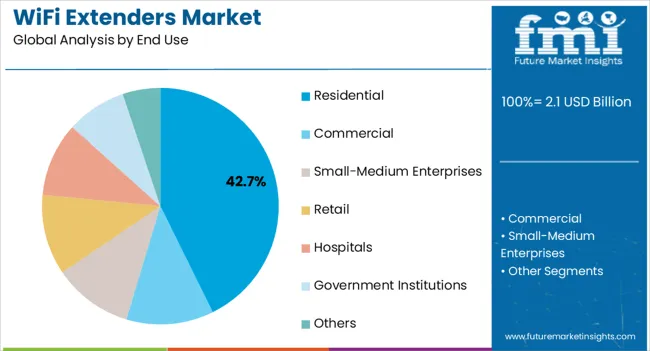
  • Residential
  • Commercial
  • Small-Medium Enterprises
  • Retail
  • Hospitals
  • Government Institutions
  • Others

By Region:

  • North America
  • Latin America
  • Western Europe
  • Eastern Europe
  • South Asia & Pacific
  • East Asia
  • Middle East & Africa

Frequently Asked Questions

How Big is the WiFi Extenders Market?

The market is valued at US$ 1,737.0 million in 2023.

Who are the Key WiFi Extenders Market Players?

D-link Corporation and NETGEAR are key WiFi extenders market players.

Which is the Key Segment by End Use?

Residential is estimated as a key segment in the global market.

Which is the Go-to-Market Strategy?

Players opt for advanced hotspotTM technology.

Which are the Key Asian Countries in the WiFi Extenders Market?

India and China dominate the Asian market.

Table of Content
1. Executive Summary
    1.1. Global Market Outlook
    1.2. Demand-side Trends
    1.3. Supply-side Trends
    1.4. Technology Roadmap Analysis
    1.5. Analysis and Recommendations
2. Market Overview
    2.1. Market Coverage / Taxonomy
    2.2. Market Definition / Scope / Limitations
3. Market Background
    3.1. Market Dynamics
        3.1.1. Drivers
        3.1.2. Restraints
        3.1.3. Opportunity
        3.1.4. Trends
    3.2. Scenario Forecast
        3.2.1. Demand in Optimistic Scenario
        3.2.2. Demand in Likely Scenario
        3.2.3. Demand in Conservative Scenario
    3.3. Opportunity Map Analysis
    3.4. Product Life Cycle Analysis
    3.5. Supply Chain Analysis
        3.5.1. Supply Side Participants and their Roles
            3.5.1.1. Producers
            3.5.1.2. Mid-Level Participants (Traders/ Agents/ Brokers)
            3.5.1.3. Wholesalers and Distributors
        3.5.2. Value Added and Value Created at Node in the Supply Chain
        3.5.3. List of Raw Material Suppliers
        3.5.4. List of Existing and Potential Buyer’s
    3.6. Investment Feasibility Matrix
    3.7. Value Chain Analysis
        3.7.1. Profit Margin Analysis
        3.7.2. Wholesalers and Distributors
        3.7.3. Retailers
    3.8. PESTLE and Porter’s Analysis
    3.9. Regulatory Landscape
        3.9.1. By Key Regions
        3.9.2. By Key Countries
    3.10. Regional Parent Market Outlook
    3.11. Production and Consumption Statistics
    3.12. Import and Export Statistics
4. Global Market Analysis 2018 to 2022 and Forecast, 2023 to 2033
    4.1. Historical Market Size Value (US$ Million) & Volume (Units) Analysis, 2018 to 2022
    4.2. Current and Future Market Size Value (US$ Million) & Volume (Units) Projections, 2023 to 2033
        4.2.1. Y-o-Y Growth Trend Analysis
        4.2.2. Absolute $ Opportunity Analysis
5. Global Market Analysis 2018 to 2022 and Forecast 2023 to 2033, By Product Type
    5.1. Introduction / Key Findings
    5.2. Historical Market Size Value (US$ Million) & Volume (Units) Analysis By Product Type, 2018 to 2022
    5.3. Current and Future Market Size Value (US$ Million) & Volume (Units) Analysis and Forecast By Product Type, 2023 to 2033
        5.3.1. Single Band
        5.3.2. Dual Band
    5.4. Y-o-Y Growth Trend Analysis By Product Type, 2018 to 2022
    5.5. Absolute $ Opportunity Analysis By Product Type, 2023 to 2033
6. Global Market Analysis 2018 to 2022 and Forecast 2023 to 2033, By End Use
    6.1. Introduction / Key Findings
    6.2. Historical Market Size Value (US$ Million) & Volume (Units) Analysis By End Use, 2018 to 2022
    6.3. Current and Future Market Size Value (US$ Million) & Volume (Units) Analysis and Forecast By End Use, 2023 to 2033
        6.3.1. Residential
        6.3.2. Commercial
            6.3.2.1. Small-Medium Enterprises
            6.3.2.2. Retail
            6.3.2.3. Hospitals
            6.3.2.4. Government Institutions
            6.3.2.5. Others
    6.4. Y-o-Y Growth Trend Analysis By End Use, 2018 to 2022
    6.5. Absolute $ Opportunity Analysis By End Use, 2023 to 2033
7. Global Market Analysis 2018 to 2022 and Forecast 2023 to 2033, By Region
    7.1. Introduction
    7.2. Historical Market Size Value (US$ Million) & Volume (Units) Analysis By Region, 2018 to 2022
    7.3. Current Market Size Value (US$ Million) & Volume (Units) Analysis and Forecast By Region, 2023 to 2033
        7.3.1. North America
        7.3.2. Latin America
        7.3.3. Western Europe
        7.3.4. Eastern Europe
        7.3.5. South Asia and Pacific
        7.3.6. East Asia
        7.3.7. Middle East and Africa
    7.4. Market Attractiveness Analysis By Region
8. North America Market Analysis 2018 to 2022 and Forecast 2023 to 2033, By Country
    8.1. Historical Market Size Value (US$ Million) & Volume (Units) Trend Analysis By Market Taxonomy, 2018 to 2022
    8.2. Market Size Value (US$ Million) & Volume (Units) Forecast By Market Taxonomy, 2023 to 2033
        8.2.1. By Country
            8.2.1.1. USA
            8.2.1.2. Canada
        8.2.2. By Product Type
        8.2.3. By End Use
    8.3. Market Attractiveness Analysis
        8.3.1. By Country
        8.3.2. By Product Type
        8.3.3. By End Use
    8.4. Key Takeaways
9. Latin America Market Analysis 2018 to 2022 and Forecast 2023 to 2033, By Country
    9.1. Historical Market Size Value (US$ Million) & Volume (Units) Trend Analysis By Market Taxonomy, 2018 to 2022
    9.2. Market Size Value (US$ Million) & Volume (Units) Forecast By Market Taxonomy, 2023 to 2033
        9.2.1. By Country
            9.2.1.1. Brazil
            9.2.1.2. Mexico
            9.2.1.3. Rest of Latin America
        9.2.2. By Product Type
        9.2.3. By End Use
    9.3. Market Attractiveness Analysis
        9.3.1. By Country
        9.3.2. By Product Type
        9.3.3. By End Use
    9.4. Key Takeaways
10. Western Europe Market Analysis 2018 to 2022 and Forecast 2023 to 2033, By Country
    10.1. Historical Market Size Value (US$ Million) & Volume (Units) Trend Analysis By Market Taxonomy, 2018 to 2022
    10.2. Market Size Value (US$ Million) & Volume (Units) Forecast By Market Taxonomy, 2023 to 2033
        10.2.1. By Country
            10.2.1.1. Germany
            10.2.1.2. UK
            10.2.1.3. France
            10.2.1.4. Spain
            10.2.1.5. Italy
            10.2.1.6. Rest of Western Europe
        10.2.2. By Product Type
        10.2.3. By End Use
    10.3. Market Attractiveness Analysis
        10.3.1. By Country
        10.3.2. By Product Type
        10.3.3. By End Use
    10.4. Key Takeaways
11. Eastern Europe Market Analysis 2018 to 2022 and Forecast 2023 to 2033, By Country
    11.1. Historical Market Size Value (US$ Million) & Volume (Units) Trend Analysis By Market Taxonomy, 2018 to 2022
    11.2. Market Size Value (US$ Million) & Volume (Units) Forecast By Market Taxonomy, 2023 to 2033
        11.2.1. By Country
            11.2.1.1. Poland
            11.2.1.2. Russia
            11.2.1.3. Czech Republic
            11.2.1.4. Romania
            11.2.1.5. Rest of Eastern Europe
        11.2.2. By Product Type
        11.2.3. By End Use
    11.3. Market Attractiveness Analysis
        11.3.1. By Country
        11.3.2. By Product Type
        11.3.3. By End Use
    11.4. Key Takeaways
12. South Asia and Pacific Market Analysis 2018 to 2022 and Forecast 2023 to 2033, By Country
    12.1. Historical Market Size Value (US$ Million) & Volume (Units) Trend Analysis By Market Taxonomy, 2018 to 2022
    12.2. Market Size Value (US$ Million) & Volume (Units) Forecast By Market Taxonomy, 2023 to 2033
        12.2.1. By Country
            12.2.1.1. India
            12.2.1.2. Bangladesh
            12.2.1.3. Australia
            12.2.1.4. New Zealand
            12.2.1.5. Rest of South Asia and Pacific
        12.2.2. By Product Type
        12.2.3. By End Use
    12.3. Market Attractiveness Analysis
        12.3.1. By Country
        12.3.2. By Product Type
        12.3.3. By End Use
    12.4. Key Takeaways
13. East Asia Market Analysis 2018 to 2022 and Forecast 2023 to 2033, By Country
    13.1. Historical Market Size Value (US$ Million) & Volume (Units) Trend Analysis By Market Taxonomy, 2018 to 2022
    13.2. Market Size Value (US$ Million) & Volume (Units) Forecast By Market Taxonomy, 2023 to 2033
        13.2.1. By Country
            13.2.1.1. China
            13.2.1.2. Japan
            13.2.1.3. South Korea
        13.2.2. By Product Type
        13.2.3. By End Use
    13.3. Market Attractiveness Analysis
        13.3.1. By Country
        13.3.2. By Product Type
        13.3.3. By End Use
    13.4. Key Takeaways
14. Middle East and Africa Market Analysis 2018 to 2022 and Forecast 2023 to 2033, By Country
    14.1. Historical Market Size Value (US$ Million) & Volume (Units) Trend Analysis By Market Taxonomy, 2018 to 2022
    14.2. Market Size Value (US$ Million) & Volume (Units) Forecast By Market Taxonomy, 2023 to 2033
        14.2.1. By Country
            14.2.1.1. GCC Countries
            14.2.1.2. South Africa
            14.2.1.3. Israel
            14.2.1.4. Rest of MEA
        14.2.2. By Product Type
        14.2.3. By End Use
    14.3. Market Attractiveness Analysis
        14.3.1. By Country
        14.3.2. By Product Type
        14.3.3. By End Use
    14.4. Key Takeaways
15. Key Countries Market Analysis
    15.1. USA
        15.1.1. Pricing Analysis
        15.1.2. Market Share Analysis, 2022
            15.1.2.1. By Product Type
            15.1.2.2. By End Use
    15.2. Canada
        15.2.1. Pricing Analysis
        15.2.2. Market Share Analysis, 2022
            15.2.2.1. By Product Type
            15.2.2.2. By End Use
    15.3. Brazil
        15.3.1. Pricing Analysis
        15.3.2. Market Share Analysis, 2022
            15.3.2.1. By Product Type
            15.3.2.2. By End Use
    15.4. Mexico
        15.4.1. Pricing Analysis
        15.4.2. Market Share Analysis, 2022
            15.4.2.1. By Product Type
            15.4.2.2. By End Use
    15.5. Germany
        15.5.1. Pricing Analysis
        15.5.2. Market Share Analysis, 2022
            15.5.2.1. By Product Type
            15.5.2.2. By End Use
    15.6. UK
        15.6.1. Pricing Analysis
        15.6.2. Market Share Analysis, 2022
            15.6.2.1. By Product Type
            15.6.2.2. By End Use
    15.7. France
        15.7.1. Pricing Analysis
        15.7.2. Market Share Analysis, 2022
            15.7.2.1. By Product Type
            15.7.2.2. By End Use
    15.8. Spain
        15.8.1. Pricing Analysis
        15.8.2. Market Share Analysis, 2022
            15.8.2.1. By Product Type
            15.8.2.2. By End Use
    15.9. Italy
        15.9.1. Pricing Analysis
        15.9.2. Market Share Analysis, 2022
            15.9.2.1. By Product Type
            15.9.2.2. By End Use
    15.10. Poland
        15.10.1. Pricing Analysis
        15.10.2. Market Share Analysis, 2022
            15.10.2.1. By Product Type
            15.10.2.2. By End Use
    15.11. Russia
        15.11.1. Pricing Analysis
        15.11.2. Market Share Analysis, 2022
            15.11.2.1. By Product Type
            15.11.2.2. By End Use
    15.12. Czech Republic
        15.12.1. Pricing Analysis
        15.12.2. Market Share Analysis, 2022
            15.12.2.1. By Product Type
            15.12.2.2. By End Use
    15.13. Romania
        15.13.1. Pricing Analysis
        15.13.2. Market Share Analysis, 2022
            15.13.2.1. By Product Type
            15.13.2.2. By End Use
    15.14. India
        15.14.1. Pricing Analysis
        15.14.2. Market Share Analysis, 2022
            15.14.2.1. By Product Type
            15.14.2.2. By End Use
    15.15. Bangladesh
        15.15.1. Pricing Analysis
        15.15.2. Market Share Analysis, 2022
            15.15.2.1. By Product Type
            15.15.2.2. By End Use
    15.16. Australia
        15.16.1. Pricing Analysis
        15.16.2. Market Share Analysis, 2022
            15.16.2.1. By Product Type
            15.16.2.2. By End Use
    15.17. New Zealand
        15.17.1. Pricing Analysis
        15.17.2. Market Share Analysis, 2022
            15.17.2.1. By Product Type
            15.17.2.2. By End Use
    15.18. China
        15.18.1. Pricing Analysis
        15.18.2. Market Share Analysis, 2022
            15.18.2.1. By Product Type
            15.18.2.2. By End Use
    15.19. Japan
        15.19.1. Pricing Analysis
        15.19.2. Market Share Analysis, 2022
            15.19.2.1. By Product Type
            15.19.2.2. By End Use
    15.20. South Korea
        15.20.1. Pricing Analysis
        15.20.2. Market Share Analysis, 2022
            15.20.2.1. By Product Type
            15.20.2.2. By End Use
    15.21. GCC Countries
        15.21.1. Pricing Analysis
        15.21.2. Market Share Analysis, 2022
            15.21.2.1. By Product Type
            15.21.2.2. By End Use
    15.22. South Africa
        15.22.1. Pricing Analysis
        15.22.2. Market Share Analysis, 2022
            15.22.2.1. By Product Type
            15.22.2.2. By End Use
    15.23. Israel
        15.23.1. Pricing Analysis
        15.23.2. Market Share Analysis, 2022
            15.23.2.1. By Product Type
            15.23.2.2. By End Use
16. Market Structure Analysis
    16.1. Competition Dashboard
    16.2. Competition Benchmarking
    16.3. Market Share Analysis of Top Players
        16.3.1. By Regional
        16.3.2. By Product Type
        16.3.3. By End Use
17. Competition Analysis
    17.1. Competition Deep Dive
        17.1.1. NETGEAR
            17.1.1.1. Overview
            17.1.1.2. Product Portfolio
            17.1.1.3. Profitability by Market Segments
            17.1.1.4. Sales Footprint
            17.1.1.5. Strategy Overview
                17.1.1.5.1. Marketing Strategy
                17.1.1.5.2. Product Strategy
                17.1.1.5.3. Channel Strategy
        17.1.2. LINKSYS (Belkin International, Inc.)
            17.1.2.1. Overview
            17.1.2.2. Product Portfolio
            17.1.2.3. Profitability by Market Segments
            17.1.2.4. Sales Footprint
            17.1.2.5. Strategy Overview
                17.1.2.5.1. Marketing Strategy
                17.1.2.5.2. Product Strategy
                17.1.2.5.3. Channel Strategy
        17.1.3. LTERIVER
            17.1.3.1. Overview
            17.1.3.2. Product Portfolio
            17.1.3.3. Profitability by Market Segments
            17.1.3.4. Sales Footprint
            17.1.3.5. Strategy Overview
                17.1.3.5.1. Marketing Strategy
                17.1.3.5.2. Product Strategy
                17.1.3.5.3. Channel Strategy
        17.1.4. D-Link Corporation
            17.1.4.1. Overview
            17.1.4.2. Product Portfolio
            17.1.4.3. Profitability by Market Segments
            17.1.4.4. Sales Footprint
            17.1.4.5. Strategy Overview
                17.1.4.5.1. Marketing Strategy
                17.1.4.5.2. Product Strategy
                17.1.4.5.3. Channel Strategy
        17.1.5. TP-Link Technologies Co., Ltd.
            17.1.5.1. Overview
            17.1.5.2. Product Portfolio
            17.1.5.3. Profitability by Market Segments
            17.1.5.4. Sales Footprint
            17.1.5.5. Strategy Overview
                17.1.5.5.1. Marketing Strategy
                17.1.5.5.2. Product Strategy
                17.1.5.5.3. Channel Strategy
        17.1.6. Amped Wireless
            17.1.6.1. Overview
            17.1.6.2. Product Portfolio
            17.1.6.3. Profitability by Market Segments
            17.1.6.4. Sales Footprint
            17.1.6.5. Strategy Overview
                17.1.6.5.1. Marketing Strategy
                17.1.6.5.2. Product Strategy
                17.1.6.5.3. Channel Strategy
        17.1.7. Zyxel Communications Corp.
            17.1.7.1. Overview
            17.1.7.2. Product Portfolio
            17.1.7.3. Profitability by Market Segments
            17.1.7.4. Sales Footprint
            17.1.7.5. Strategy Overview
                17.1.7.5.1. Marketing Strategy
                17.1.7.5.2. Product Strategy
                17.1.7.5.3. Channel Strategy
        17.1.8. Hawking Technologies, Inc.
            17.1.8.1. Overview
            17.1.8.2. Product Portfolio
            17.1.8.3. Profitability by Market Segments
            17.1.8.4. Sales Footprint
            17.1.8.5. Strategy Overview
                17.1.8.5.1. Marketing Strategy
                17.1.8.5.2. Product Strategy
                17.1.8.5.3. Channel Strategy
        17.1.9. Lutron Electronics Co., Inc.
            17.1.9.1. Overview
            17.1.9.2. Product Portfolio
            17.1.9.3. Profitability by Market Segments
            17.1.9.4. Sales Footprint
            17.1.9.5. Strategy Overview
                17.1.9.5.1. Marketing Strategy
                17.1.9.5.2. Product Strategy
                17.1.9.5.3. Channel Strategy
        17.1.10. Asustec Computer Inc.
            17.1.10.1. Overview
            17.1.10.2. Product Portfolio
            17.1.10.3. Profitability by Market Segments
            17.1.10.4. Sales Footprint
            17.1.10.5. Strategy Overview
                17.1.10.5.1. Marketing Strategy
                17.1.10.5.2. Product Strategy
                17.1.10.5.3. Channel Strategy
18. Assumptions & Acronyms Used
19. Research Methodology
Recommendations

Technology

Gigabit Wi-Fi Access Point Market

March 2024

REP-GB-1351

324 pages

Technology

Wi-Fi Market

July 2023

REP-GB-1876

324 pages

Technology

Voice Over LTE (VOLTE) And Voice Over Wi-Fi Market

November 2022

REP-GB-1460

250 pages

Technology

Home Wi-Fi Security Solutions Market

October 2022

REP-AP-1723

250 pages

Explore Technology Insights

View Reports
Future Market Insights

WiFi Extenders Market

Schedule a Call