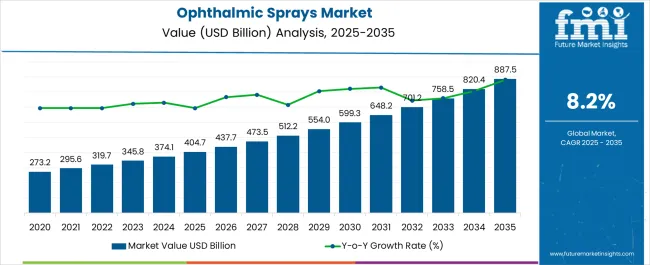
The Ophthalmic Sprays Market is estimated to be valued at USD 404.7 billion in 2025 and is projected to reach USD 887.5 billion by 2035, registering a compound annual growth rate (CAGR) of 8.2% over the forecast period.
| Metric | Value |
|---|---|
| Ophthalmic Sprays Market Estimated Value in (2025 E) | USD 404.7 billion |
| Ophthalmic Sprays Market Forecast Value in (2035 F) | USD 887.5 billion |
| Forecast CAGR (2025 to 2035) | 8.2% |
The ophthalmic sprays market is expanding steadily as demand for innovative drug delivery formats in ophthalmology continues to rise. Increasing prevalence of eye disorders such as dry eye disease, allergic conjunctivitis, and post surgical complications is boosting the need for convenient, non invasive treatment solutions.
Ophthalmic sprays are gaining acceptance due to their ability to provide precise dosage, reduced contamination risk, and enhanced patient compliance compared to traditional drop formulations. Technological advancements in spray mechanisms and formulation stability are enabling greater therapeutic efficiency and longer shelf life.
Regulatory support for preservative free and patient friendly products is further shaping adoption across global markets. With healthcare providers and pharmaceutical companies emphasizing better outcomes and patient centric delivery methods, the outlook for ophthalmic sprays remains positive, offering opportunities for innovation and broader therapeutic integration.
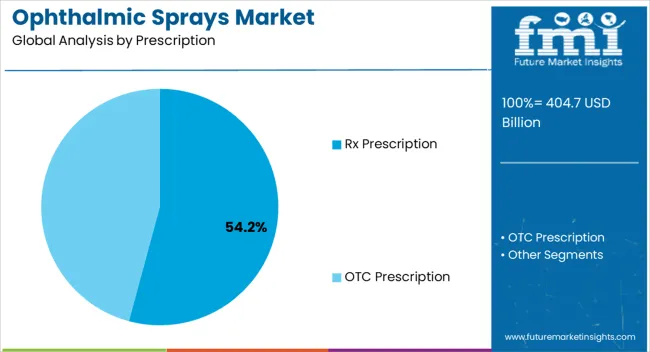
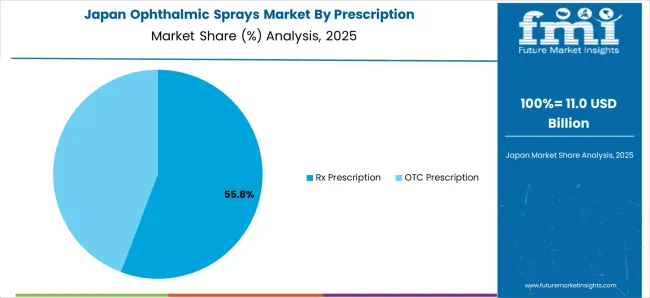
The Rx prescription segment is anticipated to hold 54.20% of the total market revenue by 2025, establishing itself as the leading category. This dominance is attributed to the rising incidence of chronic and acute ophthalmic conditions requiring physician guided treatment.
The growing reliance on prescription sprays for conditions such as post operative recovery, bacterial infections, and long term eye care management has reinforced the demand. Physicians continue to prefer prescription based sprays as they ensure compliance with clinical protocols and provide patients with targeted therapies.
With expanding healthcare access and continuous innovation in ophthalmic drug delivery, Rx prescription sprays are expected to maintain their leadership position.
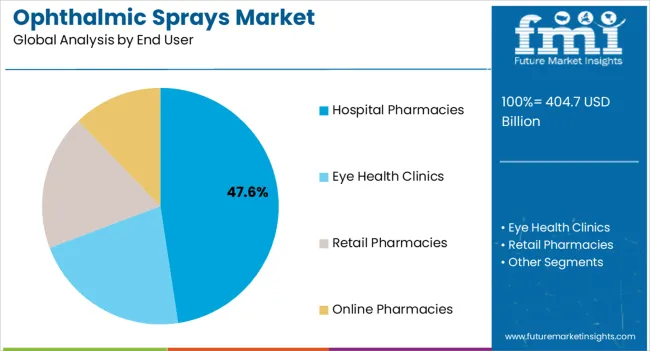
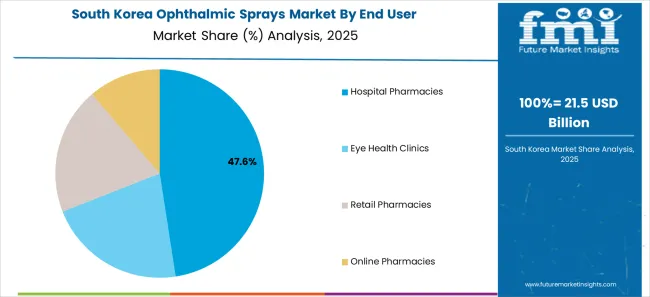
The hospital pharmacies segment is projected to account for 47.60% of overall revenue by 2025, positioning it as the most significant end user. This leadership stems from the role of hospital pharmacies as primary distribution points for prescription ophthalmic sprays, particularly in post surgical and inpatient care.
Growing surgical volumes, coupled with the emphasis on hospital based treatment protocols, have accelerated reliance on hospital pharmacies. Their integration with ophthalmologists and specialists ensures timely availability of advanced prescription sprays for patients.
Furthermore, the trust and credibility associated with hospital pharmacies strengthen patient preference for sourcing prescription ophthalmic products through this channel, thereby solidifying their market dominance.
From 2020 to 2025, the global ophthalmic sprays market experienced a CAGR of 7.9%, reaching a market size of USD 404.7 million in 2025.
From 2020 to 2025, Over the past two decades, advances in pharmaceutical formulations, drug delivery systems, and manufacturing processes have led to the development of more effective and convenient ophthalmic pharmaceutical products, including sprays. These technological advancements have improved the bioavailability of active ingredients, enhanced therapeutic outcomes, and increased patient compliance.
Future Forecast for Ophthalmic Sprays Industry:
Looking ahead, the global ophthalmic sprays industry is expected to rise at a CAGR of 8.6% from 2025 to 2035. During the forecast period, the market size is expected to reach USD 887.5 million by 2035.
The ophthalmic sprays industry is expected to continue its growth trajectory from 2025 to 2035, driven by increasing prevalence of eye disorders such as dry eye syndrome, conjunctivitis, and allergies is projected to rise in the coming years. Factors such as aging populations, digital device usage, environmental factors, and lifestyle changes contribute to the growing incidence of these conditions. Ophthalmic sprays provide a convenient and effective solution for managing these conditions, driving their future growth.
In ophthalmic sprays industry, pH-triggered ophthalmic sprays utilize pH-sensitive polymers or systems that undergo changes in viscosity or gelation in response to ocular ph. These formulations can improve drug bioavailability and prolong the residence time on the ocular surface. pH-triggered formulations offer the advantage of increased drug release and enhanced therapeutic effect at the target site.
| Country | The United States |
|---|---|
| Market Size (USD million) by End of Forecast Period (2035) | USD 887.5.0 million |
| CAGR % 2025 to End of Forecast (2035) | 7.9% |
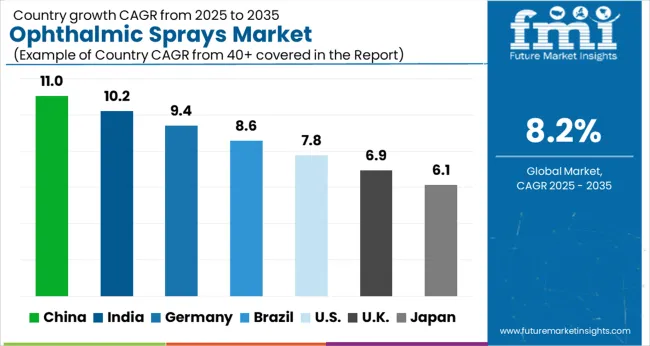
The ophthalmic sprays industry in the United States is expected to reach a market size of USD 887.5.0 million by 2035, expanding at a CAGR of 7.9%. Dry eye syndrome is a common condition in the United States, affecting millions of people.
This has led to an increased demand for products that provide relief from dryness and irritation. Ophthalmic sprays, with their ability to provide instant hydration and lubrication to the eyes, are gaining popularity as a convenient and effective solution for managing dry eye symptoms.
| Country | The United Kingdom |
|---|---|
| Market Size (USD million) by End of Forecast Period (2035) | USD 27.3 million |
| CAGR % 2025 to End of Forecast (2035) | 7.5% |
The ophthalmic sprays industry in the United Kingdom is expected to reach a market size of USD 27.3 million by 2035, expanding at a CAGR of 7.5% during the forecast period.
The UK market has witnessed the integration of digital technology in the ophthalmic sector, and this includes ophthalmic sprays. Smartphone applications and connected devices are being developed to assist with eye care management, including reminders for using ophthalmic sprays and tracking symptom relief.
| Country | China |
|---|---|
| Market Size (USD million) by End of Forecast Period (2035) | USD 36.0 million |
| CAGR % 2025 to End of Forecast (2035) | 9.5% |
The ophthalmic sprays industry in China is anticipated to reach a market size of USD 36.0 million by 2035, moving at a CAGR of 9.5% during the forecast period.
China's rapid urbanization has resulted in increased exposure to air pollution, which can contribute to eye irritation and dryness. Ophthalmic sprays that provide a protective barrier and hydration to the eyes are gaining popularity as a solution for combating the effects of air pollution on eye health.
| Country | Japan |
|---|---|
| Market Size (USD million) by End of Forecast Period (2035) | USD 35.0 million |
| CAGR % 2025 to End of Forecast (2035) | 7.4% |
The ophthalmic sprays industry in Japan is estimated to reach a market size of USD 35.0 million by 2035, thriving at a CAGR of 7.4%. With the widespread use of digital devices in Japan, there is a growing concern about digital eye strain and its impact on eye health.
Ophthalmic sprays that alleviate dryness, eye fatigue, and irritation associated with prolonged screen time are in demand. These sprays are positioned as a solution to address the specific needs of individuals who spend significant time in front of screens.
| Country | South Korea |
|---|---|
| Market Size (USD million) by End of Forecast Period (2035) | USD 1.3 million |
| CAGR % 2025 to End of Forecast (2035) | 8.2% |
The ophthalmic sprays industry in South Korea is expected to reach a market size of USD 1.3 million by 2035, expanding at a CAGR of 8.2% during the forecast period. South Korean consumers are known for their preference for innovative and high-quality products in the beauty and healthcare sectors.
This trend extends to ophthalmic sprays, with a demand for advanced formulations, unique delivery systems, and high-tech features that enhance efficacy and user experience. Manufacturers are responding by developing innovative sprays with features such as micro-droplet technology or multi-action formulas.
Platelet rich fibrin dominated the ophthalmic sprays industry with a market share of 71.3% in 2025. This segment captures a significant market share in 2025 due to its high efficiency combinations and expected appropriate results.
Ophthalmic sprays often contain prescription medications to ensure their controlled use. These medications may have specific dosage requirements, potential side effects, and interactions with other drugs. By requiring a prescription, healthcare professionals can monitor and manage the appropriate use of these medications.
The retail pharmacies segment dominated the ophthalmic sprays industry with a market share of 60.8% in 2025. Retail pharmacies are easily accessible to the general public. They are typically located in communities, shopping centers, or within larger healthcare facilities, making it convenient for individuals to fill their prescriptions.
This accessibility ensures that ophthalmic sprays are readily available to those in need. They manage inventory, restock supplies, and ensure the availability of various ophthalmic sprays prescribed by healthcare professionals.
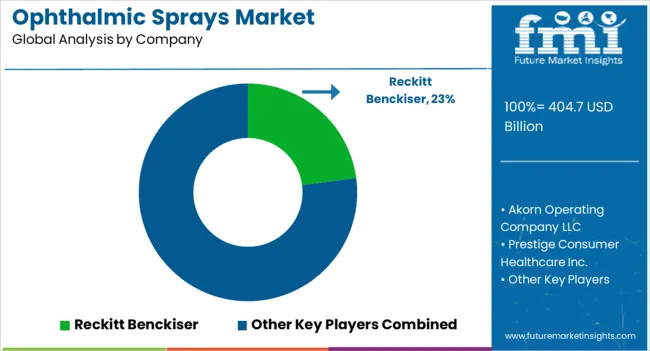
Ophthalmic Sprays sector is fiercely competitive, with many companies fighting for market dominance. To stay ahead of the competition in such a circumstance, essential players must employ smart techniques.
Key Strategies Used by the Participants
Companies invest heavily in R&D to deliver sprays of combination for ophthalmic purposes that improve efficiency, dependability, and cost-effectiveness. Product innovation allows businesses to differentiate themselves from their competition while also catering to the changing demands of their clients.
Key industry leaders frequently develop strategic partnerships and collaborations with other companies in order to harness their strengths and increase their market reach. Companies might also gain access to new technology and markets through such agreements.
Ophthalmic Sprays sector is expanding rapidly in emerging regions such as China and India. Key firms are enhancing their distribution networks and developing local manufacturing facilities to increase their presence in these areas.
Mergers and acquisitions are frequently used by key players in the ophthalmic sprays market to consolidate their market position, extend their product range, and gain access to new markets.
Key Developments in the Ophthalmic Sprays Market:
The global ophthalmic sprays market is estimated to be valued at USD 404.7 billion in 2025.
The market size for the ophthalmic sprays market is projected to reach USD 887.5 billion by 2035.
The ophthalmic sprays market is expected to grow at a 8.2% CAGR between 2025 and 2035.
The key product types in ophthalmic sprays market are rx prescription and otc prescription.
In terms of end user, hospital pharmacies segment to command 47.6% share in the ophthalmic sprays market in 2025.


Full Research Suite comprises of:
Market outlook & trends analysis
Interviews & case studies
Strategic recommendations
Vendor profiles & capabilities analysis
5-year forecasts
8 regions and 60+ country-level data splits
Market segment data splits
12 months of continuous data updates
DELIVERED AS:
PDF EXCEL ONLINE
Ophthalmic Drug Packaging Market Forecast and Outlook 2025 to 2035
Ophthalmic Surgical Market Size and Share Forecast Outlook 2025 to 2035
Ophthalmic Injectable Market Size and Share Forecast Outlook 2025 to 2035
Ophthalmic Diagnostic Equipment Market Analysis - Size, Share & Forecast 2025-2035
Ophthalmic Tonometers Market – Demand, Growth & Forecast 2025 to 2035
Ophthalmic Lasers Market Analysis - Innovations & Forecast 2024 to 2034
Global Ophthalmic Combination Product Market Analysis – Size, Share & Forecast 2024-2034
Ophthalmic Eye Drop Market – Trends & Forecast 2024-2034
Ophthalmic Knives Market
Ophthalmic Viscosurgical Devices Market
Herpes Zoster Ophthalmicus Market Size and Share Forecast Outlook 2025 to 2035
Excimer and Femtosecond Ophthalmic Lasers Market Size and Share Forecast Outlook 2025 to 2035
Nasal Sprays Market Analysis - Size, Share, and Forecast 2025 to 2035
Dermal Sprays Market Size and Share Forecast Outlook 2025 to 2035
Throat Sprays Market Analysis - Size, Share & Forecast 2025 to 2035
Steroid-Free Nasal Sprays Market Insights - Trends & Forecast 2025 to 2035
Medical Nitroglycerin Sprays Market - Demand, Innovations & Forecast 2025 to 2035

Thank you!
You will receive an email from our Business Development Manager. Please be sure to check your SPAM/JUNK folder too.
Chat With
MaRIA