Reports

- Global Locations -

Headquarters

Future Market Insights, Inc.

Christiana Corporate, 200
Continental Drive, Suite 401,
Newark, Delaware - 19713,
United States

T: +1-845-579-5705

Americas

Future Market Insights, Inc.

616 Corporate Way, Suite 2-9018,
Valley Cottage, NY 10989, United States

T: +1-347-918-3531

MEA

Future Market Insights

1602-6 Jumeirah Bay X2 Tower, Plot No: JLT-PH2-X2A,
Jumeirah Lakes Towers, Dubai,
United Arab Emirates

Europe

Future Market Insights

3rd Floor, 207 Regent Street,
W1B 3HH London
United Kingdom

T: + 44 (0) 20 8123 9659
D: +44 (0) 20 3287 4268

Asia Pacific

Future Market Insights

IndiaLand Global Tech Park, Unit UG-1, Behind Grand HighStreet, Phase 1, Hinjawadi, MH, Pune – 411057, India

Ophthalmic Surgical Market Outlook from 2024 to 2034

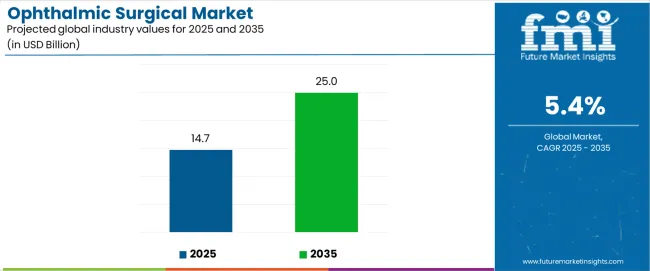
The global ophthalmic surgical market is expected to grow at a CAGR of 5.7% from 2024 to 2034. The market value is projected to increase from US$ 13,937.8 million in 2024 to US$ 24,194.2 million by 2034.

Attributes Key Insights
Base Value, 2023 US$ 13,159.7 million
Estimated Global Ophthalmic Surgical Market Size (2024E) US$ 13,937.8 million
Projected Ophthalmic Surgical Market Value (2034F) US$ 24,194.2 million
Value-based CAGR (2024 to 2034) 5.7%

The increasing frequency of retinal detachment, corneal transplants, and LASIK-laser refraction supports the ophthalmic surgical market expansion. Treating several ophthalmic conditions such as cataracts, glaucoma, diabetic retinopathy, macular degeneration, and vitrectomy requires surgery, which is expected to promote the market’s growth.

Advancements in ocular technology, such as high-definition scans and three-dimensional imaging, enable precise operations. This discovery and innovation are expected to enhance patient outcomes and create excellent market expansion opportunities. The growing pipeline of advanced ophthalmic surgeries is projected to surge the demand for ophthalmic surgeries.

A key factor propelling the market expansion is the rising prevalence of eye illnesses worldwide. The ophthalmic surgical device market is expanding due to new product introductions and technical developments. Over the projected period, government measures to help visually impaired populations are also anticipated to boost market expansion.

Don't pay for what you don't need

Customize your report by selecting specific countries or regions and save 30%!

2019 to 2023 Global Ophthalmic Surgical Market Growth Outlook Vs. 2024 to 2034

The global ophthalmic surgical market recorded a historic CAGR of 5.3% from 2019 to 2023.

  • Phacoemulsification was introduced and quickly became popular, revolutionizing cataract surgery and resulting in shorter recovery periods, better results, and smaller incisions.
  • Laser technology was an important development in ocular surgery, especially in refractive correction treatments like LASIK (Laser-Assisted in Situ Keratomileusis).
  • With fewer dangers and a faster recovery than traditional procedures, new possibilities for treating glaucoma have emerged with the development of minimally invasive glaucoma surgery (MIGS) methods.
  • With the creation of more compact gauge equipment and enhanced imaging technology, vitrectomy operations for retinal diseases have benefited from technical developments.
  • The introduction of anti-VEGF medications, among other pharmacological advancements, has revolutionized the treatment of diseases like age-related macular degeneration (AMD).

Opportunities in Ophthalmic Surgical Market

  • The market for ophthalmic surgery is expected to rise due to the expanding scope and accessibility of insurance coverage. This trend is set to lower financial barriers and encourage individuals to seek preventative eye care, increasing patient base and driving innovation.
  • Technological developments in ophthalmic surgery, like 3D imaging and high-resolution scans, provide accurate procedures that minimize risks. In addition to improving patient outcomes, this discovery opens up profitable doors for market growth and innovation.
Sabyasachi Ghosh
Sabyasachi Ghosh

Principal Consultant

Talk to Analyst

Find your sweet spots for generating winning opportunities in this market.

Key Ophthalmic Surgical Market Trends

  • The field of ophthalmic surgery has benefited from ongoing technological developments, such as the application of robots, artificial intelligence, and sophisticated imaging methods. These technologies aim to enhance patient recovery, surgical accuracy, and results.
  • There is a rising tendency toward minimally invasive techniques in ocular surgery. With shorter recovery periods and fewer dangers than conventional methods, techniques such as minimally invasive glaucoma surgery (MIGS) and laser-assisted cataract surgery are gaining traction.
  • Age-related macular degeneration (AMD), cataracts, and glaucoma are among the eye ailments that are becoming more commonplace worldwide. As more people seek treatment for these problems, the market for ophthalmic surgeries is surging.

Restraining Factors for the Ophthalmic Surgical Market

  • Regulatory policies restrict the market for ophthalmic surgery because of their rigid approval procedures and varied international regulations. These elements are set to raise costs, limit growth, and hinder timely market entry.
  • In certain areas, key barriers are expected to result from restricted access to healthcare treatments, such as eye procedures. This is because of poor infrastructure, a need for qualified ophthalmic surgeons, or physical obstacles that prevent patients from getting to hospitals.
  • Advanced eye procedures require specific knowledge and experience. One constraint is the need for qualified ophthalmic surgeons or the time and money to train medical practitioners in these methods.

Get the data you need at a Fraction of the cost

Personalize your report by choosing insights you need
and save 40%!

Comparative View of Adjacent Ophthalmic Surgical Markets

The peer or tangential markets in the healthcare division will likely impact the ophthalmic surgical market. These include other types of markets, such as the cataract surgery device and lung cancer surgery industries. Examining the provided table, it becomes evident that from 2024 to 2034, the lung cancer surgery market is set to record higher CAGRs than the other two markets.

Ophthalmic Surgical Market:

Attributes Ophthalmic Surgical Market
CAGR (2024 to 2034) 5.7%
Growth Factor Preoperative planning, diagnosis, and intraoperative decision assistance are the key areas where AI integration in ophthalmic surgery is set to improve surgical accuracy and productivity.
Key Trends By enhancing knowledge of several surgical choices and investing in patient education & awareness campaigns, manufacturers are expected to decrease reluctance and boost market share.

Cataract Surgery Device Market:

Attributes Cataract Surgery Device Market
CAGR (2024 to 2034) 5%
Growth Factor The increasing use of premium IOLs and EDOF lenses is a result of patient demand for less dependency on glasses following surgery. Better visual results and a decreased need for glasses following cataract surgery are the goals of these lenses.
Key Trends Novel technologies for cataract surgery are being developed as a result of ongoing technological breakthroughs. This includes advancements in femtosecond lasers, sophisticated intraocular lenses (IOLs), and phacoemulsification equipment.

Lung Cancer Surgery Market:

Attributes Lung Cancer Surgery Market
CAGR (2024 to 2034) 6.1%
Growth Factor Lung cancer surgery is seeing a rise in the use of Enhanced Recovery After Surgery (ERAS) protocols, which emphasize a multidisciplinary approach to maximize preoperative, intraoperative, and postoperative care.
Key Trends For the treatment of lung cancer, minimally invasive techniques like robotic-assisted surgery and video-assisted thoracic surgery (VATS) are gaining traction. Compared to typical open operations, these methods frequently lead to shorter hospital stays, quicker recovery periods, and less discomfort following surgery.

Country-wise Insights

The table below shows the estimated growth rates of the top five countries. The United States, Japan, and Germany are set to record high CAGRs of 8.3%, 8.1%, and 7.7%, respectively, through 2034.

Country Value CAGR
United States 8.3%
Japan 8.1%
China 7.1%
Germany 7.7%
United Kingdom 7.3%

The United States to Remain at the Epicentre of Ophthalmic Surgical Market

The United States is expected to exhibit a CAGR of 8.3% throughout the forecast period. Top factors supporting the market expansion in the country include:

  • Several insurance companies in the United States provide insurance claims for ophthalmic surgeries.
  • Rising awareness among individuals regarding ophthalmic conditions and surgeries increases the consumption of ophthalmic surgical products.
  • The market is influenced by patient preferences for surgical procedures that provide a shorter recovery and less dependence on visual assistance.

Booming Healthcare Sector to Boost Sales of Ophthalmic Surgical in Japan

Japan is expected to expand with a CAGR of 8.1% through 2034. This is attributable to a combination of factors, including:

  • Japan's stable economy creates an ideal framework for healthcare investments.
  • By encouraging research, development, and innovative surgical techniques, this stability is set to aid in expanding the ophthalmic surgical market.

China Be the Next-door Opportunity for the Ophthalmic Surgical Market

China is expected to grow at a CAGR of 7.1% during the forecast period. The key factors supporting the ophthalmic surgical market growth are:

  • China's fast urbanization is resulting in longer screen time and more environmental exposure.
  • The increased prevalence of eye conditions brought forth by these changes is increasing the need for ophthalmic surgical procedures.
  • The increasing prevalence of age-related eye complications is pushing the need for ocular surgeries, including glaucoma treatment and cataract surgery.

Growing Aging Population in Germany to Spur Market Growth

Sales of ophthalmic surgery in Germany are estimated to record a CAGR of 7.7% through 2034. The primary factors bolstering the ophthalmic surgical market size are:

  • The size of the ophthalmic surgery market in Germany is substantial and constantly expanding. The aging population, rising frequency of eye conditions, and improvements in surgical technology are influencing this trend.
  • Rapid technical breakthroughs, such as using femtosecond lasers in cataract & refractive surgery and adopting sophisticated imaging systems for diagnostic & surgical planning, are characteristics of the ophthalmic surgical market.

Presence of Local and Foreign Firms in the United Kingdom to Propel Sales

The United Kingdom is predicted to register a compound annual growth rate of 7.3% during the forecast period.

  • Changes in insurance coverage, reimbursement schemes, and healthcare regulations are expected to influence the adoption of ophthalmic surgical treatments in the United Kingdom.
  • Leading players in the United Kingdom frequently participate in research & development to launch novel technology and obtain a competitive advantage.

Category-wise Insights

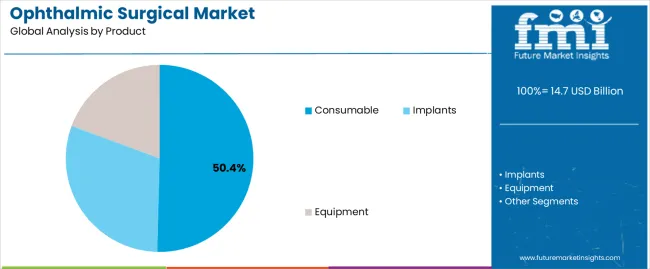
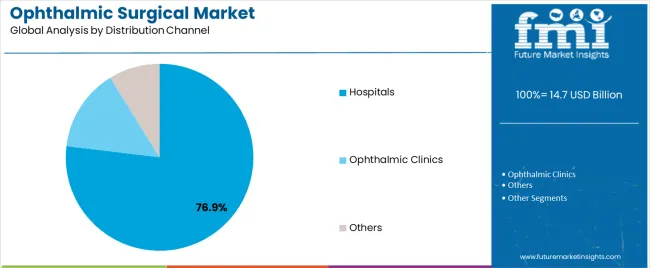
The section below shows the consumable segment dominating by product type. It is predicted to surge at a CAGR of 5.3% by 2034. Based on the distribution channel, the ophthalmic clinics segment is anticipated to generate a dominant share through 2024. It is set to rise at a 5.3% CAGR by 2034.

Segment Value CAGR
Consumable (Product Type) 5.3%
Ophthalmic Clinics (Distribution Channel) 5.3%

Consumable to be the Most Sought-after Product Type in the Market

The market value of consumables in ophthalmic surgery is US$ 6,225.6 million, representing a 50.0% market share in 2023.

  • Due to their integral role in surgery, consumables such as silicon bands, disposable drapes, and eye pads hold a significant market share in ophthalmic surgery.
  • The recurrent demand for single-use items that are used in several surgical procedures contributes to their high market prominence.

Adoption of Ophthalmic Surgical in Ophthalmic Clinics to Surge Through 2034

Ophthalmic clinics accounted for 54.2% of the share in terms of distribution channels in 2023 and are expected to surge at a CAGR of 5.3% over the forecast period.
  • Ophthalmology clinics house specialized ocular surgeons with training in several surgical methods.
  • Leading ophthalmology clinics invest in cutting-edge technology & surgical instruments to improve surgical accuracy and results. This includes applying advanced technology, such as femtosecond lasers and sophisticated imaging systems.
  • Ophthalmic clinics have a role in patient education and consultation. Surgeons advise patients about procedures, possible dangers, and expected results when discussing treatment choices, including surgical treatments.

Competitive Landscape

Collaborations and acquisitions are common strategies companies employ in the ophthalmic surgical market to enhance their capabilities, expand their offerings, and stay competitive in the market's dynamic landscape.

Leading players in the ophthalmic surgical market collaborate and form partnerships more often to take advantage of complementary skills, encourage innovation, and expand their product lines.

For instance:

  • In December 2023, Carl Zeiss Meditec AG acquired the Dutch Ophthalmic Research Center (D.O.R.C.).
  • In July 2023, Vantage Surgical Solutions, a prominent supplier of mobilized surgical solutions, acquired the Kansas-based firm called Ophthalmic Surgical Solutions (OSS).
  • In April 2022, Carl Zeiss Meditec acquired two surgical instrument makers, Kogent Surgical, LLC, and Katalyst Surgical, LLC.

Key Companies Profiled

  • Johnson & Johnson
  • Alcon Inc.
  • Ziemer Ophthalmic Systems AG
  • Bausch Health (Bausch & Lomb Incorporated)
  • Carl-Zeiss-Stiftung (Carl Zeiss AG)
  • Alcon Inc.
  • Clareon
  • Hydrus Microstent
  • Centurion
  • Constellation
  • SmartCataract
  • Abbott Medical Optics
  • Hoya Corporation
  • Johnson & Johnson
  • Canon Inc.
  • FCI Ophthalmic
  • Appasammy Associates
  • Corza Medical
  • Topcon Corporation
  • Coburn Technologies
  • Lumenis
  • Visionix
  • Glaukos Corporation

Ophthalmic Surgical Market Segmentation by Category

By Product:

  • Implants
  • Consumable
  • Equipment

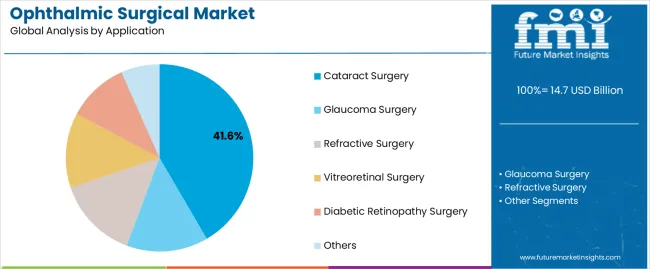
By Application:

  • Cataract Surgery
  • Glaucoma Surgery
  • Refractive Surgery
  • Vitreoretinal Surgery
  • Diabetic Retinopathy Surgery
  • Others

By Distribution Channel:

  • Hospitals
  • Ophthalmic Clinics
  • Others

By Region:

  • North America
  • Latin America
  • East Asia
  • South Asia and Pacific
  • Western Europe
  • Eastern Europe
  • Middle East and Africa

Frequently Asked Questions

How big is the ophthalmic surgical market?

The market is set to reach US$ 13,937.8 million in 2024.

What is the forecast for the ophthalmic surgical market?

Demand for ophthalmic surgery is slated to expand at a 5.7% CAGR by 2034.

What is the outlook for the ophthalmic surgical market?

The market is set to reach US$ 24,194.2 million in 2034.

Who are the key players in the ophthalmic surgical market sphere?

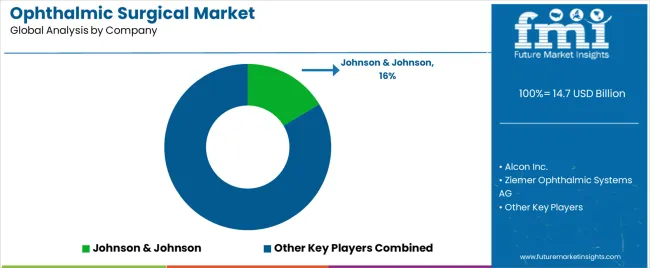
Johnson & Johnson, Alcon Inc., and Ziemer Ophthalmic Systems AG are the key players.

Which product would lead the ophthalmic surgical market?

Consumable segment is estimated to hold a market share of 50.0% in 2024.

Table of Content

1. Executive Summary

    1.1. Global Market Outlook

    1.2. Demand Side Trends

    1.3. Supply-Side Trends

    1.4. Analysis and Recommendations

2. Market Overview

    2.1. Market Coverage / Taxonomy

    2.2. Market Definition / Scope / Limitations

    2.3. Inclusions and Exclusions

3. Key Market Trends

    3.1. Key Trends Impacting the Market

    3.2. Development/Innovation Trends

4. Value-Added Insights

    4.1. Product Assessment

        4.1.1. Product Adoption/Usage Analysis-By Region

        4.1.2. Company V/S Product Matrix

        4.1.3. Recent Product Launches

    4.2. Technology Assessment

    4.3. Disease Epidemiology, By Key Countries

    4.4. Regulatory Scenario

        4.4.1. Regulatory Frameworks in United States

        4.4.2. Regulatory Frameworks in Canada

        4.4.3. Regulatory Frameworks in Europe

        4.4.4. Regulatory Frameworks in Brazil

        4.4.5. Regulatory Frameworks in China

        4.4.6. Regulatory Frameworks in Japan

        4.4.7. Regulatory Frameworks in India

        4.4.8. Regulatory Frameworks in Australia

    4.5. PESTEL Analysis

    4.6. Porter’s Analysis

    4.7. Value Chain Analysis

    4.8. Unmet Needs and Opportunities

5. Market Background

    5.1. Macro-Economic Factors

        5.1.1. Global Healthcare Expenditure

        5.1.2. Global Medical Devices Market Outlook

        5.1.3. Research and Development funding by Region

        5.1.4. Research and Development funding by Country

        5.1.5. Global Ophthalmic Devices Market Outlook (Parent market)

    5.2. Forecast Factors - Relevance and Impact

        5.2.1. Technological Advancements

        5.2.2. Increasing Incidence of Eye Disorders

        5.2.3. Global Healthcare Expenditure

        5.2.4. Changes in regulatory policies

        5.2.5. Patient Preferences and Awareness

        5.2.6. Collaborations between healthcare institutions

        5.2.7. The availability and extent of insurance coverage

        5.2.8. Rising demand for eye surgeries

    5.3. Market Dynamics

        5.3.1. Drivers

        5.3.2. Restraints

        5.3.3. Opportunity Analysis

6. Global Market Demand (in Value or Size in US$ million) Analysis 2019 to 2023 and Forecast, 2024 to 2034

    6.1. Historical Market Value (US$ million) Analysis, 2019 to 2023

    6.2. Current and Future Market Value (US$ million) Projections, 2024 to 2034

        6.2.1. Y-o-Y Growth Trend Analysis

        6.2.2. Absolute $ Opportunity Analysis

7. Global Market Analysis 2019 to 2023 and Forecast 2024 to 2034, By Product

    7.1. Findings

    7.2. Historical Market Size (US$ million) By Product, 2019 to 2023

    7.3. Current and Future Market Size (US$ million) Analysis and Forecast By Product, 2024 to 2034

        7.3.1. Implants

        7.3.2. Consumable

        7.3.3. Equipment

    7.4. Market Attractiveness Analysis By Product

8. Global Market Analysis 2019 to 2023 and Forecast 2024 to 2034, By Application

    8.1. Introduction / Key Findings

    8.2. Historical Market Size (US$ million) By Application, 2019 to 2023

    8.3. Current and Future Market Size (US$ million) Analysis and Forecast By Application, 2024 to 2034

        8.3.1. Cataract Surgery

        8.3.2. Glaucoma Surgery

        8.3.3. Refractive Surgery

        8.3.4. Vitreoretinal Surgery

        8.3.5. Diabetic Retinopathy Surgery

        8.3.6. Others

    8.4. Market Attractiveness Analysis By Application

9. Global Market Analysis 2019 to 2023 and Forecast 2024 to 2034, By Distribution Channel

    9.1. Introduction / Key Findings

    9.2. Historical Market Size (US$ million) By Distribution Channel, 2019 to 2023

    9.3. Current and Future Market Size (US$ million) Analysis and Forecast By Distribution Channel, 2024 to 2034

        9.3.1. Hospitals

        9.3.2. Ophthalmic Clinics

        9.3.3. Others

    9.4. Market Attractiveness Analysis By Distribution Channel

10. Global Market Analysis 2019 to 2023 and Forecast 2024 to 2034, By Region

    10.1. Introduction / Key Findings

    10.2. Historical Market Size (US$ million) Trend Analysis by Region, 2019 to 2023

    10.3. Current and Future Market Size (US$ million) Analysis and Forecast by Region, 2022–2032

        10.3.1. North America

        10.3.2. Latin America

        10.3.3. East Asia

        10.3.4. South Asia & Pacific

        10.3.5. Western Europe

        10.3.6. Eastern Europe

        10.3.7. Middle East & Africa

    10.4. Market Attractiveness Analysis by Region

11. North America Market Analysis 2019 to 2023 and Forecast 2024 to 2034

    11.1. Introduction

    11.2. Historical Market Size (US$ million) Trend Analysis by Market Taxonomy, 2019 to 2023

    11.3. Current and Future Market Size (US$ million) Analysis and Forecast by Market Taxonomy, 2024 to 2034

        11.3.1. By Country

            11.3.1.1. United States

            11.3.1.2. Canada

            11.3.1.3. Mexico

        11.3.2. By Product

        11.3.3. By Application

        11.3.4. By Distribution Channel

    11.4. Market Attractiveness Analysis

        11.4.1. By Country

        11.4.2. By Product

        11.4.3. By Application

        11.4.4. By Distribution Channel

    11.5. Market Trends

    11.6. Drivers & Restraints Impact Analysis

    11.7. Key Market Players Intensity Mapping

    11.8. Country-Wise Analysis

        11.8.1. United States Market Analysis

            11.8.1.1. Introduction

            11.8.1.2. Market Analysis and Forecast by Market Taxonomy

                11.8.1.2.1. By Product

                11.8.1.2.2. By Application

                11.8.1.2.3. By Distribution Channel

        11.8.2. Canada Market Analysis

            11.8.2.1. Introduction

            11.8.2.2. Market Analysis and Forecast by Market Taxonomy

                11.8.2.2.1. By Product

                11.8.2.2.2. By Application

                11.8.2.2.3. By Distribution Channel

        11.8.3. Mexico Market Analysis

            11.8.3.1. Introduction

            11.8.3.2. Market Analysis and Forecast by Market Taxonomy

                11.8.3.2.1. By Product

                11.8.3.2.2. By Application

                11.8.3.2.3. By Distribution Channel

12. Latin America Market Analysis 2019 to 2023 and Forecast 2024 to 2034

    12.1. Introduction

    12.2. Historical Market Size (US$ million) Trend Analysis by Market Taxonomy, 2019 to 2023

    12.3. Current and Future Market Size (US$ million) Analysis and Forecast by Market Taxonomy, 2024 to 2034

        12.3.1. By Country

            12.3.1.1. Brazil

            12.3.1.2. Chile

            12.3.1.3. Rest of Latin America

        12.3.2. By Product

        12.3.3. By Application

        12.3.4. By Distribution Channel

    12.4. Market Attractiveness Analysis

        12.4.1. By Country

        12.4.2. By Product

        12.4.3. By Application

        12.4.4. By Distribution Channel

    12.5. Market Trends

    12.6. Drivers & Restraints Impact Analysis

    12.7. Key Market Players Intensity Mapping

    12.8. Country-Wise Analysis

        12.8.1. Brazil Market Analysis

            12.8.1.1. Introduction

            12.8.1.2. Market Analysis and Forecast by Market Taxonomy

                12.8.1.2.1. By Product

                12.8.1.2.2. By Application

                12.8.1.2.3. By Distribution Channel

        12.8.2. Chile Market Analysis

            12.8.2.1. Introduction

            12.8.2.2. Market Analysis and Forecast by Market Taxonomy

                12.8.2.2.1. By Product

                12.8.2.2.2. By Application

                12.8.2.2.3. By Distribution Channel

13. East Asia Market Analysis 2019 to 2023 and Forecast 2024 to 2034

    13.1. Introduction

    13.2. Historical Market Size (US$ million) Trend Analysis by Market Taxonomy, 2019 to 2023

    13.3. Current and Future Market Size (US$ million) Analysis and Forecast by Market Taxonomy, 2024 to 2034

        13.3.1. By Country

            13.3.1.1. China

            13.3.1.2. Japan

            13.3.1.3. South Korea

        13.3.2. By Product

        13.3.3. By Application

        13.3.4. By Distribution Channel

    13.4. Market Attractiveness Analysis

        13.4.1. By Country

        13.4.2. By Product

        13.4.3. By Application

        13.4.4. By Distribution Channel

    13.5. Market Trends

    13.6. Drivers & Restraints Impact Analysis

    13.7. Key Market Players Intensity Mapping

    13.8. Country-Wise Analysis

        13.8.1. China Market Analysis

            13.8.1.1. Introduction

            13.8.1.2. Market Analysis and Forecast by Market Taxonomy

                13.8.1.2.1. By Product

                13.8.1.2.2. By Application

                13.8.1.2.3. By Distribution Channel

        13.8.2. Japan Market Analysis

            13.8.2.1. Introduction

            13.8.2.2. Market Analysis and Forecast by Market Taxonomy

                13.8.2.2.1. By Product

                13.8.2.2.2. By Application

                13.8.2.2.3. By Distribution Channel

        13.8.3. South Korea Market Analysis

            13.8.3.1. Introduction

            13.8.3.2. Market Analysis and Forecast by Market Taxonomy

                13.8.3.2.1. By Product

                13.8.3.2.2. By Application

                13.8.3.2.3. By Distribution Channel

14. South Asia and Pacific Market Analysis 2019 to 2023 and Forecast 2024 to 2034

    14.1. Introduction

    14.2. Historical Market Size (US$ million) Trend Analysis by Market Taxonomy, 2019 to 2023

    14.3. Current and Future Market Size (US$ million) Analysis and Forecast by Market Taxonomy, 2024 to 2034

        14.3.1. By Country

            14.3.1.1. India

            14.3.1.2. ASEAN Countries

            14.3.1.3. Australia and New Zealand

            14.3.1.4. Rest of South Asia

        14.3.2. By Product

        14.3.3. By Application

        14.3.4. By Distribution Channel

    14.4. Market Attractiveness Analysis

        14.4.1. By Country

        14.4.2. By Product

        14.4.3. By Application

        14.4.4. By Distribution Channel

    14.5. Market Trends

    14.6. Drivers & Restraints Impact Analysis

    14.7. Key Market Players Intensity Mapping

    14.8. Country-Wise Analysis

        14.8.1. India Market Analysis

            14.8.1.1. Introduction

            14.8.1.2. Market Analysis and Forecast by Market Taxonomy

                14.8.1.2.1. By Product

                14.8.1.2.2. By Application

                14.8.1.2.3. By Distribution Channel

        14.8.2. ASEAN Countries Market Analysis

            14.8.2.1. Introduction

            14.8.2.2. Market Analysis and Forecast by Market Taxonomy

                14.8.2.2.1. By Product

                14.8.2.2.2. By Application

                14.8.2.2.3. By Distribution Channel

        14.8.3. Australia and New Zealand Market Analysis

            14.8.3.1. Introduction

            14.8.3.2. Market Analysis and Forecast by Market Taxonomy

                14.8.3.2.1. By Product

                14.8.3.2.2. By Application

                14.8.3.2.3. By Distribution Channel

15. Western Europe Market Analysis 2019 to 2023 and Forecast 2024 to 2034

    15.1. Introduction

    15.2. Historical Market Size (US$ million) Trend Analysis by Market Taxonomy, 2019 to 2023

    15.3. Current and Future Market Size (US$ million) Analysis and Forecast by Market Taxonomy, 2024 to 2034

        15.3.1. By Country

            15.3.1.1. Germany

            15.3.1.2. Italy

            15.3.1.3. France

            15.3.1.4. United Kingdom

            15.3.1.5. Spain

            15.3.1.6. BENELUX

            15.3.1.7. Nordic Countries

            15.3.1.8. Rest of Western Europe

        15.3.2. By Product

        15.3.3. By Application

        15.3.4. By Distribution Channel

    15.4. Market Attractiveness Analysis

        15.4.1. By Product

        15.4.2. By Application

        15.4.3. By Distribution Channel

    15.5. Market Trends

    15.6. Drivers & Restraints Impact Analysis

    15.7. Key Market Players Intensity Mapping

    15.8. Country-Wise Analysis

        15.8.1. Germany Market Analysis

            15.8.1.1. Introduction

            15.8.1.2. Market Analysis and Forecast by Market Taxonomy

                15.8.1.2.1. By Product

                15.8.1.2.2. By Application

                15.8.1.2.3. By Distribution Channel

        15.8.2. Italy Market Analysis

            15.8.2.1. Introduction

            15.8.2.2. Market Analysis and Forecast by Market Taxonomy

                15.8.2.2.1. By Product

                15.8.2.2.2. By Application

                15.8.2.2.3. By Distribution Channel

        15.8.3. France Market Analysis

            15.8.3.1. Introduction

            15.8.3.2. Market Analysis and Forecast by Market Taxonomy

                15.8.3.2.1. By Product

                15.8.3.2.2. By Application

                15.8.3.2.3. By Distribution Channel

        15.8.4. United Kingdom Market Analysis

            15.8.4.1. Introduction

            15.8.4.2. Market Analysis and Forecast by Market Taxonomy

                15.8.4.2.1. By Product

                15.8.4.2.2. By Application

                15.8.4.2.3. By Distribution Channel

        15.8.5. Spain Market Analysis

            15.8.5.1. Introduction

            15.8.5.2. Market Analysis and Forecast by Market Taxonomy

                15.8.5.2.1. By Product

                15.8.5.2.2. By Application

                15.8.5.2.3. By Distribution Channel

        15.8.6. BENELUX Market Analysis

            15.8.6.1. Introduction

            15.8.6.2. Market Analysis and Forecast by Market Taxonomy

                15.8.6.2.1. By Product

                15.8.6.2.2. By Application

                15.8.6.2.3. By Distribution Channel

        15.8.7. Nordic Countries Market Analysis

            15.8.7.1. Introduction

            15.8.7.2. Market Analysis and Forecast by Market Taxonomy

                15.8.7.2.1. By Product

                15.8.7.2.2. By Application

                15.8.7.2.3. By Distribution Channel

16. Eastern Europe Market Analysis 2019 to 2023 and Forecast 2024 to 2034

    16.1. Introduction

    16.2. Historical Market Size (US$ million) Trend Analysis by Market Taxonomy, 2019 to 2023

    16.3. Current and Future Market Size (US$ million) Analysis and Forecast by Market Taxonomy, 2024 to 2034

        16.3.1. By Country

            16.3.1.1. Poland

            16.3.1.2. Hungary

            16.3.1.3. Russia

            16.3.1.4. Rest of Eastern Europe

        16.3.2. By Product

        16.3.3. By Application

        16.3.4. By Distribution Channel

    16.4. Market Attractiveness Analysis

        16.4.1. By Country

        16.4.2. By Product

        16.4.3. By Application

        16.4.4. By Distribution Channel

    16.5. Market Trends

    16.6. Drivers & Restraints Impact Analysis

    16.7. Key Market Players Intensity Mapping

    16.8. Country-Wise Analysis

        16.8.1. Poland Market Analysis

            16.8.1.1. Introduction

            16.8.1.2. Market Analysis and Forecast by Market Taxonomy

                16.8.1.2.1. By Product

                16.8.1.2.2. By Application

                16.8.1.2.3. By Distribution Channel

        16.8.2. Hungary Market Analysis

            16.8.2.1. Introduction

            16.8.2.2. Market Analysis and Forecast by Market Taxonomy

                16.8.2.2.1. By Product

                16.8.2.2.2. By Application

                16.8.2.2.3. By Distribution Channel

        16.8.3. Russia Market Analysis

            16.8.3.1. Introduction

            16.8.3.2. Market Analysis and Forecast by Market Taxonomy

                16.8.3.2.1. By Product

                16.8.3.2.2. By Application

                16.8.3.2.3. By Distribution Channel

17. Middle East and Africa Market Analysis 2019 to 2023 and Forecast 2024 to 2034

    17.1. Introduction

    17.2. Historical Market Size (US$ million) Trend Analysis by Market Taxonomy, 2019 to 2023

    17.3. Current and Future Market Size (US$ million) Analysis and Forecast by Market Taxonomy, 2024 to 2034

        17.3.1. By Country

            17.3.1.1. Saudi Arabia

            17.3.1.2. Türkiye

            17.3.1.3. South Africa

            17.3.1.4. Other African Union

            17.3.1.5. Rest of Middle East and Africa

        17.3.2. By Product

        17.3.3. By Application

        17.3.4. By Distribution Channel

    17.4. Market Attractiveness Analysis

        17.4.1. By Country

        17.4.2. By Product

        17.4.3. By Application

        17.4.4. By Distribution Channel

    17.5. Market Trends

    17.6. Drivers & Restraints Impact Analysis

    17.7. Key Market Players Intensity Mapping

    17.8. Country-Wise Analysis

        17.8.1. Saudi Arabia Market Analysis

            17.8.1.1. Introduction

            17.8.1.2. Market Analysis and Forecast by Market Taxonomy

                17.8.1.2.1. By Product

                17.8.1.2.2. By Application

                17.8.1.2.3. By Distribution Channel

        17.8.2. Türkiye Market Analysis

            17.8.2.1. Introduction

            17.8.2.2. Market Analysis and Forecast by Market Taxonomy

                17.8.2.2.1. By Product

                17.8.2.2.2. By Application

                17.8.2.2.3. By Distribution Channel

        17.8.3. South Africa Market Analysis

            17.8.3.1. Introduction

            17.8.3.2. Market Analysis and Forecast by Market Taxonomy

                17.8.3.2.1. By Product

                17.8.3.2.2. By Application

                17.8.3.2.3. By Distribution Channel

        17.8.4. Other African Union Market Analysis

            17.8.4.1. Introduction

            17.8.4.2. Market Analysis and Forecast by Market Taxonomy

                17.8.4.2.1. By Product

                17.8.4.2.2. By Application

                17.8.4.2.3. By Distribution Channel

18. Market Structure Analysis

    18.1. Market Analysis by Tier of Companies

    18.2. Market Share Analysis of Top Players (%)

    18.3. Market Presence Analysis

        18.3.1. Regional Footprint of Players

        18.3.2. Channel Foot Print by Players

19. Competition Analysis

    19.1. Competition Dashboard

    19.2. Branding and Promotional Strategies By Key Players

    19.3. Key Development Analysis

    19.4. Competition Deep Dive (Tentative List)

        19.4.1. Johnson & Johnson

            19.4.1.1. Overview

            19.4.1.2. Product Portfolio

            19.4.1.3. Key Financials

            19.4.1.4. SWOT Analysis

            19.4.1.5. Key Developments

            19.4.1.6. Sales Footprint

            19.4.1.7. Strategy Overview

                19.4.1.7.1. Marketing Strategy

                19.4.1.7.2. Product & Service Strategy

                19.4.1.7.3. Channel Strategy

        19.4.2. Alcon Inc.

        19.4.3. Ziemer Ophthalmic Systems AG

        19.4.4. Bausch Health (Bausch & Lomb Incorporated)

        19.4.5. Carl-Zeiss-Stiftung (Carl Zeiss AG)

        19.4.6. Centurion

        19.4.7. Hoya Corporation

        19.4.8. Canon Inc.

        19.4.9. FCI Ophthalmic

        19.4.10. Appasammy Associates

        19.4.11. Corza Medical

        19.4.12. Topcon Corporation

        19.4.13. Coburn Technologies

        19.4.14. Lumenis

        19.4.15. Visionix

        19.4.16. Glaukos Corporation

        19.4.17. Cooper Medical Ltd

        19.4.18. EssilorLuxottica

        19.4.19. Nidek Co., Ltd

        19.4.20. Staar Surgical

        19.4.21. Quantel Medical

20. Assumptions and Acronyms Used

21. Research Methodology

List of Tables

Table 01: Global Market Value (US$ million) Analysis and Forecast, by Product

Table 03: Global Market Value (US$ million) Analysis and Forecast 2019 to 2034, by Application

Table 04: Global Market Value (US$ million) Analysis and Forecast 2019 to 2034, by Distribution Channel

Table 05: Global Market Value (US$ million) Analysis and Forecast 2019 to 2034, by Region

Table 06: North America Market Value (US$ million) Analysis 2019 to 2023 and Forecast 2024 to 2034, by Country

Table 07: North America Market Value (US$ million) Analysis and Forecast 2019 to 2034, by Product

Table 08: North America Market Value (US$ million) Analysis and Forecast 2019 to 2034, by Application

Table 09: North America Market Value (US$ million) Analysis and Forecast 2019 to 2034, by Distribution Channel

Table 10: Latin America Market Value (US$ million) Analysis 2019 to 2023 and Forecast 2024 to 2034, by Country

Table 11: Latin America Market Value (US$ million) Analysis and Forecast 2019 to 2034, by Product

Table 12: Latin America Market Value (US$ million) Analysis and Forecast 2019 to 2034, by Application

Table 13: Latin America Market Value (US$ million) Analysis and Forecast 2019 to 2034, by Distribution Channel

Table 14: East Asia Market Value (US$ million) Analysis 2019 to 2023 and Forecast 2024 to 2034, by Country

Table 15: East Asia Market Value (US$ million) Analysis and Forecast 2019 to 2034, by Product

Table 16: East Asia Market Value (US$ million) Analysis and Forecast 2019 to 2034, by Application

Table 17: East Asia Market Value (US$ million) Analysis and Forecast 2019 to 2034, by Distribution Channel

Table 18: South Asia and Pacific Market Value (US$ million) Analysis 2019 to 2023 and Forecast 2024 to 2034, by Country

Table 19: South Asia and Pacific Market Value (US$ million) Analysis and Forecast 2019 to 2034, by Product

Table 20: South Asia and Pacific Market Value (US$ million) Analysis and Forecast 2019 to 2034, by Application

Table 21: South Asia and Pacific Market Value (US$ million) Analysis and Forecast 2019 to 2034, by Distribution Channel

Table 22: Western Europe Market Value (US$ million) Analysis 2019 to 2023 and Forecast 2024 to 2034, by Country

Table 23: Western Europe Market Value (US$ million) Analysis and Forecast 2019 to 2034, by Product

Table 24: Western Europe Market Value (US$ million) Analysis and Forecast 2019 to 2034, by Application

Table 25: Western Europe Market Value (US$ million) Analysis and Forecast 2019 to 2034, by Distribution Channel

Table 26: Eastern Europe Market Value (US$ million) Analysis 2019 to 2023 and Forecast 2024 to 2034, by Country

Table 27: Eastern Europe Market Value (US$ million) Analysis and Forecast 2019 to 2034, by Product

Table 28: Eastern Europe Market Value (US$ million) Analysis and Forecast 2019 to 2034, by Application

Table 29: Eastern Europe Market Value (US$ million) Analysis and Forecast 2019 to 2034, by Distribution Channel

Table 30: Middle East and Africa Market Value (US$ million) Analysis 2019 to 2023 and Forecast 2024 to 2034, by Country

Table 31: Middle East and Africa Market Value (US$ million) Analysis and Forecast 2019 to 2034, by Product

Table 32: Middle East and Africa Market Value (US$ million) Analysis and Forecast 2019 to 2034, by Application

Table 33: Middle East and Africa Market Value (US$ million) Analysis and Forecast 2019 to 2034, by Distribution Channel

List of Charts

Figure 1: Global Market Value (US$ million) Analysis, 2019 to 2023

Figure 2: Global Market Forecast and Y-o-Y Growth, 2024 to 2034

Figure 3: Global Market Absolute $ Opportunity (US$ million) Analysis, 2024 to 2034

Figure 4: Global Market Value Share (%) Analysis 2024 to 2034, by Product

Figure 5: Global Market Y-o-Y Growth (%) Analysis 2024 to 2034, by Product

Figure 6: Global Market Attractiveness Analysis 2024 to 2034, by Product

Figure 7: Global Market Value Share (%) Analysis 2024 to 2034, by Application

Figure 8: Global Market Y-o-Y Growth (%) Analysis 2024 to 2034, by Application

Figure 9: Global Market Attractiveness Analysis 2024 to 2034, by Application

Figure 10: Global Market Value Share (%) Analysis 2024 to 2034, by Distribution Channel

Figure 11: Global Market Y-o-Y Growth (%) Analysis 2024 to 2034, by Distribution Channel

Figure 12: Global Market Attractiveness Analysis 2024 to 2034, by Distribution Channel

Figure 13: Global Market Value Share (%) Analysis 2024 to 2034, by Region

Figure 14: Global Market Y-o-Y Growth (%) Analysis 2024 to 2034, by Region

Figure 15: Global Market Attractiveness Analysis 2024 to 2034, by Region

Figure 16: North America Market Value (US$ million) Analysis, 2019 to 2023

Figure 17: North America Market Value (US$ million) Forecast, 2024 to 2034

Figure 18: North America Market Value Share, by Product (2024 E)

Figure 19: North America Market Value Share, by Application (2024 E)

Figure 20: North America Market Value Share, by Distribution Channel (2024 E)

Figure 21: North America Market Value Share, by Country (2024 E)

Figure 22: North America Market Attractiveness Analysis by Product, 2024 to 2034

Figure 23: North America Market Attractiveness Analysis by Application, 2024 to 2034

Figure 24: North America Market Attractiveness Analysis by Distribution Channel, 2024 to 2034

Figure 25: North America Market Attractiveness Analysis by Country, 2024 to 2034

Figure 26: United States Market Value Proportion Analysis, 2023

Figure 27: Global Vs. the United States Growth Comparison, 2024 to 2034

Figure 28: United States Market Share Analysis (%) by Product, 2024 to 2034

Figure 29: United States Market Share Analysis (%) by Application, 2024 to 2034

Figure 30: United States Market Share Analysis (%) by Distribution Channel, 2024 to 2034

Figure 31: Canada Market Value Proportion Analysis, 2023

Figure 32: Global Vs. Canada. Growth Comparison, 2024 to 2034

Figure 33: Canada Market Share Analysis (%) by Product, 2024 and 2034

Figure 34: Canada Market Share Analysis (%) by Application, 2024 to 2034

Figure 35: Canada Market Share Analysis (%) by Distribution Channel, 2024 to 2034

Figure 36: Mexico Market Value Proportion Analysis, 2023

Figure 37: Global Vs. Mexico Growth Comparison, 2024 to 2034

Figure 38: Mexico Market Share Analysis (%) by Product, 2024 to 2034

Figure 39: Mexico Market Share Analysis (%) by Application, 2024 to 2034

Figure 40: Mexico Market Share Analysis (%) by Distribution Channel, 2024 to 2034

Figure 41: Latin America Market Value (US$ million) Analysis, 2019 to 2023

Figure 42: Latin America Market Value (US$ million) Forecast, 2024 to 2034

Figure 43: Latin America Market Value Share, by Product (2024 E)

Figure 44: Latin America Market Value Share, by Application (2024 E)

Figure 45: Latin America Market Value Share, by Distribution Channel (2024 E)

Figure 46: Latin America Market Value Share, by Country (2024 E)

Figure 47: Latin America Market Attractiveness Analysis by Product, 2024 to 2034

Figure 48: Latin America Market Attractiveness Analysis by Application, 2024 to 2034

Figure 49: Latin America Market Attractiveness Analysis by Distribution Channel, 2024 to 2034

Figure 50: Latin America Market Attractiveness Analysis by Country, 2024 to 2034

Figure 51: Brazil Market Value Proportion Analysis, 2023

Figure 52: Global Vs. Brazil. Growth Comparison, 2024 to 2034

Figure 53: Brazil Market Share Analysis (%) by Product, 2024 to 2034

Figure 54: Brazil Market Share Analysis (%) by Application, 2024 to 2034

Figure 55: Brazil Market Share Analysis (%) by Distribution Channel, 2024 to 2034

Figure 56: Chile Market Value Proportion Analysis, 2023

Figure 57: Global Vs. Chile Growth Comparison, 2024 to 2034

Figure 58: Chile Market Share Analysis (%) by Product, 2024 to 2034

Figure 59: Chile Market Share Analysis (%) by Application, 2024 to 2034

Figure 60: Chile Market Share Analysis (%) by Distribution Channel, 2024 to 2034

Figure 61: East Asia Market Value (US$ million) Analysis, 2019 to 2023

Figure 62: East Asia Market Value (US$ million) Forecast, 2024 to 2034

Figure 63: East Asia Market Value Share, by Product (2024 E)

Figure 64: East Asia Market Value Share, by Application (2024 E)

Figure 65: East Asia Market Value Share, by Distribution Channel (2024 E)

Figure 66: East Asia Market Value Share, by Country (2024 E)

Figure 67: East Asia Market Attractiveness Analysis by Product, 2024 to 2034

Figure 68: East Asia Market Attractiveness Analysis by Application, 2024 to 2034

Figure 69: East Asia Market Attractiveness Analysis by Distribution Channel, 2024 to 2034

Figure 70: East Asia Market Attractiveness Analysis by Country, 2024 to 2034

Figure 71: China Market Value Proportion Analysis, 2023

Figure 72: Global Vs. China Growth Comparison, 2024 to 2034

Figure 73: China Market Share Analysis (%) by Product, 2024 to 2034

Figure 74: China Market Share Analysis (%) by Application, 2024 to 2034

Figure 75: China Market Share Analysis (%) by Distribution Channel, 2024 to 2034

Figure 76: Japan Market Value Proportion Analysis, 2023

Figure 77: Global Vs. Japan Growth Comparison, 2024 to 2034

Figure 78: Japan Market Share Analysis (%) by Product, 2024 to 2034

Figure 79: Japan Market Share Analysis (%) by Application, 2024 to 2034

Figure 80: Japan Market Share Analysis (%) by Distribution Channel, 2024 to 2034

Figure 81: South Korea Market Value Proportion Analysis, 2023

Figure 82: Global Vs. South Korea Growth Comparison, 2024 to 2034

Figure 83: South Korea Market Share Analysis (%) by Product, 2024 to 2034

Figure 84: South Korea Market Share Analysis (%) by Application, 2024 to 2034

Figure 85: South Korea Market Share Analysis (%) by Distribution Channel, 2024 to 2034

Figure 86: South Asia and Pacific Market Value (US$ million) Analysis, 2019 to 2023

Figure 87: South Asia and Pacific Market Value (US$ million) Forecast, 2024 to 2034

Figure 88: South Asia and Pacific Market Value Share, by Product (2024 E)

Figure 89: South Asia and Pacific Market Value Share, by Application (2024E)

Figure 90: South Asia and Pacific Market Value Share, by Distribution Channel (2024 E)

Figure 91: South Asia and Pacific Market Value Share, by Country (2024 E)

Figure 92: South Asia and Pacific Market Attractiveness Analysis by Product, 2024 to 2034

Figure 93: South Asia and Pacific Market Attractiveness Analysis by Application, 2024 to 2034

Figure 94: South Asia and Pacific Market Attractiveness Analysis by Distribution Channel, 2024 to 2034

Figure 95: South Asia and Pacific Market Attractiveness Analysis by Country, 2024 to 2034

Figure 96: India Market Value Proportion Analysis, 2023

Figure 97: Global Vs. India Growth Comparison, 2024 to 2034

Figure 98: India Market Share Analysis (%) by Product, 2024 to 2034

Figure 99: India Market Share Analysis (%) by Application, 2024 to 2034

Figure 100: India Market Share Analysis (%) by Distribution Channel, 2024 to 2034

Figure 101: ASEAN Countries Market Value Proportion Analysis, 2023

Figure 102: Global Vs. ASEAN Countries Growth Comparison, 2024 to 2034

Figure 103: ASEAN Countries Market Share Analysis (%) by Product, 2024 to 2034

Figure 104: ASEAN Countries Market Share Analysis (%) by Application, 2024 to 2034

Figure 105: ASEAN Countries Market Share Analysis (%) by Distribution Channel, 2024 to 2034

Figure 106: Australia and New Zealand Market Value Proportion Analysis, 2023

Figure 107: Global Vs. Australia and New Zealand Growth Comparison, 2024 to 2034

Figure 108: Australia and New Zealand Market Share Analysis (%) by Product, 2023 and2034

Figure 109: Australia and New Zealand Market Share Analysis (%) by Application, 2024 to 2034

Figure 110: Australia and New Zealand Market Share Analysis (%) by Distribution Channel, 2023 and2034

Figure 111: Western Europe Market Value (US$ million) Analysis, 2019 to 2023

Figure 112: Western Europe Market Value (US$ million) Forecast, 2024 to 2034

Figure 113: Western Europe Market Value Share, by Product (2024 E)

Figure 114: Western Europe Market Value Share, by Application (2024 E)

Figure 115: Western Europe Market Value Share, by Distribution Channel (2024 E)

Figure 116: Western Europe Market Value Share, by Country (2024 E)

Figure 117: Western Europe Market Attractiveness Analysis by Product, 2024 to 2034

Figure 118: Western Europe Market Attractiveness Analysis by Application, 2024 to 2034

Figure 119: Western Europe Market Attractiveness Analysis by Distribution Channel, 2024 to 2034

Figure 120: Western Europe Market Attractiveness Analysis by Country, 2024 to 2034

Figure 121: United Kingdom Market Value Proportion Analysis, 2023

Figure 122: Global Vs. United Kingdom Growth Comparison, 2024 to 2034

Figure 123: United Kingdom Market Share Analysis (%) by Product, 2024 to 2034

Figure 124: United Kingdom Market Share Analysis (%) by Application, 2024 to 2034

Figure 125: United Kingdom Market Share Analysis (%) by Distribution Channel, 2024 to 2034

Figure 126: Germany Market Value Proportion Analysis, 2023

Figure 127: Global Vs. Germany Growth Comparison, 2024 to 2034

Figure 128: Germany Market Share Analysis (%) by Product, 2024 to 2034

Figure 129: Germany Market Share Analysis (%) by Application, 2024 to 2034

Figure 130: Germany Market Share Analysis (%) by Distribution Channel, 2024 to 2034

Figure 131: Italy Market Value Proportion Analysis, 2023

Figure 132: Global Vs. Italy Growth Comparison, 2024 to 2034

Figure 133: Italy Market Share Analysis (%) by Product, 2024 to 2034

Figure 134: Italy Market Share Analysis (%) by Application, 2024 to 2034

Figure 135: Italy Market Share Analysis (%) by Distribution Channel, 2024 to 2034

Figure 136: France Market Value Proportion Analysis, 2023

Figure 137: Global Vs France Growth Comparison, 2024 to 2034

Figure 138: France Market Share Analysis (%) by Product, 2024 to 2034

Figure 139: France Market Share Analysis (%) by Application, 2024 to 2034

Figure 140: France Market Share Analysis (%) by Distribution Channel, 2024 to 2034

Figure 141: Spain Market Value Proportion Analysis, 2023

Figure 142: Global Vs Spain Growth Comparison, 2024 to 2034

Figure 143: Spain Market Share Analysis (%) by Product, 2024 to 2034

Figure 144: Spain Market Share Analysis (%) by Application, 2024 to 2034

Figure 145: Spain Market Share Analysis (%) by Distribution Channel, 2024 to 2034

Figure 146: Nordic Countries Market Value Proportion Analysis, 2023

Figure 147: Global Vs Nordic Countries Growth Comparison, 2024 to 2034

Figure 148: Nordic Countries Market Share Analysis (%) by Product, 2024 to 2034

Figure 149: Nordic Countries Market Share Analysis (%) by Application, 2024 to 2034

Figure 150: Nordic Countries Market Share Analysis (%) by Distribution Channel, 2024 to 2034

Figure 151: BENELUX Market Value Proportion Analysis, 2023

Figure 152: Global Vs BENELUX Growth Comparison, 2024 to 2034

Figure 153: BENELUX Market Share Analysis (%) by Product, 2024 to 2034

Figure 154: BENELUX Market Share Analysis (%) by Application, 2024 to 2034

Figure 155: BENELUX Market Share Analysis (%) by Distribution Channel, 2024 to 2034

Figure 156: Eastern Europe Market Value (US$ million) Analysis, 2019 to 2023

Figure 157: Eastern Europe Market Value (US$ million) Forecast, 2024 to 2034

Figure 158: Eastern Europe Market Value Share, by Product (2024 E)

Figure 159: Eastern Europe Market Value Share, by Application (2024 E)

Figure 160: Eastern Europe Market Value Share, by Distribution Channel (2024 E)

Figure 161: Eastern Europe Market Value Share, by Country (2024 E)

Figure 162: Eastern Europe Market Attractiveness Analysis by Product, 2024 to 2034

Figure 163: Eastern Europe Market Attractiveness Analysis by Application, 2024 to 2034

Figure 164: Eastern Europe Market Attractiveness Analysis by Distribution Channel, 2024 to 2034

Figure 165: Eastern Europe Market Attractiveness Analysis by Country, 2024 to 2034

Figure 166: Russia Market Value Proportion Analysis, 2023

Figure 167: Global Vs. Russia Growth Comparison, 2024 to 2034

Figure 168: Russia Market Share Analysis (%) by Product, 2024 to 2034

Figure 169: Russia Market Share Analysis (%) by Application, 2024 to 2034

Figure 170: Russia Market Share Analysis (%) by Distribution Channel, 2024 to 2034

Figure 171: Hungary Market Value Proportion Analysis, 2023

Figure 172: Global Vs Hungary Growth Comparison, 2024 to 2034

Figure 173: Hungary Market Share Analysis (%) by Product, 2024 to 2034

Figure 174: Hungary Market Share Analysis (%) by Application, 2024 to 2034

Figure 175: Hungary Market Share Analysis (%) by Distribution Channel, 2024 to 2034

Figure 176: Poland Market Value Proportion Analysis, 2023

Figure 177: Global Vs Poland Growth Comparison, 2024 to 2034

Figure 178: Poland Market Share Analysis (%) by Product, 2024 to 2034

Figure 179: Poland Market Share Analysis (%) by Application, 2024 to 2034

Figure 180: Poland Market Share Analysis (%) by Distribution Channel, 2024 to 2034

Figure 181: Middle East and Africa Market Value (US$ million) Analysis, 2019 to 2023

Figure 182: Middle East and Africa Market Value (US$ million) Forecast, 2024 to 2034

Figure 183: Middle East and Africa Market Value Share, by Product (2024 E)

Figure 184: Middle East and Africa Market Value Share, by Application (2024E)

Figure 185: Middle East and Africa Market Value Share, by Distribution Channel (2024 E)

Figure 186: Middle East and Africa Market Value Share, by Country (2024 E)

Figure 187: Middle East and Africa Market Attractiveness Analysis by Product, 2024 to 2034

Figure 188: Middle East and Africa Market Attractiveness Analysis by Application, 2024 to 2034

Figure 189: Middle East and Africa Market Attractiveness Analysis by Distribution Channel, 2024 to 2034

Figure 190: Middle East and Africa Market Attractiveness Analysis by Country, 2024 to 2034

Figure 191: Saudi Arabia Market Value Proportion Analysis, 2023

Figure 192: Global Vs Saudi Arabia Growth Comparison, 2024 to 2034

Figure 193: Saudi Arabia Market Share Analysis (%) by Product, 2024 to 2034

Figure 194: Saudi Arabia Market Share Analysis (%) by Application, 2023 and2034

Figure 195: Saudi Arabia Market Share Analysis (%) by Distribution Channel, 2024 to 2034

Figure 196: Türkiye Market Value Proportion Analysis, 2023

Figure 197: Global Vs. Türkiye Growth Comparison, 2024 to 2034

Figure 198: Türkiye Market Share Analysis (%) by Product, 2024 to 2034

Figure 199: Türkiye Market Share Analysis (%) by Application, 2024 to 2034

Figure 200: Türkiye Market Share Analysis (%) by Distribution Channel, 2024 to 2034

Figure 201: South Africa Market Value Proportion Analysis, 2023

Figure 202: Global Vs. South Africa Growth Comparison, 2024 to 2034

Figure 203: South Africa Market Share Analysis (%) by Product, 2024 to 2034

Figure 204: South Africa Market Share Analysis (%) by Application, 2023 and2034

Figure 205: South Africa Market Share Analysis (%) by Distribution Channel, 2024 to 2034

Figure 206: Other African Union Market Value Proportion Analysis, 2023

Figure 207: Global Vs Other African Union Growth Comparison, 2024 to 2034

Figure 208: Other African Union Market Share Analysis (%) by Product, 2024 to 2034

Figure 209: Other African Union Market Share Analysis (%) by Application, 2024 to 2034

Figure 210: Other African Union Market Share Analysis (%) by Distribution Channel, 2024 to 2034

Recommendations

Healthcare

Cataract Surgery Device Market

Published : March 2024

Healthcare

Dental Flap Surgery Market

Published : November 2022

Healthcare

Lung Cancer Surgery Market

Published : June 2022

Healthcare

Bariatric Surgery Devices Market

Published : June 2022

Explore Healthcare Insights

View Reports

Ophthalmic Surgical Market