Reports

- Global Locations -

Headquarters

Future Market Insights, Inc.

Christiana Corporate, 200
Continental Drive, Suite 401,
Newark, Delaware - 19713,
United States

T: +1-845-579-5705

Americas

Future Market Insights, Inc.

616 Corporate Way, Suite 2-9018,
Valley Cottage, NY 10989, United States

T: +1-347-918-3531

MEA

Future Market Insights

1602-6 Jumeirah Bay X2 Tower, Plot No: JLT-PH2-X2A,
Jumeirah Lakes Towers, Dubai,
United Arab Emirates

Europe

Future Market Insights

3rd Floor, 207 Regent Street,
W1B 3HH London
United Kingdom

T: + 44 (0) 20 8123 9659
D: +44 (0) 20 3287 4268

Asia Pacific

Future Market Insights

IndiaLand Global Tech Park, Unit UG-1, Behind Grand HighStreet, Phase 1, Hinjawadi, MH, Pune – 411057, India

Ophthalmic Drug Packaging Market Snapshot 2024 to 2034

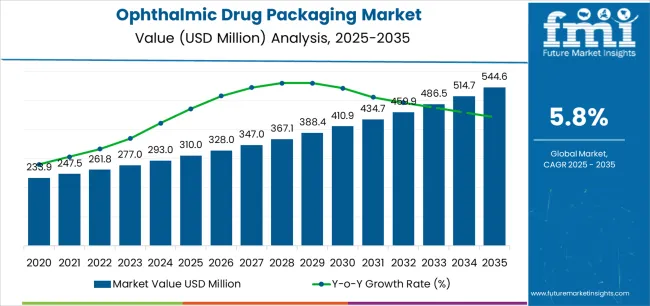
The ophthalmic drug packaging market had an estimated market share worth US$ 276 million in 2023, and it is predicted to reach a global market valuation of US$ 527.8 million by 2034, growing at a CAGR of 6.1% from 2024 to 2034.

Report Attribute Details
Estimated Market Value in 2023 US$ 276 million
Expected Market Value in 2024 US$ 292.2 million
Projected Forecast Value in 2034 US$ 527.8 million
Anticipated Growth Rate from 2024 to 2034 6.1%

Don't pay for what you don't need

Customize your report by selecting specific countries or regions and save 30%!

Demand Analysis of Ophthalmic Drug Packaging

  • Companies may stand out from competitors and obtain a competitive edge in the market by providing innovative packaging solutions that optimize medication administration, increase patient adherence, and guarantee product safety.
  • Providing customized ophthalmic drug packaging in response to the increasing demand might help companies increase their market share and income. There is a great chance for companies to increase their market share and profitability as the frequency of eye problems rises worldwide.
  • Companies may use complementary knowledge and resources to develop and market cutting edge packaging solutions by working with pharmaceutical firms, healthcare providers, and packaging makers.
  • They may expand their product offerings, reach new markets, and spur innovation in the ophthalmic drug packaging industry by establishing strategic alliances.

Ophthalmic Drug Packaging Market Historical Analysis 2019 to 2023 vs. Forecast Outlook 2024 to 2034

The global demand for the ophthalmic drug packaging market was estimated to reach a valuation of US$ 222.3 million in 2019, according to a report from Future Market Insights (FMI). From 2019 to 2023, the ophthalmic drug packaging market witnesses significant growth, registering a CAGR of 5.6%.

Historical CAGR 2019 to 2023 5.6%
Forecast CAGR 2024 to 2034 6.1%

The development of intelligent packaging solutions with digital technology integrated is one advancement in the ophthalmic drug packaging market. Electronic sensors, RFID (Radio Frequency Identification) tags, or NFC (Near Field Communication) chips are a few examples of features that these smart packages may include.

These capabilities allow for real time monitoring of drug consumption, temperature, and expiration dates. By giving patients dose reminders and tracking, this invention improves drug adherence. It also gives healthcare practitioners useful data to assess treatment progress and improve patient outcomes. Such innovations are anticipated to push the market growth forward.

Ismail Sutaria
Ismail Sutaria

Principal Consultant

Talk to Analyst

Find your sweet spots for generating winning opportunities in this market.

Key Factors Driving the Ophthalmic Drug Packaging Market

Personalized Therapies and Precision Medicine to Enhance Growth

One distinct factor propelling the ophthalmic drug packaging market is the increasing prevalence of precision medicines and customized medicine. The need for personalized ophthalmic drugs that are matched to each patient's unique profile is rising due to developments in genetic testing and targeted therapies. This trend necessitates creative packaging options that maintain accuracy and safety while enabling a range of doses, formulations, and administration schedules.

Personalized medicine also encourages pharmaceutical firms and package manufacturers to work together to create customized packaging forms that improve patient outcomes and drug efficacy. This driver is a reflection of the way that healthcare is changing to provide more individualized treatment, which is encouraging innovation in the packaging of ophthalmic drugs.

Factors that can impede Market Growth

Quality Control and Supply Chain Disruptions to Impede the Market Growth

Few restraints of the market are:

  • Ensuring that packaging supplies do not interact negatively with sensitive ophthalmic drugs, so maintaining therapeutic efficacy and patient safety while preventing contamination.
  • Fulfilling the requirements imposed by regulatory agencies for sterility, safety, and labeling in order to guarantee patient welfare and product quality.
  • Addressing the effects on the environment by using recyclable materials, cutting down on packaging waste, and lowering carbon footprint all the way through a product's lifespan.
  • Reducing manufacturing costs to preserve affordability and competitiveness in the market while creating cutting edge packaging solutions that improve patient adherence and medication administration.

Get the data you need at a Fraction of the cost

Personalize your report by choosing insights you need
and save 40%!

Comparative View of Adjacent Markets

In this section, analysis will be drawn among three relevant markets. These are the ophthalmic drug packaging market, antiviral drug packaging market and topical drugs packaging market.

Growth in the antiviral, topical, and ophthalmic drugs packaging markets is often driven by the rising incidence of skin problems, viral infections, and eye illnesses, respectively. The global growth of these industries is further aided by developments in drug delivery technology, safety and sterility regulations, and an increasing focus on patient adherence and convenience.

Ophthalmic Drug Packaging Market:

Market Name Ophthalmic Drug Packaging Market
CAGR from 2024 to 2034 6.1%
Growth Factor The need for specialist ophthalmic medicine packaging is driven by an increase in incidence of diabetic retinopathy.
Future Opportunities Developing innovative telemedicine packaging that provides practical, approachable options for remote eye care services in the expanding digital health sector.

Antiviral Drug Packaging Market:

Market Name Antiviral Drug Packaging Market
CAGR from 2024 to 2034 5.9%
Growth Factor The market for antiviral drugs packaging is expanding as a result of the introduction of generic versions of antiviral medications and growing public knowledge of the existence of vaccinations for viral illnesses.
Future Opportunities It is expected that the increased occurrence of viral illnesses such as herpes, HIV, influenza, and others would increase demand for antiviral medications, hence driving up product sales.

Topical Drugs Packaging Market:

Market Name Topical Drugs Packaging Market
CAGR from 2024 to 2034 9.2%
Growth Factor The expanding pharmaceutical business in emerging economies is driving market expansion.
Future Opportunities The topical drug packaging market is expected to develop during the forecast period due to the rising use of drugs such as ointments, gels, lotions, and creams, as well as an increase in the use of treatments for asthma.

Category wise Insights

This section focuses on providing detailed analysis of two particular market segments for ophthalmic drug packaging, the dominant dose type and the significant end use. The two main segments discussed below are the IVD equipment and immunoassay.

Multi Dose Drugs will Greatly Require the Ophthalmic Drug Packaging

Dose Type Multi Dose
Market Share in 2024 81.7%

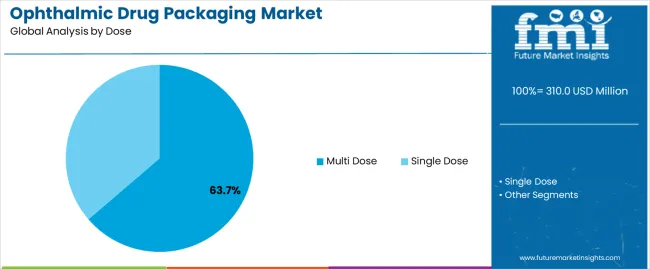
The multi dose drug segment is anticipated to reach an 81.7% market share in 2024. Many eye disorders need frequent and long term therapy, making multidose packaging affordable and easy for patients. Since these drugs are usually taken in small amounts, dispensing several doses from a single container is feasible.

The use of multidose packaging improves patient outcomes and treatment efficacy by making it simpler for patients and healthcare professionals to keep track of medicine consumption and adherence.

Preservatives and antibacterial agents are frequently included in multi dose packaging for ocular medications in order to preserve sterility and avoid contamination over the course of therapy.

Ophthalmic Drug Packaging is likely to be Widely Used for Prescription Drugs

End Use Prescription
Market Share in 2024 64.2%

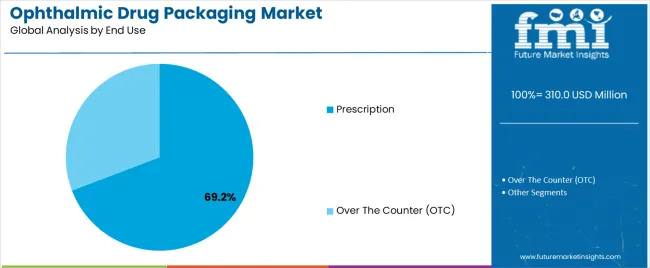
In 2024, the prescription segment by end use is likely to gain a 64.2% market share. Ophthalmic drug packaging is mostly utilized for prescription medication since eye treatments are specialized. Prescription drugs frequently need exact dosage and administration guidelines catered to the specific requirements of each patient, therefore packaging designs that guarantee right delivery and save waste are required.

Specialist packaging is necessary to ensure therapeutic efficacy and safety for patients under professional medical care. This is because prescription ophthalmic drugs may include strong or delicate chemicals that need extra protection against contamination and degradation.

Region wise Analysis

This section will go into detail on the ophthalmic drug packaging markets in a few key countries, including the United States, the United Kingdom, China, Japan and South Korea. This segment will focus on the key factors that are driving up demand in these countries for ophthalmic drug packaging.

Countries Forecast CAGR from 2024 to 2034
The United States 11.9%
The United Kingdom 12.9%
China 12.7%
Japan 13%
South Korea 14.1%

Increasing Cases of Dry Eye and Diabetic Retinopathy in the United States to Accelerate Demand

The United States ophthalmic drug packaging ecosystem is anticipated to gain a CAGR of 4.3% through 2034. Factors that are bolstering the growth are:

  • The rising incidence of diabetic retinopathy in the United States, together with lifestyle choices that exacerbate illnesses like dry eye syndrome, create a special demand for ophthalmic drug packaging.
  • This calls for packaging solutions that are customized to meet the unique demands of patients in the American healthcare system, including those pertaining to dry eye therapy and diabetic eye care.

Age Related Macular Degeneration in the United Kingdom to Bolster Growth

The ophthalmic drug packaging market in the United Kingdom is expected to expand with a 5.5% CAGR through 2034. The factors pushing the growth are:

  • Age related macular degeneration (AMD) is more common in the United Kingdom, which increases the need for specialist ophthalmic drug packaging.
  • This guarantees older persons receive their medications in a secure and efficient manner.
  • In order to improve treatment results and encourage patient adherence, innovative package styles that accommodate lower dexterity and visual impairment are essential.

Burgeoning Middle Class in China Focusing on Wellness and Healthcare to Bolster Growth in China

The ophthalmic drug packaging ecosystem in China is anticipated to develop with a 7.1% CAGR from 2024 to 2034. The drivers behind this growth are:

  • The growing middle class in China is placing more and more emphasis on health and wellbeing, which is fueling the need for advanced packaging solutions that are practical, lightweight, and simple to use.
  • This trend opens up opportunities for packaging innovations targeted to the requirements and tastes of Chinese customers.
  • This includes small and travel friendly package forms, as well as culturally appropriate designs and branding tactics, to appeal to China's broad consumer base.

High Life Expectancy and Aging Population in Japan to Accelerate Demand

The ophthalmic drug packaging industry in Japan is anticipated to reach a 4.4% CAGR from 2024 to 2034. The drivers propelling growth forward are:

  • The need for ophthalmic drug packaging is driven by Japan's unique demographic trend of a rapidly aging population along with a high life expectancy rate.
  • Age related eye disorders are becoming more common due to this demographic transition. This highlights the urgent need for innovative packaging solutions that guarantee safe and efficient drug delivery catered to the unique requirements of senior patients.

Eye Related Treatments to Bolster Demand in South Korea

The ophthalmic drug packaging ecosystem in South Korea is likely to evolve with a 5.6% CAGR during the forecast period. The factors bolstering the growth are:
  • Specialized ophthalmic drug packaging is becoming more and more in demand in South Korea considering the growing popularity of beauty and cosmetic items, including treatments connected to the eyes, including eyelash serums and brightening solutions.
  • The ophthalmic drug packaging industry in South Korea is expanding by means of innovative package designs that satisfy the country's sophisticated customers by fusing visual appeal with usefulness.

Market Competition

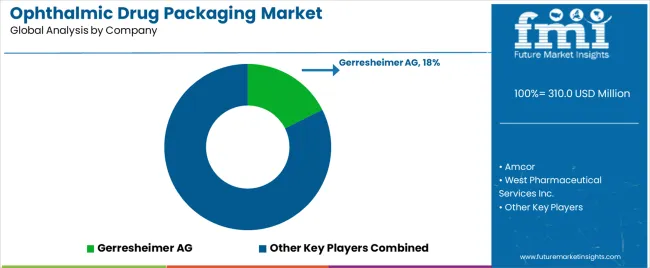
Companies are realizing how crucial it is to develop specialized packaging solutions to satisfy the various demands of healthcare professionals and patients. This might entail specially designed package formats, including pre filled syringes, multi dose bottles, or single dose vials, in addition to packaging designs that promote patient adherence and convenience of use. In the pharmaceutical sector, compliance with strict regulations is essential, especially when it comes to the packaging of ophthalmic drugs.

To guarantee product safety and market approval, leading companies place a high priority on adhering to rules established by regulatory authorities like the European Medicines Agency (EMA) in Europe and the Food and Drug Administration (FDA) in the United States. Continual research and development is necessary to propel innovation in the packaging of ophthalmic drugs. The key players in this market include:

  • Amcor
  • West Pharmaceutical Services Inc.
  • Gerresheimer AG
  • Merck Sharp & Dohme Corp.
  • AptarGroup Inc.
  • Akorn Inc.
  • Mitotech SA
  • Bausch & Lomb Incorporated
  • Bayer AG
  • Novartis AG

Significant advancements in the ophthalmic drug packaging market are being made by key market participants, and these include:

  • In 2023, Amcor announced the addition of heat seal sachets for dry culinary and beverage applications, like instant coffee, drink powders, spices, seasonings, and dried soups, to its AmFiberTM Performance Paper packaging line in Europe.
  • Amcor's AmFiber™ Performance Paper is a paper based packaging with good barrier properties and is recyclable. In 2022, AmFiberTM Performance Paper-a high barrier, recyclable paper based packaging-was first introduced for use in snacks and candies. Presently seen on shop shelves for well-known snack and confectionery brands, it provides great performance on the packaging machines of brand owners while providing high barrier protection against moisture and oxygen.
  • Amcor has made investments in production capacity in order to fulfill the increasing demand for this type of paper packaging, in addition to extending its applicability to other product categories.

Key Coverage in Ophthalmic Drug Packaging Market Report

  • Market Study on Ophthalmic Packaging
  • North America Ophthalmic Packaging Market
  • Pharmaceutical Packaging Market
  • Plastic Ophthalmic Packaging Market
  • Ophthalmology Drugs Market

Report Scope

Report Attribute Details
Growth Rate CAGR of 6.1% from 2024 to 2034
Market value in 2024 US$ 292.2 million
Market value in 2034 US$ 527.8 million
Base Year for Estimation 2023
Historical Data 2019 to 2023
Forecast Period 2024 to 2034
Quantitative Units US$ million for value
Report Coverage Revenue Forecast, Company Ranking, Competitive Landscape, Growth Factors, Trends, and Pricing Analysis
Segments Covered
  • Dose
  • Material Type
  • End Use
  • End User
Regions Covered
  • North America
  • Latin America
  • Western Europe
  • Eastern Europe
  • South Asia and Pacific
  • East Asia
  • The Middle East & Africa
Countries Profiled
  • The United States
  • Canada
  • Brazil
  • Mexico
  • Germany
  • The United Kingdom
  • France
  • Spain
  • Italy
  • Poland
  • Russia
  • Czech Republic
  • Romania
  • India
  • Bangladesh
  • Australia
  • New Zealand
  • China
  • Japan
  • South Korea
  • GCC Countries
  • South Africa
  • Israel
Key Companies Profiled
  • Amcor
  • West Pharmaceutical Services Inc.
  • Gerresheimer AG
  • Merck Sharp & Dohme Corp.
  • AptarGroup Inc.
  • Akorn Inc.
  • Mitotech SA
  • Bausch & Lomb Incorporated
  • Bayer AG
  • Novartis AG
Customization Scope Available on Request

Key Segments Profiled in the Ophthalmic Drug Packaging Market

By Dose:

  • Multi dose
  • Single dose

By Material Type:

  • Glass
  • Plastic

By End Use:

  • Over the counter (OTC)
  • Prescription

By Region:

  • North America
  • Latin America
  • Western Europe
  • Eastern Europe
  • South Asia and Pacific
  • East Asia
  • The Middle East & Africa

Frequently Asked Questions

What is the anticipated growth rate of the ophthalmic drug packaging market from 2024 to 2034?

The ophthalmic drug packaging market is expected to garner a 6.1% CAGR from 2024 to 2034.

What will be the global market outlook for ophthalmic drug packaging through 2024?

By 2024, the global ophthalmic drug packaging market is likely to gain US$ 292.2 million.

What is the expected global market valuation for ophthalmic drug packaging by 2034?

By 2034, the ophthalmic drug packaging market valuation is likely to reach US$ 527.8 million.

How will the demand for ophthalmic drug packaging develop in the United States?

The ophthalmic drug packaging industry in the United States is likely to progress at a 4.3% CAGR.

Which dose is highly preferred in the ophthalmic drug packaging market?

Multi dose is highly preferred in the ophthalmic drug packaging market and is likely to gain an 81.7% market share in 2024.

Which end use of ophthalmic drug packaging will gain traction in 2024?

The prescription based ophthalmic drug packaging will gain traction in 2024, with an anticipated 64.2% market share.

Table of Content

1. Executive Summary

    1.1. Global Market Outlook

    1.2. Demand-side Trends

    1.3. Supply-side Trends

    1.4. Technology Roadmap Analysis

    1.5. Analysis and Recommendations

2. Market Overview

    2.1. Market Coverage / Taxonomy

    2.2. Market Definition / Scope / Limitations

3. Market Background

    3.1. Market Dynamics

        3.1.1. Drivers

        3.1.2. Restraints

        3.1.3. Opportunity

        3.1.4. Trends

    3.2. Scenario Forecast

        3.2.1. Demand in Optimistic Scenario

        3.2.2. Demand in Likely Scenario

        3.2.3. Demand in Conservative Scenario

    3.3. Opportunity Map Analysis

    3.4. Product Life Cycle Analysis

    3.5. Supply Chain Analysis

        3.5.1. Supply Side Participants and their Roles

            3.5.1.1. Manufacturer

            3.5.1.2. Mid-Level Participants (Traders)

        3.5.2. Value Added and Value Created at Node in the Supply Chain

        3.5.3. List of Raw Material Suppliers

        3.5.4. List of Existing and Potential Buyer’s

    3.6. Investment Feasibility Matrix

    3.7. Value Chain Analysis

        3.7.1. Profit Margin Analysis

    3.8. PESTLE and Porter’s Analysis

    3.9. Regulatory Landscape

        3.9.1. By Key Regions

        3.9.2. By Key Countries

    3.10. Regional Parent Market Outlook

    3.11. Production and Consumption Statistics

    3.12. Import and Export Statistics

4. Global Market Analysis 2019 to 2023 and Forecast, 2024 to 2034

    4.1. Historical Market Size Value (US$ Million) & Volume (Units) Analysis, 2019 to 2023

    4.2. Current and Future Market Size Value (US$ Million) & Volume (Units) Projections, 2024 to 2034

        4.2.1. Y-o-Y Growth Trend Analysis

        4.2.2. Absolute $ Opportunity Analysis

5. Global Market Analysis 2019 to 2023 and Forecast 2024 to 2034, By Dose

    5.1. Introduction / Key Findings

    5.2. Historical Market Size Value (US$ Million) & Volume (Units) Analysis By Dose, 2019 to 2023

    5.3. Current and Future Market Size Value (US$ Million) & Volume (Units) Analysis and Forecast By Dose, 2024 to 2034

        5.3.1. Multi-dose

        5.3.2. Single-dose

    5.4. Y-o-Y Growth Trend Analysis By Dose, 2019 to 2023

    5.5. Absolute $ Opportunity Analysis By Dose, 2024 to 2034

6. Global Market Analysis 2019 to 2023 and Forecast 2024 to 2034, By Material Type

    6.1. Introduction / Key Findings

    6.2. Historical Market Size Value (US$ Million) & Volume (Units) Analysis By Material Type, 2019 to 2023

    6.3. Current and Future Market Size Value (US$ Million) & Volume (Units) Analysis and Forecast By Material Type, 2024 to 2034

        6.3.1. Glass

        6.3.2. Plastic

    6.4. Y-o-Y Growth Trend Analysis By Material Type, 2019 to 2023

    6.5. Absolute $ Opportunity Analysis By Material Type, 2024 to 2034

7. Global Market Analysis 2019 to 2023 and Forecast 2024 to 2034, By Channel

    7.1. Introduction / Key Findings

    7.2. Historical Market Size Value (US$ Million) & Volume (Units) Analysis By End Use, 2019 to 2023

    7.3. Current and Future Market Size Value (US$ Million) & Volume (Units) Analysis and Forecast By End Use, 2024 to 2034

        7.3.1. Over-the-Counter (OTC)

        7.3.2. Prescription

    7.4. Y-o-Y Growth Trend Analysis By End Use, 2019 to 2023

    7.5. Absolute $ Opportunity Analysis By End Use, 2024 to 2034

8. Global Market Analysis 2019 to 2023 and Forecast 2024 to 2034, By Region

    8.1. Introduction

    8.2. Historical Market Size Value (US$ Million) & Volume (Units) Analysis By Region, 2019 to 2023

    8.3. Current Market Size Value (US$ Million) & Volume (Units) Analysis and Forecast By Region, 2024 to 2034

        8.3.1. North America

        8.3.2. Latin America

        8.3.3. Western Europe

        8.3.4. Eastern Europe

        8.3.5. South Asia and Pacific

        8.3.6. East Asia

        8.3.7. Middle East and Africa

    8.4. Market Attractiveness Analysis By Region

9. North America Market Analysis 2019 to 2023 and Forecast 2024 to 2034, By Country

    9.1. Historical Market Size Value (US$ Million) & Volume (Units) Trend Analysis By Market Taxonomy, 2019 to 2023

    9.2. Market Size Value (US$ Million) & Volume (Units) Forecast By Market Taxonomy, 2024 to 2034

        9.2.1. By Country

            9.2.1.1. USA

            9.2.1.2. Canada

        9.2.2. By Dose

        9.2.3. By Material Type

        9.2.4. By End Use

    9.3. Market Attractiveness Analysis

        9.3.1. By Country

        9.3.2. By Dose

        9.3.3. By Material Type

        9.3.4. By End Use

    9.4. Key Takeaways

10. Latin America Market Analysis 2019 to 2023 and Forecast 2024 to 2034, By Country

    10.1. Historical Market Size Value (US$ Million) & Volume (Units) Trend Analysis By Market Taxonomy, 2019 to 2023

    10.2. Market Size Value (US$ Million) & Volume (Units) Forecast By Market Taxonomy, 2024 to 2034

        10.2.1. By Country

            10.2.1.1. Brazil

            10.2.1.2. Mexico

            10.2.1.3. Rest of Latin America

        10.2.2. By Dose

        10.2.3. By Material Type

        10.2.4. By End Use

    10.3. Market Attractiveness Analysis

        10.3.1. By Country

        10.3.2. By Dose

        10.3.3. By Material Type

        10.3.4. By End Use

    10.4. Key Takeaways

11. Western Europe Market Analysis 2019 to 2023 and Forecast 2024 to 2034, By Country

    11.1. Historical Market Size Value (US$ Million) & Volume (Units) Trend Analysis By Market Taxonomy, 2019 to 2023

    11.2. Market Size Value (US$ Million) & Volume (Units) Forecast By Market Taxonomy, 2024 to 2034

        11.2.1. By Country

            11.2.1.1. Germany

            11.2.1.2. UK

            11.2.1.3. France

            11.2.1.4. Spain

            11.2.1.5. Italy

            11.2.1.6. Rest of Western Europe

        11.2.2. By Dose

        11.2.3. By Material Type

        11.2.4. By End Use

    11.3. Market Attractiveness Analysis

        11.3.1. By Country

        11.3.2. By Dose

        11.3.3. By Material Type

        11.3.4. By End Use

    11.4. Key Takeaways

12. Eastern Europe Market Analysis 2019 to 2023 and Forecast 2024 to 2034, By Country

    12.1. Historical Market Size Value (US$ Million) & Volume (Units) Trend Analysis By Market Taxonomy, 2019 to 2023

    12.2. Market Size Value (US$ Million) & Volume (Units) Forecast By Market Taxonomy, 2024 to 2034

        12.2.1. By Country

            12.2.1.1. Poland

            12.2.1.2. Russia

            12.2.1.3. Czech Republic

            12.2.1.4. Romania

            12.2.1.5. Rest of Eastern Europe

        12.2.2. By Dose

        12.2.3. By Material Type

        12.2.4. By End Use

    12.3. Market Attractiveness Analysis

        12.3.1. By Country

        12.3.2. By Dose

        12.3.3. By Material Type

        12.3.4. By End Use

    12.4. Key Takeaways

13. South Asia and Pacific Market Analysis 2019 to 2023 and Forecast 2024 to 2034, By Country

    13.1. Historical Market Size Value (US$ Million) & Volume (Units) Trend Analysis By Market Taxonomy, 2019 to 2023

    13.2. Market Size Value (US$ Million) & Volume (Units) Forecast By Market Taxonomy, 2024 to 2034

        13.2.1. By Country

            13.2.1.1. India

            13.2.1.2. Bangladesh

            13.2.1.3. Australia

            13.2.1.4. New Zealand

            13.2.1.5. Rest of South Asia and Pacific

        13.2.2. By Dose

        13.2.3. By Material Type

        13.2.4. By End Use

    13.3. Market Attractiveness Analysis

        13.3.1. By Country

        13.3.2. By Dose

        13.3.3. By Material Type

        13.3.4. By End Use

    13.4. Key Takeaways

14. East Asia Market Analysis 2019 to 2023 and Forecast 2024 to 2034, By Country

    14.1. Historical Market Size Value (US$ Million) & Volume (Units) Trend Analysis By Market Taxonomy, 2019 to 2023

    14.2. Market Size Value (US$ Million) & Volume (Units) Forecast By Market Taxonomy, 2024 to 2034

        14.2.1. By Country

            14.2.1.1. China

            14.2.1.2. Japan

            14.2.1.3. South Korea

        14.2.2. By Dose

        14.2.3. By Material Type

        14.2.4. By End Use

    14.3. Market Attractiveness Analysis

        14.3.1. By Country

        14.3.2. By Dose

        14.3.3. By Material Type

        14.3.4. By End Use

    14.4. Key Takeaways

15. Middle East and Africa Market Analysis 2019 to 2023 and Forecast 2024 to 2034, By Country

    15.1. Historical Market Size Value (US$ Million) & Volume (Units) Trend Analysis By Market Taxonomy, 2019 to 2023

    15.2. Market Size Value (US$ Million) & Volume (Units) Forecast By Market Taxonomy, 2024 to 2034

        15.2.1. By Country

            15.2.1.1. GCC Countries

            15.2.1.2. South Africa

            15.2.1.3. Israel

            15.2.1.4. Rest of MEA

        15.2.2. By Dose

        15.2.3. By Material Type

        15.2.4. By End Use

    15.3. Market Attractiveness Analysis

        15.3.1. By Country

        15.3.2. By Dose

        15.3.3. By Material Type

        15.3.4. By End Use

    15.4. Key Takeaways

16. Key Countries Market Analysis

    16.1. USA

        16.1.1. Pricing Analysis

        16.1.2. Market Share Analysis, 2023

            16.1.2.1. By Dose

            16.1.2.2. By Material Type

            16.1.2.3. By End Use

    16.2. Canada

        16.2.1. Pricing Analysis

        16.2.2. Market Share Analysis, 2023

            16.2.2.1. By Dose

            16.2.2.2. By Material Type

            16.2.2.3. By End Use

    16.3. Brazil

        16.3.1. Pricing Analysis

        16.3.2. Market Share Analysis, 2023

            16.3.2.1. By Dose

            16.3.2.2. By Material Type

            16.3.2.3. By End Use

    16.4. Mexico

        16.4.1. Pricing Analysis

        16.4.2. Market Share Analysis, 2023

            16.4.2.1. By Dose

            16.4.2.2. By Material Type

            16.4.2.3. By End Use

    16.5. Germany

        16.5.1. Pricing Analysis

        16.5.2. Market Share Analysis, 2023

            16.5.2.1. By Dose

            16.5.2.2. By Material Type

            16.5.2.3. By End Use

    16.6. UK

        16.6.1. Pricing Analysis

        16.6.2. Market Share Analysis, 2023

            16.6.2.1. By Dose

            16.6.2.2. By Material Type

            16.6.2.3. By End Use

    16.7. France

        16.7.1. Pricing Analysis

        16.7.2. Market Share Analysis, 2023

            16.7.2.1. By Dose

            16.7.2.2. By Material Type

            16.7.2.3. By End Use

    16.8. Spain

        16.8.1. Pricing Analysis

        16.8.2. Market Share Analysis, 2023

            16.8.2.1. By Dose

            16.8.2.2. By Material Type

            16.8.2.3. By End Use

    16.9. Italy

        16.9.1. Pricing Analysis

        16.9.2. Market Share Analysis, 2023

            16.9.2.1. By Dose

            16.9.2.2. By Material Type

            16.9.2.3. By End Use

    16.10. Poland

        16.10.1. Pricing Analysis

        16.10.2. Market Share Analysis, 2023

            16.10.2.1. By Dose

            16.10.2.2. By Material Type

            16.10.2.3. By End Use

    16.11. Russia

        16.11.1. Pricing Analysis

        16.11.2. Market Share Analysis, 2023

            16.11.2.1. By Dose

            16.11.2.2. By Material Type

            16.11.2.3. By End Use

    16.12. Czech Republic

        16.12.1. Pricing Analysis

        16.12.2. Market Share Analysis, 2023

            16.12.2.1. By Dose

            16.12.2.2. By Material Type

            16.12.2.3. By End Use

    16.13. Romania

        16.13.1. Pricing Analysis

        16.13.2. Market Share Analysis, 2023

            16.13.2.1. By Dose

            16.13.2.2. By Material Type

            16.13.2.3. By End Use

    16.14. India

        16.14.1. Pricing Analysis

        16.14.2. Market Share Analysis, 2023

            16.14.2.1. By Dose

            16.14.2.2. By Material Type

            16.14.2.3. By End Use

    16.15. Bangladesh

        16.15.1. Pricing Analysis

        16.15.2. Market Share Analysis, 2023

            16.15.2.1. By Dose

            16.15.2.2. By Material Type

            16.15.2.3. By End Use

    16.16. Australia

        16.16.1. Pricing Analysis

        16.16.2. Market Share Analysis, 2023

            16.16.2.1. By Dose

            16.16.2.2. By Material Type

            16.16.2.3. By End Use

    16.17. New Zealand

        16.17.1. Pricing Analysis

        16.17.2. Market Share Analysis, 2023

            16.17.2.1. By Dose

            16.17.2.2. By Material Type

            16.17.2.3. By End Use

    16.18. China

        16.18.1. Pricing Analysis

        16.18.2. Market Share Analysis, 2023

            16.18.2.1. By Dose

            16.18.2.2. By Material Type

            16.18.2.3. By End Use

    16.19. Japan

        16.19.1. Pricing Analysis

        16.19.2. Market Share Analysis, 2023

            16.19.2.1. By Dose

            16.19.2.2. By Material Type

            16.19.2.3. By End Use

    16.20. South Korea

        16.20.1. Pricing Analysis

        16.20.2. Market Share Analysis, 2023

            16.20.2.1. By Dose

            16.20.2.2. By Material Type

            16.20.2.3. By End Use

    16.21. GCC Countries

        16.21.1. Pricing Analysis

        16.21.2. Market Share Analysis, 2023

            16.21.2.1. By Dose

            16.21.2.2. By Material Type

            16.21.2.3. By End Use

    16.22. South Africa

        16.22.1. Pricing Analysis

        16.22.2. Market Share Analysis, 2023

            16.22.2.1. By Dose

            16.22.2.2. By Material Type

            16.22.2.3. By End Use

    16.23. Israel

        16.23.1. Pricing Analysis

        16.23.2. Market Share Analysis, 2023

            16.23.2.1. By Dose

            16.23.2.2. By Material Type

            16.23.2.3. By End Use

17. Market Structure Analysis

    17.1. Competition Dashboard

    17.2. Competition Benchmarking

    17.3. Market Share Analysis of Top Players

        17.3.1. By Regional

        17.3.2. By Dose

        17.3.3. By Material Type

        17.3.4. By End Use

18. Competition Analysis

    18.1. Competition Deep Dive

        18.1.1. Amcor

            18.1.1.1. Overview

            18.1.1.2. Product Portfolio

            18.1.1.3. Profitability by Market Segments

            18.1.1.4. Sales Footprint

            18.1.1.5. Strategy Overview

                18.1.1.5.1. Marketing Strategy

                18.1.1.5.2. Product Strategy

                18.1.1.5.3. Channel Strategy

        18.1.2. West Pharmaceutical Services, Inc.

            18.1.2.1. Overview

            18.1.2.2. Product Portfolio

            18.1.2.3. Profitability by Market Segments

            18.1.2.4. Sales Footprint

            18.1.2.5. Strategy Overview

                18.1.2.5.1. Marketing Strategy

                18.1.2.5.2. Product Strategy

                18.1.2.5.3. Channel Strategy

        18.1.3. Gerresheimer AG

            18.1.3.1. Overview

            18.1.3.2. Product Portfolio

            18.1.3.3. Profitability by Market Segments

            18.1.3.4. Sales Footprint

            18.1.3.5. Strategy Overview

                18.1.3.5.1. Marketing Strategy

                18.1.3.5.2. Product Strategy

                18.1.3.5.3. Channel Strategy

        18.1.4. Merck Sharp & Dohme Corp.

            18.1.4.1. Overview

            18.1.4.2. Product Portfolio

            18.1.4.3. Profitability by Market Segments

            18.1.4.4. Sales Footprint

            18.1.4.5. Strategy Overview

                18.1.4.5.1. Marketing Strategy

                18.1.4.5.2. Product Strategy

                18.1.4.5.3. Channel Strategy

        18.1.5. AptarGroup, Inc.

            18.1.5.1. Overview

            18.1.5.2. Product Portfolio

            18.1.5.3. Profitability by Market Segments

            18.1.5.4. Sales Footprint

            18.1.5.5. Strategy Overview

                18.1.5.5.1. Marketing Strategy

                18.1.5.5.2. Product Strategy

                18.1.5.5.3. Channel Strategy

        18.1.6. Akorn, Inc.

            18.1.6.1. Overview

            18.1.6.2. Product Portfolio

            18.1.6.3. Profitability by Market Segments

            18.1.6.4. Sales Footprint

            18.1.6.5. Strategy Overview

                18.1.6.5.1. Marketing Strategy

                18.1.6.5.2. Product Strategy

                18.1.6.5.3. Channel Strategy

        18.1.7. Johnson & Johnson Vision

            18.1.7.1. Overview

            18.1.7.2. Product Portfolio

            18.1.7.3. Profitability by Market Segments

            18.1.7.4. Sales Footprint

            18.1.7.5. Strategy Overview

                18.1.7.5.1. Marketing Strategy

                18.1.7.5.2. Product Strategy

                18.1.7.5.3. Channel Strategy

        18.1.8. Mitotech, SA

            18.1.8.1. Overview

            18.1.8.2. Product Portfolio

            18.1.8.3. Profitability by Market Segments

            18.1.8.4. Sales Footprint

            18.1.8.5. Strategy Overview

                18.1.8.5.1. Marketing Strategy

                18.1.8.5.2. Product Strategy

                18.1.8.5.3. Channel Strategy

        18.1.9. Bausch & Lomb Incorporated

            18.1.9.1. Overview

            18.1.9.2. Product Portfolio

            18.1.9.3. Profitability by Market Segments

            18.1.9.4. Sales Footprint

            18.1.9.5. Strategy Overview

                18.1.9.5.1. Marketing Strategy

                18.1.9.5.2. Product Strategy

                18.1.9.5.3. Channel Strategy

        18.1.10. Bayer AG

            18.1.10.1. Overview

            18.1.10.2. Product Portfolio

            18.1.10.3. Profitability by Market Segments

            18.1.10.4. Sales Footprint

            18.1.10.5. Strategy Overview

                18.1.10.5.1. Marketing Strategy

                18.1.10.5.2. Product Strategy

                18.1.10.5.3. Channel Strategy

        18.1.11. Novartis AG

            18.1.11.1. Overview

            18.1.11.2. Product Portfolio

            18.1.11.3. Profitability by Market Segments

            18.1.11.4. Sales Footprint

            18.1.11.5. Strategy Overview

                18.1.11.5.1. Marketing Strategy

                18.1.11.5.2. Product Strategy

                18.1.11.5.3. Channel Strategy

19. Assumptions & Acronyms Used

20. Research Methodology

List of Tables

Table 1: Global Market Value (US$ Million) Forecast by Region, 2019 to 2034

Table 2: Global Market Volume (Units) Forecast by Region, 2019 to 2034

Table 3: Global Market Value (US$ Million) Forecast by Dose, 2019 to 2034

Table 4: Global Market Volume (Units) Forecast by Dose, 2019 to 2034

Table 5: Global Market Value (US$ Million) Forecast by Material Type, 2019 to 2034

Table 6: Global Market Volume (Units) Forecast by Material Type, 2019 to 2034

Table 7: Global Market Value (US$ Million) Forecast by End Use, 2019 to 2034

Table 8: Global Market Volume (Units) Forecast by End Use, 2019 to 2034

Table 9: North America Market Value (US$ Million) Forecast by Country, 2019 to 2034

Table 10: North America Market Volume (Units) Forecast by Country, 2019 to 2034

Table 11: North America Market Value (US$ Million) Forecast by Dose, 2019 to 2034

Table 12: North America Market Volume (Units) Forecast by Dose, 2019 to 2034

Table 13: North America Market Value (US$ Million) Forecast by Material Type, 2019 to 2034

Table 14: North America Market Volume (Units) Forecast by Material Type, 2019 to 2034

Table 15: North America Market Value (US$ Million) Forecast by End Use, 2019 to 2034

Table 16: North America Market Volume (Units) Forecast by End Use, 2019 to 2034

Table 17: Latin America Market Value (US$ Million) Forecast by Country, 2019 to 2034

Table 18: Latin America Market Volume (Units) Forecast by Country, 2019 to 2034

Table 19: Latin America Market Value (US$ Million) Forecast by Dose, 2019 to 2034

Table 20: Latin America Market Volume (Units) Forecast by Dose, 2019 to 2034

Table 21: Latin America Market Value (US$ Million) Forecast by Material Type, 2019 to 2034

Table 22: Latin America Market Volume (Units) Forecast by Material Type, 2019 to 2034

Table 23: Latin America Market Value (US$ Million) Forecast by End Use, 2019 to 2034

Table 24: Latin America Market Volume (Units) Forecast by End Use, 2019 to 2034

Table 25: Western Europe Market Value (US$ Million) Forecast by Country, 2019 to 2034

Table 26: Western Europe Market Volume (Units) Forecast by Country, 2019 to 2034

Table 27: Western Europe Market Value (US$ Million) Forecast by Dose, 2019 to 2034

Table 28: Western Europe Market Volume (Units) Forecast by Dose, 2019 to 2034

Table 29: Western Europe Market Value (US$ Million) Forecast by Material Type, 2019 to 2034

Table 30: Western Europe Market Volume (Units) Forecast by Material Type, 2019 to 2034

Table 31: Western Europe Market Value (US$ Million) Forecast by End Use, 2019 to 2034

Table 32: Western Europe Market Volume (Units) Forecast by End Use, 2019 to 2034

Table 33: Eastern Europe Market Value (US$ Million) Forecast by Country, 2019 to 2034

Table 34: Eastern Europe Market Volume (Units) Forecast by Country, 2019 to 2034

Table 35: Eastern Europe Market Value (US$ Million) Forecast by Dose, 2019 to 2034

Table 36: Eastern Europe Market Volume (Units) Forecast by Dose, 2019 to 2034

Table 37: Eastern Europe Market Value (US$ Million) Forecast by Material Type, 2019 to 2034

Table 38: Eastern Europe Market Volume (Units) Forecast by Material Type, 2019 to 2034

Table 39: Eastern Europe Market Value (US$ Million) Forecast by End Use, 2019 to 2034

Table 40: Eastern Europe Market Volume (Units) Forecast by End Use, 2019 to 2034

Table 41: South Asia and Pacific Market Value (US$ Million) Forecast by Country, 2019 to 2034

Table 42: South Asia and Pacific Market Volume (Units) Forecast by Country, 2019 to 2034

Table 43: South Asia and Pacific Market Value (US$ Million) Forecast by Dose, 2019 to 2034

Table 44: South Asia and Pacific Market Volume (Units) Forecast by Dose, 2019 to 2034

Table 45: South Asia and Pacific Market Value (US$ Million) Forecast by Material Type, 2019 to 2034

Table 46: South Asia and Pacific Market Volume (Units) Forecast by Material Type, 2019 to 2034

Table 47: South Asia and Pacific Market Value (US$ Million) Forecast by End Use, 2019 to 2034

Table 48: South Asia and Pacific Market Volume (Units) Forecast by End Use, 2019 to 2034

Table 49: East Asia Market Value (US$ Million) Forecast by Country, 2019 to 2034

Table 50: East Asia Market Volume (Units) Forecast by Country, 2019 to 2034

Table 51: East Asia Market Value (US$ Million) Forecast by Dose, 2019 to 2034

Table 52: East Asia Market Volume (Units) Forecast by Dose, 2019 to 2034

Table 53: East Asia Market Value (US$ Million) Forecast by Material Type, 2019 to 2034

Table 54: East Asia Market Volume (Units) Forecast by Material Type, 2019 to 2034

Table 55: East Asia Market Value (US$ Million) Forecast by End Use, 2019 to 2034

Table 56: East Asia Market Volume (Units) Forecast by End Use, 2019 to 2034

Table 57: Middle East and Africa Market Value (US$ Million) Forecast by Country, 2019 to 2034

Table 58: Middle East and Africa Market Volume (Units) Forecast by Country, 2019 to 2034

Table 59: Middle East and Africa Market Value (US$ Million) Forecast by Dose, 2019 to 2034

Table 60: Middle East and Africa Market Volume (Units) Forecast by Dose, 2019 to 2034

Table 61: Middle East and Africa Market Value (US$ Million) Forecast by Material Type, 2019 to 2034

Table 62: Middle East and Africa Market Volume (Units) Forecast by Material Type, 2019 to 2034

Table 63: Middle East and Africa Market Value (US$ Million) Forecast by End Use, 2019 to 2034

Table 64: Middle East and Africa Market Volume (Units) Forecast by End Use, 2019 to 2034

List of Charts

Figure 1: Global Market Value (US$ Million) by Dose, 2024 to 2034

Figure 2: Global Market Value (US$ Million) by Material Type, 2024 to 2034

Figure 3: Global Market Value (US$ Million) by End Use, 2024 to 2034

Figure 4: Global Market Value (US$ Million) by Region, 2024 to 2034

Figure 5: Global Market Value (US$ Million) Analysis by Region, 2019 to 2034

Figure 6: Global Market Volume (Units) Analysis by Region, 2019 to 2034

Figure 7: Global Market Value Share (%) and BPS Analysis by Region, 2024 to 2034

Figure 8: Global Market Y-o-Y Growth (%) Projections by Region, 2024 to 2034

Figure 9: Global Market Value (US$ Million) Analysis by Dose, 2019 to 2034

Figure 10: Global Market Volume (Units) Analysis by Dose, 2019 to 2034

Figure 11: Global Market Value Share (%) and BPS Analysis by Dose, 2024 to 2034

Figure 12: Global Market Y-o-Y Growth (%) Projections by Dose, 2024 to 2034

Figure 13: Global Market Value (US$ Million) Analysis by Material Type, 2019 to 2034

Figure 14: Global Market Volume (Units) Analysis by Material Type, 2019 to 2034

Figure 15: Global Market Value Share (%) and BPS Analysis by Material Type, 2024 to 2034

Figure 16: Global Market Y-o-Y Growth (%) Projections by Material Type, 2024 to 2034

Figure 17: Global Market Value (US$ Million) Analysis by End Use, 2019 to 2034

Figure 18: Global Market Volume (Units) Analysis by End Use, 2019 to 2034

Figure 19: Global Market Value Share (%) and BPS Analysis by End Use, 2024 to 2034

Figure 20: Global Market Y-o-Y Growth (%) Projections by End Use, 2024 to 2034

Figure 21: Global Market Attractiveness by Dose, 2024 to 2034

Figure 22: Global Market Attractiveness by Material Type, 2024 to 2034

Figure 23: Global Market Attractiveness by End Use, 2024 to 2034

Figure 24: Global Market Attractiveness by Region, 2024 to 2034

Figure 25: North America Market Value (US$ Million) by Dose, 2024 to 2034

Figure 26: North America Market Value (US$ Million) by Material Type, 2024 to 2034

Figure 27: North America Market Value (US$ Million) by End Use, 2024 to 2034

Figure 28: North America Market Value (US$ Million) by Country, 2024 to 2034

Figure 29: North America Market Value (US$ Million) Analysis by Country, 2019 to 2034

Figure 30: North America Market Volume (Units) Analysis by Country, 2019 to 2034

Figure 31: North America Market Value Share (%) and BPS Analysis by Country, 2024 to 2034

Figure 32: North America Market Y-o-Y Growth (%) Projections by Country, 2024 to 2034

Figure 33: North America Market Value (US$ Million) Analysis by Dose, 2019 to 2034

Figure 34: North America Market Volume (Units) Analysis by Dose, 2019 to 2034

Figure 35: North America Market Value Share (%) and BPS Analysis by Dose, 2024 to 2034

Figure 36: North America Market Y-o-Y Growth (%) Projections by Dose, 2024 to 2034

Figure 37: North America Market Value (US$ Million) Analysis by Material Type, 2019 to 2034

Figure 38: North America Market Volume (Units) Analysis by Material Type, 2019 to 2034

Figure 39: North America Market Value Share (%) and BPS Analysis by Material Type, 2024 to 2034

Figure 40: North America Market Y-o-Y Growth (%) Projections by Material Type, 2024 to 2034

Figure 41: North America Market Value (US$ Million) Analysis by End Use, 2019 to 2034

Figure 42: North America Market Volume (Units) Analysis by End Use, 2019 to 2034

Figure 43: North America Market Value Share (%) and BPS Analysis by End Use, 2024 to 2034

Figure 44: North America Market Y-o-Y Growth (%) Projections by End Use, 2024 to 2034

Figure 45: North America Market Attractiveness by Dose, 2024 to 2034

Figure 46: North America Market Attractiveness by Material Type, 2024 to 2034

Figure 47: North America Market Attractiveness by End Use, 2024 to 2034

Figure 48: North America Market Attractiveness by Country, 2024 to 2034

Figure 49: Latin America Market Value (US$ Million) by Dose, 2024 to 2034

Figure 50: Latin America Market Value (US$ Million) by Material Type, 2024 to 2034

Figure 51: Latin America Market Value (US$ Million) by End Use, 2024 to 2034

Figure 52: Latin America Market Value (US$ Million) by Country, 2024 to 2034

Figure 53: Latin America Market Value (US$ Million) Analysis by Country, 2019 to 2034

Figure 54: Latin America Market Volume (Units) Analysis by Country, 2019 to 2034

Figure 55: Latin America Market Value Share (%) and BPS Analysis by Country, 2024 to 2034

Figure 56: Latin America Market Y-o-Y Growth (%) Projections by Country, 2024 to 2034

Figure 57: Latin America Market Value (US$ Million) Analysis by Dose, 2019 to 2034

Figure 58: Latin America Market Volume (Units) Analysis by Dose, 2019 to 2034

Figure 59: Latin America Market Value Share (%) and BPS Analysis by Dose, 2024 to 2034

Figure 60: Latin America Market Y-o-Y Growth (%) Projections by Dose, 2024 to 2034

Figure 61: Latin America Market Value (US$ Million) Analysis by Material Type, 2019 to 2034

Figure 62: Latin America Market Volume (Units) Analysis by Material Type, 2019 to 2034

Figure 63: Latin America Market Value Share (%) and BPS Analysis by Material Type, 2024 to 2034

Figure 64: Latin America Market Y-o-Y Growth (%) Projections by Material Type, 2024 to 2034

Figure 65: Latin America Market Value (US$ Million) Analysis by End Use, 2019 to 2034

Figure 66: Latin America Market Volume (Units) Analysis by End Use, 2019 to 2034

Figure 67: Latin America Market Value Share (%) and BPS Analysis by End Use, 2024 to 2034

Figure 68: Latin America Market Y-o-Y Growth (%) Projections by End Use, 2024 to 2034

Figure 69: Latin America Market Attractiveness by Dose, 2024 to 2034

Figure 70: Latin America Market Attractiveness by Material Type, 2024 to 2034

Figure 71: Latin America Market Attractiveness by End Use, 2024 to 2034

Figure 72: Latin America Market Attractiveness by Country, 2024 to 2034

Figure 73: Western Europe Market Value (US$ Million) by Dose, 2024 to 2034

Figure 74: Western Europe Market Value (US$ Million) by Material Type, 2024 to 2034

Figure 75: Western Europe Market Value (US$ Million) by End Use, 2024 to 2034

Figure 76: Western Europe Market Value (US$ Million) by Country, 2024 to 2034

Figure 77: Western Europe Market Value (US$ Million) Analysis by Country, 2019 to 2034

Figure 78: Western Europe Market Volume (Units) Analysis by Country, 2019 to 2034

Figure 79: Western Europe Market Value Share (%) and BPS Analysis by Country, 2024 to 2034

Figure 80: Western Europe Market Y-o-Y Growth (%) Projections by Country, 2024 to 2034

Figure 81: Western Europe Market Value (US$ Million) Analysis by Dose, 2019 to 2034

Figure 82: Western Europe Market Volume (Units) Analysis by Dose, 2019 to 2034

Figure 83: Western Europe Market Value Share (%) and BPS Analysis by Dose, 2024 to 2034

Figure 84: Western Europe Market Y-o-Y Growth (%) Projections by Dose, 2024 to 2034

Figure 85: Western Europe Market Value (US$ Million) Analysis by Material Type, 2019 to 2034

Figure 86: Western Europe Market Volume (Units) Analysis by Material Type, 2019 to 2034

Figure 87: Western Europe Market Value Share (%) and BPS Analysis by Material Type, 2024 to 2034

Figure 88: Western Europe Market Y-o-Y Growth (%) Projections by Material Type, 2024 to 2034

Figure 89: Western Europe Market Value (US$ Million) Analysis by End Use, 2019 to 2034

Figure 90: Western Europe Market Volume (Units) Analysis by End Use, 2019 to 2034

Figure 91: Western Europe Market Value Share (%) and BPS Analysis by End Use, 2024 to 2034

Figure 92: Western Europe Market Y-o-Y Growth (%) Projections by End Use, 2024 to 2034

Figure 93: Western Europe Market Attractiveness by Dose, 2024 to 2034

Figure 94: Western Europe Market Attractiveness by Material Type, 2024 to 2034

Figure 95: Western Europe Market Attractiveness by End Use, 2024 to 2034

Figure 96: Western Europe Market Attractiveness by Country, 2024 to 2034

Figure 97: Eastern Europe Market Value (US$ Million) by Dose, 2024 to 2034

Figure 98: Eastern Europe Market Value (US$ Million) by Material Type, 2024 to 2034

Figure 99: Eastern Europe Market Value (US$ Million) by End Use, 2024 to 2034

Figure 100: Eastern Europe Market Value (US$ Million) by Country, 2024 to 2034

Figure 101: Eastern Europe Market Value (US$ Million) Analysis by Country, 2019 to 2034

Figure 102: Eastern Europe Market Volume (Units) Analysis by Country, 2019 to 2034

Figure 103: Eastern Europe Market Value Share (%) and BPS Analysis by Country, 2024 to 2034

Figure 104: Eastern Europe Market Y-o-Y Growth (%) Projections by Country, 2024 to 2034

Figure 105: Eastern Europe Market Value (US$ Million) Analysis by Dose, 2019 to 2034

Figure 106: Eastern Europe Market Volume (Units) Analysis by Dose, 2019 to 2034

Figure 107: Eastern Europe Market Value Share (%) and BPS Analysis by Dose, 2024 to 2034

Figure 108: Eastern Europe Market Y-o-Y Growth (%) Projections by Dose, 2024 to 2034

Figure 109: Eastern Europe Market Value (US$ Million) Analysis by Material Type, 2019 to 2034

Figure 110: Eastern Europe Market Volume (Units) Analysis by Material Type, 2019 to 2034

Figure 111: Eastern Europe Market Value Share (%) and BPS Analysis by Material Type, 2024 to 2034

Figure 112: Eastern Europe Market Y-o-Y Growth (%) Projections by Material Type, 2024 to 2034

Figure 113: Eastern Europe Market Value (US$ Million) Analysis by End Use, 2019 to 2034

Figure 114: Eastern Europe Market Volume (Units) Analysis by End Use, 2019 to 2034

Figure 115: Eastern Europe Market Value Share (%) and BPS Analysis by End Use, 2024 to 2034

Figure 116: Eastern Europe Market Y-o-Y Growth (%) Projections by End Use, 2024 to 2034

Figure 117: Eastern Europe Market Attractiveness by Dose, 2024 to 2034

Figure 118: Eastern Europe Market Attractiveness by Material Type, 2024 to 2034

Figure 119: Eastern Europe Market Attractiveness by End Use, 2024 to 2034

Figure 120: Eastern Europe Market Attractiveness by Country, 2024 to 2034

Figure 121: South Asia and Pacific Market Value (US$ Million) by Dose, 2024 to 2034

Figure 122: South Asia and Pacific Market Value (US$ Million) by Material Type, 2024 to 2034

Figure 123: South Asia and Pacific Market Value (US$ Million) by End Use, 2024 to 2034

Figure 124: South Asia and Pacific Market Value (US$ Million) by Country, 2024 to 2034

Figure 125: South Asia and Pacific Market Value (US$ Million) Analysis by Country, 2019 to 2034

Figure 126: South Asia and Pacific Market Volume (Units) Analysis by Country, 2019 to 2034

Figure 127: South Asia and Pacific Market Value Share (%) and BPS Analysis by Country, 2024 to 2034

Figure 128: South Asia and Pacific Market Y-o-Y Growth (%) Projections by Country, 2024 to 2034

Figure 129: South Asia and Pacific Market Value (US$ Million) Analysis by Dose, 2019 to 2034

Figure 130: South Asia and Pacific Market Volume (Units) Analysis by Dose, 2019 to 2034

Figure 131: South Asia and Pacific Market Value Share (%) and BPS Analysis by Dose, 2024 to 2034

Figure 132: South Asia and Pacific Market Y-o-Y Growth (%) Projections by Dose, 2024 to 2034

Figure 133: South Asia and Pacific Market Value (US$ Million) Analysis by Material Type, 2019 to 2034

Figure 134: South Asia and Pacific Market Volume (Units) Analysis by Material Type, 2019 to 2034

Figure 135: South Asia and Pacific Market Value Share (%) and BPS Analysis by Material Type, 2024 to 2034

Figure 136: South Asia and Pacific Market Y-o-Y Growth (%) Projections by Material Type, 2024 to 2034

Figure 137: South Asia and Pacific Market Value (US$ Million) Analysis by End Use, 2019 to 2034

Figure 138: South Asia and Pacific Market Volume (Units) Analysis by End Use, 2019 to 2034

Figure 139: South Asia and Pacific Market Value Share (%) and BPS Analysis by End Use, 2024 to 2034

Figure 140: South Asia and Pacific Market Y-o-Y Growth (%) Projections by End Use, 2024 to 2034

Figure 141: South Asia and Pacific Market Attractiveness by Dose, 2024 to 2034

Figure 142: South Asia and Pacific Market Attractiveness by Material Type, 2024 to 2034

Figure 143: South Asia and Pacific Market Attractiveness by End Use, 2024 to 2034

Figure 144: South Asia and Pacific Market Attractiveness by Country, 2024 to 2034

Figure 145: East Asia Market Value (US$ Million) by Dose, 2024 to 2034

Figure 146: East Asia Market Value (US$ Million) by Material Type, 2024 to 2034

Figure 147: East Asia Market Value (US$ Million) by End Use, 2024 to 2034

Figure 148: East Asia Market Value (US$ Million) by Country, 2024 to 2034

Figure 149: East Asia Market Value (US$ Million) Analysis by Country, 2019 to 2034

Figure 150: East Asia Market Volume (Units) Analysis by Country, 2019 to 2034

Figure 151: East Asia Market Value Share (%) and BPS Analysis by Country, 2024 to 2034

Figure 152: East Asia Market Y-o-Y Growth (%) Projections by Country, 2024 to 2034

Figure 153: East Asia Market Value (US$ Million) Analysis by Dose, 2019 to 2034

Figure 154: East Asia Market Volume (Units) Analysis by Dose, 2019 to 2034

Figure 155: East Asia Market Value Share (%) and BPS Analysis by Dose, 2024 to 2034

Figure 156: East Asia Market Y-o-Y Growth (%) Projections by Dose, 2024 to 2034

Figure 157: East Asia Market Value (US$ Million) Analysis by Material Type, 2019 to 2034

Figure 158: East Asia Market Volume (Units) Analysis by Material Type, 2019 to 2034

Figure 159: East Asia Market Value Share (%) and BPS Analysis by Material Type, 2024 to 2034

Figure 160: East Asia Market Y-o-Y Growth (%) Projections by Material Type, 2024 to 2034

Figure 161: East Asia Market Value (US$ Million) Analysis by End Use, 2019 to 2034

Figure 162: East Asia Market Volume (Units) Analysis by End Use, 2019 to 2034

Figure 163: East Asia Market Value Share (%) and BPS Analysis by End Use, 2024 to 2034

Figure 164: East Asia Market Y-o-Y Growth (%) Projections by End Use, 2024 to 2034

Figure 165: East Asia Market Attractiveness by Dose, 2024 to 2034

Figure 166: East Asia Market Attractiveness by Material Type, 2024 to 2034

Figure 167: East Asia Market Attractiveness by End Use, 2024 to 2034

Figure 168: East Asia Market Attractiveness by Country, 2024 to 2034

Figure 169: Middle East and Africa Market Value (US$ Million) by Dose, 2024 to 2034

Figure 170: Middle East and Africa Market Value (US$ Million) by Material Type, 2024 to 2034

Figure 171: Middle East and Africa Market Value (US$ Million) by End Use, 2024 to 2034

Figure 172: Middle East and Africa Market Value (US$ Million) by Country, 2024 to 2034

Figure 173: Middle East and Africa Market Value (US$ Million) Analysis by Country, 2019 to 2034

Figure 174: Middle East and Africa Market Volume (Units) Analysis by Country, 2019 to 2034

Figure 175: Middle East and Africa Market Value Share (%) and BPS Analysis by Country, 2024 to 2034

Figure 176: Middle East and Africa Market Y-o-Y Growth (%) Projections by Country, 2024 to 2034

Figure 177: Middle East and Africa Market Value (US$ Million) Analysis by Dose, 2019 to 2034

Figure 178: Middle East and Africa Market Volume (Units) Analysis by Dose, 2019 to 2034

Figure 179: Middle East and Africa Market Value Share (%) and BPS Analysis by Dose, 2024 to 2034

Figure 180: Middle East and Africa Market Y-o-Y Growth (%) Projections by Dose, 2024 to 2034

Figure 181: Middle East and Africa Market Value (US$ Million) Analysis by Material Type, 2019 to 2034

Figure 182: Middle East and Africa Market Volume (Units) Analysis by Material Type, 2019 to 2034

Figure 183: Middle East and Africa Market Value Share (%) and BPS Analysis by Material Type, 2024 to 2034

Figure 184: Middle East and Africa Market Y-o-Y Growth (%) Projections by Material Type, 2024 to 2034

Figure 185: Middle East and Africa Market Value (US$ Million) Analysis by End Use, 2019 to 2034

Figure 186: Middle East and Africa Market Volume (Units) Analysis by End Use, 2019 to 2034

Figure 187: Middle East and Africa Market Value Share (%) and BPS Analysis by End Use, 2024 to 2034

Figure 188: Middle East and Africa Market Y-o-Y Growth (%) Projections by End Use, 2024 to 2034

Figure 189: Middle East and Africa Market Attractiveness by Dose, 2024 to 2034

Figure 190: Middle East and Africa Market Attractiveness by Material Type, 2024 to 2034

Figure 191: Middle East and Africa Market Attractiveness by End Use, 2024 to 2034

Figure 192: Middle East and Africa Market Attractiveness by Country, 2024 to 2034

Recommendations

Packaging

Antiviral Drug Packaging Market

Published : April 2023

Packaging

Topical Drugs Packaging Market

Published : January 2023

Healthcare

Antimetabolite Drugs Market

Published : September 2022

Packaging

Parenteral Drugs Packaging Market

Published : July 2021

Explore Packaging Insights

View Reports

Ophthalmic Drug Packaging Market