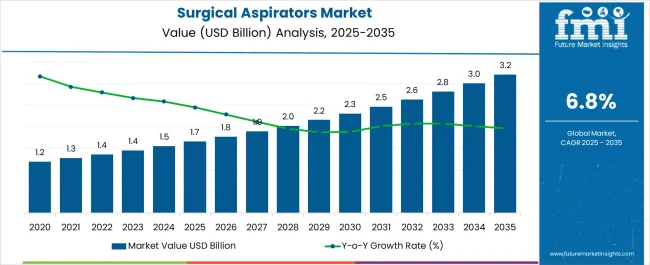
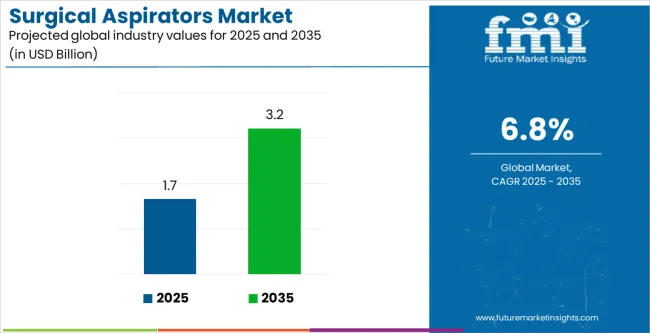
The Surgical Aspirators Market is estimated to be valued at USD 1.7 billion in 2025 and is projected to reach USD 3.2 billion by 2035, registering a compound annual growth rate (CAGR) of 6.8% over the forecast period.
| Metric | Value |
|---|---|
| Surgical Aspirators Market Estimated Value in (2025 E) | USD 1.7 billion |
| Surgical Aspirators Market Forecast Value in (2035 F) | USD 3.2 billion |
| Forecast CAGR (2025 to 2035) | 6.8% |
The surgical aspirators market is expanding due to the increasing number of surgical procedures, rising demand for efficient fluid management systems, and advancements in hospital infrastructure. The growing preference for minimally invasive surgeries and improved operating room technologies is accelerating the adoption of advanced aspirators.
Hospitals and surgical centers are emphasizing devices that provide precision, reliability, and enhanced safety during procedures. Additionally, the need for effective suction in both elective and emergency surgeries is contributing to consistent product demand.
Regulatory emphasis on patient safety and hygiene is also driving innovation in aspirator design and functionality. With healthcare providers focusing on operational efficiency and patient outcomes, the outlook for surgical aspirators remains positive, with opportunities for growth in portable, electric, and specialized solutions tailored to diverse surgical disciplines.
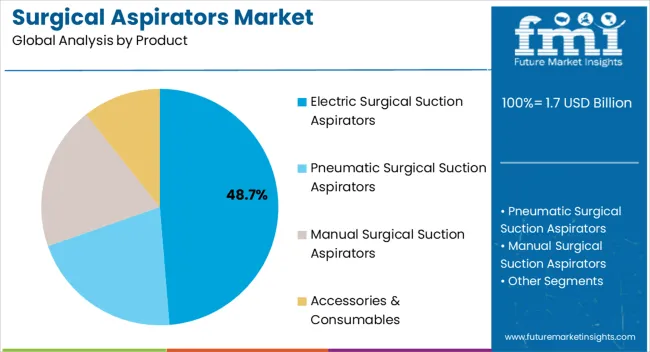
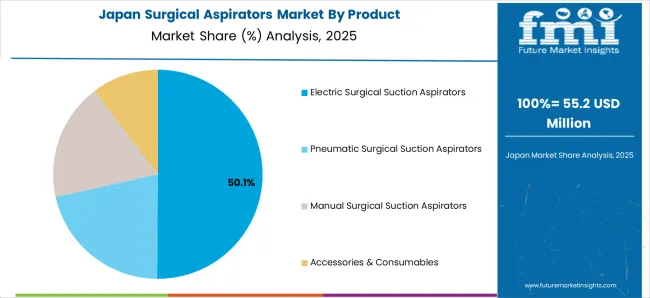
The electric surgical suction aspirators segment is projected to account for 48.70% of the total market revenue by 2025 within the product category, making it the leading segment. Growth has been supported by the reliability, consistent suction performance, and operational efficiency offered by electric models.
These devices are widely adopted in hospitals and clinics where continuous and powerful suction is critical for surgical precision. Advancements in motor efficiency, noise reduction, and ease of sterilization have further strengthened their position.
As healthcare facilities prioritize high performance and durable medical devices, electric surgical suction aspirators continue to lead the product category.
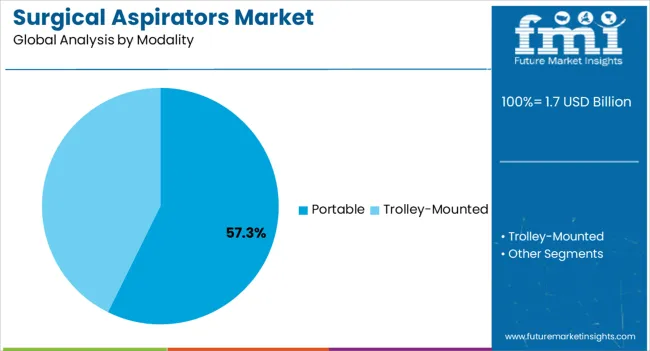
The portable modality segment is expected to hold 57.30% of the total market revenue by 2025, establishing it as the dominant modality. This share is driven by the growing demand for mobility, flexibility, and rapid deployment in both hospital and emergency care settings.
Portable aspirators provide ease of use in operating rooms, ambulatory surgical centers, and field environments, ensuring reliable performance during diverse medical procedures. Their compact size, battery backup options, and user friendly interfaces make them highly adaptable.
With healthcare delivery expanding into decentralized and mobile care, portable aspirators have gained strong traction, reinforcing their leadership in the modality segment.
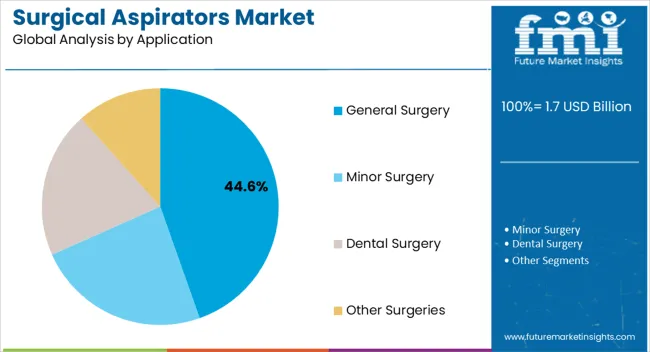
The general surgery application segment is anticipated to contribute 44.60% of overall market revenue by 2025, making it the largest application area. This dominance is associated with the wide range of procedures that require suction support, including abdominal, orthopedic, and cardiovascular surgeries.
The essential role of aspirators in maintaining clear surgical fields, preventing complications, and ensuring procedural efficiency has sustained their widespread use. Increasing surgical volumes worldwide, coupled with improvements in healthcare accessibility and operating room infrastructure, are reinforcing the reliance on aspirators in general surgery.
This has positioned the general surgery segment as the primary driver of demand in the surgical aspirators market.
From 2020 to 2025, the global surgical aspirators market experienced a CAGR of 8.5%, reaching a market size of USD 1.7 billion in 2025.
From 2020 to 2025, the worldwide surgical aspirators business has grown steadily as a result of numerous causes, including an increase in surgical operations, advances in medical technology, and growing healthcare expenses. The requirement for efficient suction devices in surgical settings to remove fluids, tissues, and other debris from the operation field has fueled the need for surgical aspirators.
Future Forecast for Surgical Aspirators Industry:
Looking ahead, the global surgical aspirators industry is expected to rise at a CAGR of 7.2% from 2025 to 2035. During the forecast period, the market size is expected to reach USD 3.20 Billion in 2035.
The trend towards minimally invasive surgeries is expected to continue. This shift in surgical approach offers benefits such as reduced recovery time, shorter hospital stays, and improved patient outcomes. Surgical aspirators designed specifically for minimally invasive procedures may see increased demand.
Surgical aspirators will almost certainly continue to benefit from continuous technology improvements, such as robotic suction and irrigation systems. During surgical operations, these technologies are replacing the traditional manually evacuation and irrigations carried out by the crew.
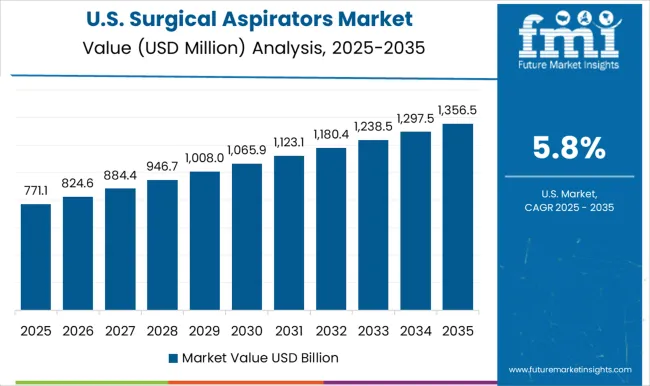
| Country | The United States |
|---|---|
| Market Size (USD million) by End of Forecast Period (2035) | USD 3.2 Million |
| CAGR % 2025 to End of Forecast (2035) | 6.7% |
The surgical aspirators industry in the United States is expected to reach a market share of USD 3.2 Million by 2035, expanding at a CAGR of 6.7%. The prevalence of chronic illnesses is projected to drive growth in the surgical aspirator market in the United States. According to Chronic Disease Control and Prevention (CDC) 2025, six out of ten US individuals have a chronic disease. Chronic diseases, such as cardiovascular illnesses, necessitate surgical procedures, fueling the demand for surgical aspirators.
| Country | The United Kingdom |
|---|---|
| Market Size (USD million) by End of Forecast Period (2035) | USD 58.7 million |
| CAGR % 2025 to End of Forecast (2035) | 5.3% |
The surgical aspirators industry in the United Kingdom is expected to reach a market share of USD 58.7 million, expanding at a CAGR of 5.3% during the forecast period. The market in the United Kingdom is expected to grow due to the increased focus on infection control. The UK healthcare system emphasized infection control measures, especially in surgical settings. Surgical aspirators are in high demand because they serve an important role in maintaining a sterile environment by eliminating fluids and reducing the risk of infection.
| Country | China |
|---|---|
| Market Size (USD million) by End of Forecast Period (2035) | USD 319.3 million |
| CAGR % 2025 to End of Forecast (2035) | 9.3% |
The surgical aspirators industry in China is anticipated to reach a market share of USD 319.3 million, moving at a CAGR of 9.3% during the forecast period due to the rising medical tourism. China has been a popular destination for medical tourism, and the government has established designated zones for medical tourism around the country. As a result, medical tourists seeking surgical operations add to the country's need for surgical aspirators.
| Country | Japan |
|---|---|
| Market Size (USD million) by End of Forecast Period (2035) | USD 221.2 million |
| CAGR % 2025 to End of Forecast (2035) | 8.9% |
The surgical aspirators industry in Japan is estimated to reach a market share of USD 221.2 million by 2035, thriving at a CAGR of 8.9%. The Japan market expanded throughout the forecast period due to expanding healthcare infrastructure. Japan's healthcare system is well-established, including hospitals, ambulatory surgery centers, and clinics. The market will be driven by the growth of healthcare infrastructure and an increase in the number of surgical operations.
| Country | South Korea |
|---|---|
| Market Size (USD million) by End of Forecast Period (2035) | USD 133.9 million |
| CAGR % 2025 to End of Forecast (2035) | 8.2% |
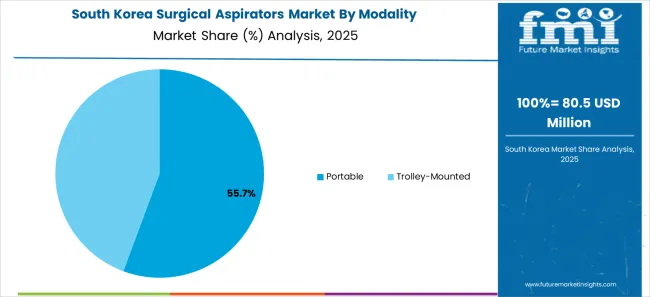
The surgical aspirators industry in South Korea is expected to reach a market share of USD 133.9 million, expanding at a CAGR of 8.2% during the forecast period. The number of surgical operations conducted has a strong correlation with the demand for surgical aspirators. As the population rises and medical developments continue, the number of procedures performed increases. As a result, higher surgical operations are increasing the need for surgical aspirators, propelling the market in the nation.
The cassette test devices is expected to dominate the surgical aspirators market industry with a CAGR of 7.4% from 2025 to 2035. This segment captures a significant market share in 2025 due to its increased efficiency, precision, and convenience in medical procedures.
Electric suction aspirators provide consistent and powerful suction, allowing for efficient removal of fluids and debris from the surgical site. They often offer adjustable suction levels, enabling surgeons to customize the suction force as per the procedures requirements. The improved performance and control contribute to the demand for electric surgical suction aspirators.
Trolley-Mounted dominated the surgical aspirators industry with a share of 55.5% in 2025. This segment captures a significant market share in 2025 due to its mobility and convenience along with the enhanced stability.
In the operating room, trolley-mounted equipment enable mobility and flexibility. These instruments are installed on a movable cart with wheels, allowing for simple mobility and positioning within the operating room. Furthermore, these devices offer stability during surgical procedures. They include characteristics like locking wheels and solid platforms that ensure the gadgets stay stable during the operations. Thus, these factors contribute to their demand in the healthcare setting as they provide practical solutions for efficient and effective suction.
General surgeries are expected to dominate the surgical aspirators market industry with a CAGR of 5.6% from 2025 to 2035. This segment captures a significant market share in 2025 as these devices enhance the surgical efficiency. By supporting a seamless workflow, surgical aspirators help to increase surgical efficiency. These devices aid in the surgical procedure by swiftly and effectively removing fluids and debris. Surgeons may operate more effectively without pauses or delays caused by fluid buildup, resulting in shorter surgical durations and less anesthesia time for patients.
The hospitals dominated the surgical aspirators industry with a share of 37.4% in 2025. This segment captures a significant market share in 2025.
Due to the increased use of surgical equipment in hospitals, the hospital segment is anticipated to dominate. The category is also projected to be driven by trends including the expanding use of robotic technology in surgery enhancing the outcomes of minimally invasive procedures. The hospital segment will continue to dominate as favorable reimbursement regulations for bariatric procedures are in place.
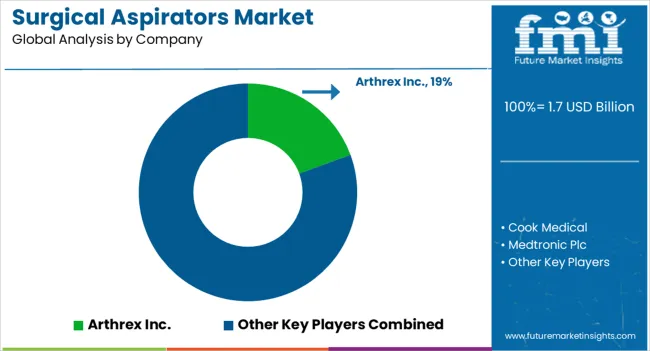
The key players in surgical aspirators industry employ several strategies to stay competitive. While specific strategies can vary among companies as companies based on their size, resources, target markets and overall business objectives may vary. Companies often employ a combination of various strategies to maintain their competitive position of the surgical aspirator market.
Key Strategies Adopted by the Players
Product Innovation
Companies make significant investments in research and development to bring new goods to market that offer improved efficiency, dependability, and cost-effectiveness. Companies may set themselves apart from rivals and adapt to clients' changing requirements thanks to product innovation.
Strategic Partnerships and Collaborations
Strategic partnerships and collaborations between leading organisations in the sector are frequently formed to take advantage of one another's advantages and broaden their market reach. These partnerships can provide businesses access to emerging markets and technology.
Expansion into Emerging Markets
The market for surgical aspirators is expanding significantly in developing nations like China and India. Important firms are creating local production facilities and bolstering their distribution networks in an effort to increase their market share.
Mergers and Acquisitions
In order to strengthen their market positions, increase the scope of their product offerings, and gain access to new markets, major companies in the surgical aspirators market frequently participate in mergers and acquisitions.
Key Developments in the Surgical Aspirators Market:
The global surgical aspirators market is estimated to be valued at USD 1.7 billion in 2025.
The market size for the surgical aspirators market is projected to reach USD 3.2 billion by 2035.
The surgical aspirators market is expected to grow at a 6.8% CAGR between 2025 and 2035.
The key product types in surgical aspirators market are electric surgical suction aspirators, pneumatic surgical suction aspirators, manual surgical suction aspirators and accessories & consumables.
In terms of modality, portable segment to command 57.3% share in the surgical aspirators market in 2025.


Our Research Products

The "Full Research Suite" delivers actionable market intel, deep dives on markets or technologies, so clients act faster, cut risk, and unlock growth.

The Leaderboard benchmarks and ranks top vendors, classifying them as Established Leaders, Leading Challengers, or Disruptors & Challengers.

Locates where complements amplify value and substitutes erode it, forecasting net impact by horizon

We deliver granular, decision-grade intel: market sizing, 5-year forecasts, pricing, adoption, usage, revenue, and operational KPIs—plus competitor tracking, regulation, and value chains—across 60 countries broadly.

Spot the shifts before they hit your P&L. We track inflection points, adoption curves, pricing moves, and ecosystem plays to show where demand is heading, why it is changing, and what to do next across high-growth markets and disruptive tech

Real-time reads of user behavior. We track shifting priorities, perceptions of today’s and next-gen services, and provider experience, then pace how fast tech moves from trial to adoption, blending buyer, consumer, and channel inputs with social signals (#WhySwitch, #UX).

Partner with our analyst team to build a custom report designed around your business priorities. From analysing market trends to assessing competitors or crafting bespoke datasets, we tailor insights to your needs.
Supplier Intelligence
Discovery & Profiling
Capacity & Footprint
Performance & Risk
Compliance & Governance
Commercial Readiness
Who Supplies Whom
Scorecards & Shortlists
Playbooks & Docs
Category Intelligence
Definition & Scope
Demand & Use Cases
Cost Drivers
Market Structure
Supply Chain Map
Trade & Policy
Operating Norms
Deliverables
Buyer Intelligence
Account Basics
Spend & Scope
Procurement Model
Vendor Requirements
Terms & Policies
Entry Strategy
Pain Points & Triggers
Outputs
Pricing Analysis
Benchmarks
Trends
Should-Cost
Indexation
Landed Cost
Commercial Terms
Deliverables
Brand Analysis
Positioning & Value Prop
Share & Presence
Customer Evidence
Go-to-Market
Digital & Reputation
Compliance & Trust
KPIs & Gaps
Outputs
Full Research Suite comprises of:
Market outlook & trends analysis
Interviews & case studies
Strategic recommendations
Vendor profiles & capabilities analysis
5-year forecasts
8 regions and 60+ country-level data splits
Market segment data splits
12 months of continuous data updates
DELIVERED AS:
PDF EXCEL ONLINE
Surgical Tourniquet Market Size and Share Forecast Outlook 2025 to 2035
Surgical Operating Microscope Market Forecast and Outlook 2025 to 2035
Surgical Heart Valves Market Size and Share Forecast Outlook 2025 to 2035
Surgical Robot Procedures Market Size and Share Forecast Outlook 2025 to 2035
Surgical Wound Care Market Size and Share Forecast Outlook 2025 to 2035
Surgical Retractors Market Size and Share Forecast Outlook 2025 to 2035
Surgical Drainage Devices Market Size and Share Forecast Outlook 2025 to 2035
Surgical Booms Market Insights - Size, Share & Industry Growth 2025 to 2035
Surgical Scissors Market Size and Share Forecast Outlook 2025 to 2035
Surgical Instruments Tracking System Market Growth - Trends & Forecast 2025 to 2035
Surgical Instruments Packaging Market Size, Share & Forecast 2025 to 2035
Surgical Monitors Market Analysis - Industry Insights & Forecast 2025 to 2035
Surgical Scalpels Market Trends – Growth & Forecast 2025-2035
Surgical Generators Market – Trends & Forecast 2025 to 2035
Surgical Gloves Market Trends - Size, Demand & Forecast 2025 to 2035
Surgical Clips Market Analysis - Size, Share & Forecast 2025 to 2035
Surgical Mask Market Insights - Growth & Forecast 2025 to 2035
Surgical Drapes Market Overview - Growth, Demand & Forecast 2025 to 2035
Surgical Stapling Device Market is segmented by product, Usage Type, Stapling Type, Indication and End User from 2025 to 2035
Key Companies & Market Share in the Surgical Scrub Sector

Thank you!
You will receive an email from our Business Development Manager. Please be sure to check your SPAM/JUNK folder too.
Chat With
MaRIA