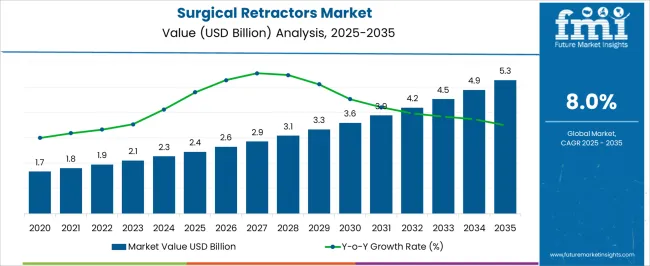
The Surgical Retractors Market is estimated to be valued at USD 2.4 billion in 2025 and is projected to reach USD 5.3 billion by 2035, registering a compound annual growth rate (CAGR) of 8.0% over the forecast period.
| Metric | Value |
|---|---|
| Surgical Retractors Market Estimated Value in (2025 E) | USD 2.4 billion |
| Surgical Retractors Market Forecast Value in (2035 F) | USD 5.3 billion |
| Forecast CAGR (2025 to 2035) | 8.0% |
The surgical retractors market is experiencing sustained growth driven by an increasing number of surgical procedures, advancements in minimally invasive techniques, and greater focus on procedural efficiency and patient safety. Hospitals and surgical centers are prioritizing instruments that provide clear visibility and access to the operative field while reducing tissue trauma.
The rise in complex procedures, particularly in neurosurgery and abdominal surgeries, is further fueling the need for reliable, ergonomic, and specialty-specific retractor systems. Technological innovations in material durability, sterilization compatibility, and surgeon-controlled designs have also elevated product adoption.
As healthcare infrastructure expands and elective surgeries resume globally, the demand for high-performance retractors is expected to accelerate. Overall, the market outlook remains optimistic with a strong emphasis on precision, safety, and surgical workflow optimization.
The market is segmented by Application, Product Type, Application Size, and End-use and region. By Application, the market is divided into Handheld and Self-retaining. In terms of Product Type, the market is classified into Abdominal retractor, Finger retractor, Nerve Retractor, Orthopedic Retractor, Rectal Retractor, Thoracic retractor, Ribbon retractor, and Other Product Types. Based on Application Size, the market is segmented into Neurosurgery, Wound closure, Reconstructive surgery, Cardiovascular, Orthopedic, Obstetrics and Gynecology (Ob/GYN), and Other Applications. By End-use, the market is divided into Hospitals, Ambulatory Surgical Centers, and Clinics. Regionally, the market is classified into North America, Latin America, Western Europe, Eastern Europe, Balkan & Baltic Countries, Russia & Belarus, Central Asia, East Asia, South Asia & Pacific, and the Middle East & Africa.
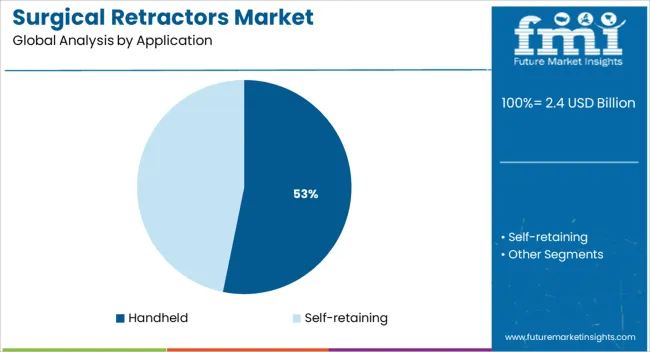
The handheld segment is anticipated to contribute 53.20% of the total surgical retractors market revenue by 2025, emerging as the dominant product category. This growth is attributed to their simplicity of use, broad procedural versatility, and cost effectiveness.
Handheld retractors are favored in both open and minimally invasive surgeries due to their lightweight design and ability to be manipulated directly by the surgical team. They do not require complex installations or external support systems, making them ideal for resource-limited settings and emergency procedures.
The continued preference among surgeons for tactile control and flexibility has reinforced the leadership of handheld retractors in various surgical disciplines.
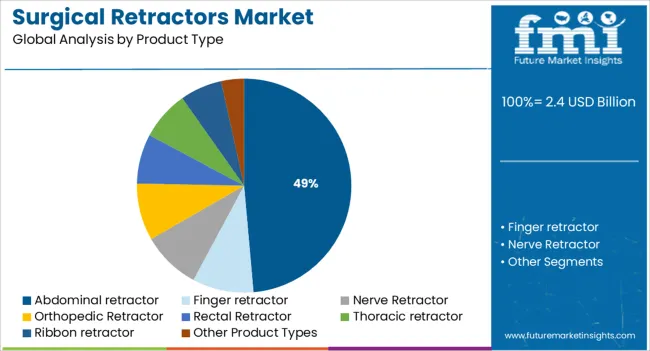
Abdominal retractors are projected to account for 48.60% of market revenue by 2025 within the application segment. Their dominance is supported by the high volume of abdominal procedures such as laparotomies, hernia repairs, and gastrointestinal surgeries.
These retractors are designed to provide optimal exposure of the abdominal cavity, ensuring unobstructed access to internal organs. The increasing prevalence of digestive and urological conditions requiring surgical intervention has also elevated their demand.
Abdominal retractors are valued for their strength, adjustable configuration, and ability to maintain consistent retraction without causing tissue damage, positioning them as essential instruments in general and specialized abdominal surgeries.
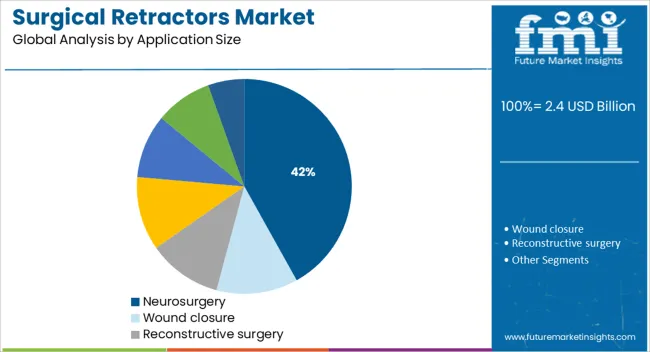
The neurosurgery segment is expected to represent 41.90% of the overall market by 2025 within the application size category. The complexity and delicacy of neurosurgical procedures necessitate retractors that provide stable, precise, and minimally traumatic tissue separation.
As the prevalence of neurological disorders rises and technological capabilities in neurosurgery expand, the use of specialized retractors has intensified. These retractors support delicate manipulations in cranial and spinal surgeries, where maintaining tissue integrity is critical.
Continued innovations in retractors tailored for microsurgical environments and advanced visualization systems are further strengthening their adoption. As a result, neurosurgery remains a key contributor to market growth in surgical retractors.
The global market for the Surgical Retractors Market expanded at a CAGR of 5.9% from 2020 to 2024. Around 2.3 Million people die in traffic accidents annually, according to the World Health Organization's Global Status Report on Road Safety 2024. In addition, 20 to 50 Million more persons suffer non-fatal injuries, with many of them leading to disabilities.
The sale of surgical retractor products globally is significantly impacted by this. The USA will continue to be the largest user of the Surgical Retractors Market throughout the analysis period accounting for over USD 663 Billion absolute dollar opportunity in the coming 10-year period.
The Centers for Disease Control records that close to 32% of all newborns were born in the USA in 2020. The operation, which occurs over 1 million times every year across Europe, is among the most commonly performed medical procedures worldwide.
More than 19 percent of newborns in Australia and 21% of children across the globe were delivered via C-section that year. The global market for surgical retractors has grown significantly due in large part to C-section surgery.
One of the most significant factors resulting in the worldwide growth of surgical retractors is the increase in instances of injury. In 14 national registrations from 50 countries, around 507,000 surgical procedures are carried out every year, according to the International Federation of Societies for Surgery of the Hand (IFSO) Global Registry Report 2024. This number has been increasing continuously, hence it will positively impact the surgical retractor market.
The overall population over the age of 60 is expected to rise from 9.2% in 1990 to 11.7% in 2013 and then further to 21.1% by 2050, according to the Department of Economic and Social Affairs Population Division. The likelihood of chronic diseases is increased in people over the age of 60. Surgery is the key treatment for long-term diseases. These elements will aid in the market's rapid expansion.
The regulatory body's main goal is to reduce any dangers brought on by manufacturers' noncompliance with standards. The design, manufacture, testing, labeling, promotion, and sales of the devices, as well as the keeping of records and traceability by the maker, are all subject to the probable denigration of the items' fit, form, and function.
Being governed by federal, state, and local environmental laws and regulations, manufacturers must also clean up contamination linked to the production of these materials at facilities and off-site disposal sites. These laws and regulations cover the emission, discharge, use, storage, and disposal of hazardous materials. Due to the high cost of this setting and compliance is essential. The additional expense is reflected in the product's retail price, which ranges from USD 150 to USD 350.
The price of raw surgical stainless steel 304 reached an eleven-year high of about USD 3 per kilogram. When compared to the figure from March 2024, this implies an increase of more than 45%. The manufacturer's income has been significantly reduced as a result of the fluctuation in the price of raw materials. This is one of the factors limiting the growth of the surgical retractor market.
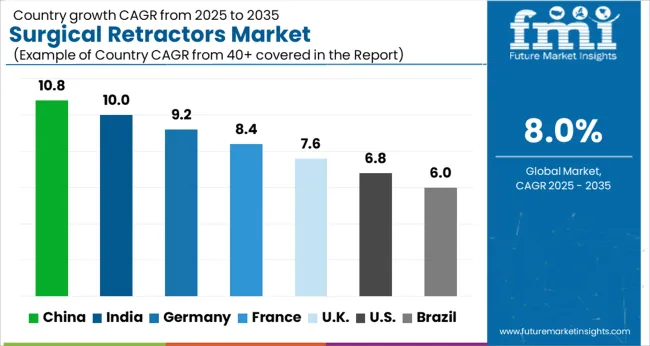
Due to an expanding surgical population and an improved healthcare infrastructure, Asia Pacific is predicted to account for the highest CAGR. The key causes of this expansion are the rise in preventive procedures and the prevalence of chronic conditions like cancer, diabetes, and autoimmune diseases.
The All India Institute of Medical Science (AIIMS) reports that the institute performed approximately 0.2 Million procedures, making it the institution that performed the most surgeries globally that year. In addition, West China Medical Center of Sichuan University Hospital in China is the second-largest hospital in the world after Chang Gung Memorial Hospital in Taiwan, which has 10 thousand beds.
The use of specialized retractors in a variety of unusual surgeries and market strategies adopted by the key market players to expand their businesses in the Asia-Pacific region, such as those used by companies like MPM Medical Supply, which operates out of Germany and exports high-quality stainless steel retractors made there, is anticipated to drive the market's overall growth over the forecast period.
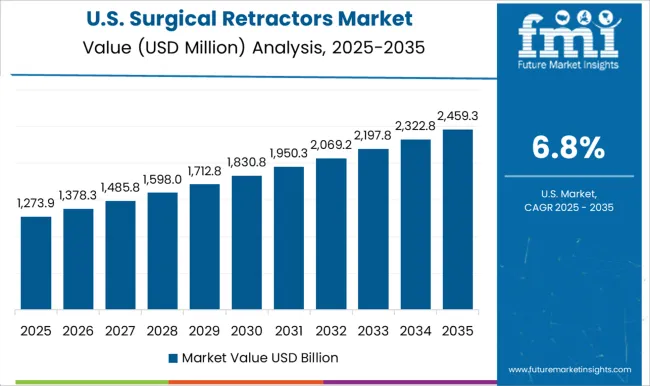
The USA will account for over USD 5.3 Billion of the global Surgical Retractors Market by the end of the forecast year 2035. The expense of healthcare in the USA increased from 4% of the GDP in the 1960s to almost 19.7% of the GDP in 2024. Nearly 15% of Americans have chronic renal disease, according to the Centers for Disease Control and Prevention. As a result, it is anticipated that the increasing incidence of chronic diseases would increase the requirement for surgical intervention, which will increase demand for surgical retractors and create an absolute dollar growth potential of USD 663 Million.
The market in the United Kingdom is projected to reach a valuation of USD 1609 Million by 2035. Growing at a CAGR of 6.9% from 2025 to 2035, the market in the country is expected to register an absolute dollar opportunity of USD 6.9%.
In Japan, the market is expected to grow at a CAGR of 9.3% from 2025 to 2035 to reach a valuation of USD 202 Million by 2035. The market is further expected to gross an absolute dollar opportunity of 118 Million during the forecast period.
The market in South Korea is expected to reach a valuation of USD 82.4 Million by 2035. Growing at a CAGR of 8% from 2025 to 2035, the market is projected to garner an absolute dollar opportunity of USD 44 Million.
The growth through the Neurosurgery segment expanded at a CAGR of 7.3% over the last four years (2020 to 2024). With a projected CAGR of 10.7% for the forecasted years. According to the World Federation of Neurology, these illnesses claim the lives of 12.0% of all neurology patients each year.
The WHO also projects an increase in the number of Disability-Adjusted Life Years lost globally from 1.7 Million in 2020 to 5.3.0 Million in 2035 as a result of neurological illnesses. One of the main and only therapy options for neurological issues is surgery. The dominance of the neurosurgery segment in the surgical retractor market is mostly due to the rise in neurological surgeries and the strong demand for surgical retractors specifically made for these procedures.
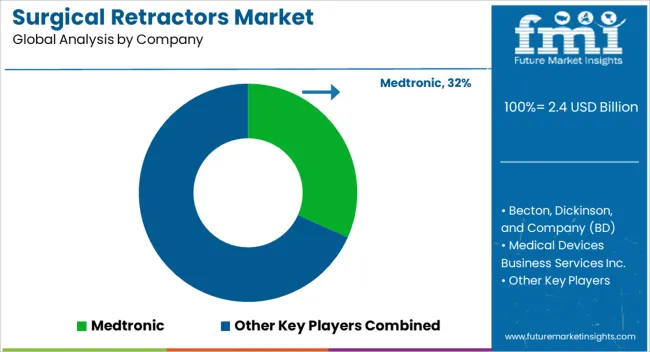
The key companies operating in the Surgical Retractors Market include Baxter International Inc., B. Braun Melsungen AG, The Cooper Companies, Inc., Terumo Corporation, Teleflex Incorporated, Medtronic Plc., Medline Industries INC., Johnson & Johnson, NOVO NORDISK, Integra Lifesciences Holdings Corporation, HENKE-SASS WOLF, Henry Schein, Inc., Dickinson and Company, Conmed Corporation, SKLAR Surgical Instruments., Teleflex Incorporated., Olympus Corporation, Thompson Surgical, Arthrex, Inc., Microsurgical Technology, STRYKER CORPORATION, GLOBUS MEDICAL, Applied Medical Resources Corporation, Innomed, Inc., LiNA Medical ApS, Vivo Surgical Private Limited, and Changzhou Haiers Medical Devices Co. Ltd.
Some of the recent developments by key providers of the Surgical Retractors Market are as follows:
Similarly, recent developments related to companies manufacturing Surgical Retractors Market have been tracked by the team at Future Market Insights, which is available in the full report.
The global surgical retractors market is estimated to be valued at USD 2.4 billion in 2025.
The market size for the surgical retractors market is projected to reach USD 5.3 billion by 2035.
The surgical retractors market is expected to grow at a 8.0% CAGR between 2025 and 2035.
The key product types in surgical retractors market are handheld and self-retaining.
In terms of product type, abdominal retractor segment to command 48.6% share in the surgical retractors market in 2025.


Our Research Products

The "Full Research Suite" delivers actionable market intel, deep dives on markets or technologies, so clients act faster, cut risk, and unlock growth.

The Leaderboard benchmarks and ranks top vendors, classifying them as Established Leaders, Leading Challengers, or Disruptors & Challengers.

Locates where complements amplify value and substitutes erode it, forecasting net impact by horizon

We deliver granular, decision-grade intel: market sizing, 5-year forecasts, pricing, adoption, usage, revenue, and operational KPIs—plus competitor tracking, regulation, and value chains—across 60 countries broadly.

Spot the shifts before they hit your P&L. We track inflection points, adoption curves, pricing moves, and ecosystem plays to show where demand is heading, why it is changing, and what to do next across high-growth markets and disruptive tech

Real-time reads of user behavior. We track shifting priorities, perceptions of today’s and next-gen services, and provider experience, then pace how fast tech moves from trial to adoption, blending buyer, consumer, and channel inputs with social signals (#WhySwitch, #UX).

Partner with our analyst team to build a custom report designed around your business priorities. From analysing market trends to assessing competitors or crafting bespoke datasets, we tailor insights to your needs.
Supplier Intelligence
Discovery & Profiling
Capacity & Footprint
Performance & Risk
Compliance & Governance
Commercial Readiness
Who Supplies Whom
Scorecards & Shortlists
Playbooks & Docs
Category Intelligence
Definition & Scope
Demand & Use Cases
Cost Drivers
Market Structure
Supply Chain Map
Trade & Policy
Operating Norms
Deliverables
Buyer Intelligence
Account Basics
Spend & Scope
Procurement Model
Vendor Requirements
Terms & Policies
Entry Strategy
Pain Points & Triggers
Outputs
Pricing Analysis
Benchmarks
Trends
Should-Cost
Indexation
Landed Cost
Commercial Terms
Deliverables
Brand Analysis
Positioning & Value Prop
Share & Presence
Customer Evidence
Go-to-Market
Digital & Reputation
Compliance & Trust
KPIs & Gaps
Outputs
Full Research Suite comprises of:
Market outlook & trends analysis
Interviews & case studies
Strategic recommendations
Vendor profiles & capabilities analysis
5-year forecasts
8 regions and 60+ country-level data splits
Market segment data splits
12 months of continuous data updates
DELIVERED AS:
PDF EXCEL ONLINE
Surgical Tourniquet Market Size and Share Forecast Outlook 2025 to 2035
Surgical Operating Microscope Market Forecast and Outlook 2025 to 2035
Surgical Heart Valves Market Size and Share Forecast Outlook 2025 to 2035
Surgical Aspirators Market Size and Share Forecast Outlook 2025 to 2035
Surgical Robot Procedures Market Size and Share Forecast Outlook 2025 to 2035
Surgical Wound Care Market Size and Share Forecast Outlook 2025 to 2035
Surgical Drainage Devices Market Size and Share Forecast Outlook 2025 to 2035
Surgical Booms Market Insights - Size, Share & Industry Growth 2025 to 2035
Surgical Scissors Market Size and Share Forecast Outlook 2025 to 2035
Surgical Instruments Tracking System Market Growth - Trends & Forecast 2025 to 2035
Surgical Instruments Packaging Market Size, Share & Forecast 2025 to 2035
Surgical Monitors Market Analysis - Industry Insights & Forecast 2025 to 2035
Surgical Scalpels Market Trends – Growth & Forecast 2025-2035
Surgical Generators Market – Trends & Forecast 2025 to 2035
Surgical Clips Market Analysis - Size, Share & Forecast 2025 to 2035
Surgical Gloves Market Trends - Size, Demand & Forecast 2025 to 2035
Surgical Mask Market Insights - Growth & Forecast 2025 to 2035
Surgical Drapes Market Overview - Growth, Demand & Forecast 2025 to 2035
Surgical Stapling Device Market is segmented by product, Usage Type, Stapling Type, Indication and End User from 2025 to 2035
Key Companies & Market Share in the Surgical Scrub Sector

Thank you!
You will receive an email from our Business Development Manager. Please be sure to check your SPAM/JUNK folder too.
Chat With
MaRIA