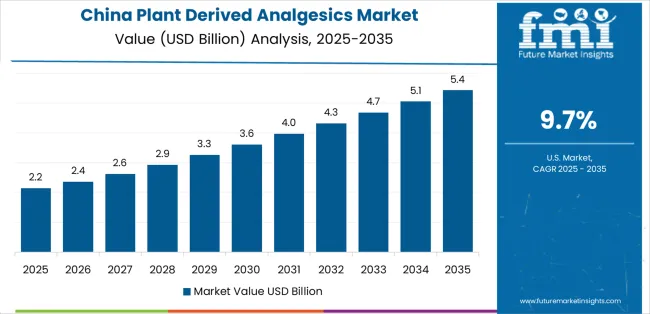
Plant Derived Analgesics Market Forecast and Outlook (2025-2035)

The plant derived analgesics market stands at the threshold of a decade-long expansion trajectory that promises to reshape pain management technology and natural therapeutic solutions. The market's journey from USD 4,262.9 million in 2025 to USD 8,543.8 million by 2035 represents substantial growth, demonstrating the accelerating adoption of botanical pain relief compounds and natural medicine optimization across pharmaceutical manufacturing, healthcare delivery, and consumer wellness sectors.

The first half of the decade (2025-2030) will witness the market climbing from USD 4,262.9 million to approximately USD 6,035.0 million, adding USD 1,772.1 million in value, which constitutes 41% of the total forecast growth period. This phase will be characterized by the rapid adoption of cannabinoid-based analgesics, driven by increasing regulatory acceptance and the growing need for alternative pain management solutions worldwide. Enhanced extraction technologies and standardized formulations will become standard expectations rather than premium options.

The latter half (2030-2035) will witness continued growth from USD 6,035.0 million to USD 8,543.8 million, representing an addition of USD 2,508.8 million or 59% of the decade's expansion. This period will be defined by mass market penetration of natural pain management alternatives, integration with comprehensive healthcare protocols, and seamless compatibility with existing pharmaceutical infrastructure. The market trajectory signals fundamental shifts in how healthcare providers approach pain treatment and medication selection, with participants positioned to benefit from growing demand across multiple product types and therapeutic applications.
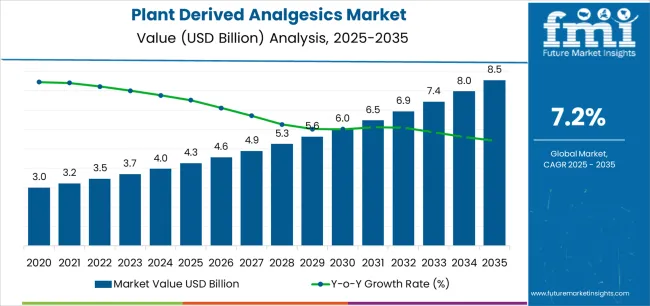
Plant Derived Analgesics Market Market Value Analysis

Quick Stats for Plant Derived Analgesics Market

  • Plant Derived Analgesics Market Value (2025): USD 4,262.9 million
  • Plant Derived Analgesics Market Forecast Value (2035): USD 8,543.8 million
  • Plant Derived Analgesics Market Forecast CAGR: 7.2%
  • Leading Product Type in Plant Derived Analgesics Market: Morphine
  • Key Growth Regions in Plant Derived Analgesics Market: East Asia, South Asia Pacific, and Western Europe
  • Key Players in Plant Derived Analgesics Market: Pfizer Inc., Mallinckrodt Pharmaceuticals, Teva Pharmaceuticals, Johnson & Johnson, NOW Foods
Period Primary Revenue Buckets Share Notes
Today Prescription opioid analgesics (morphine, codeine) 52% Hospital-driven, chronic pain management
Over-the-counter plant derivatives 24% Salicin, curcumin, topical formulations
CBD & cannabinoid products 14% Growing regulatory acceptance, wellness trend
Compounded formulations 10% Custom dosing, specialized applications
Future (3-5 yrs) Cannabinoid therapeutics 35-40% Medical cannabis, CBD prescriptions, regulatory expansion
Next-gen opioid alternatives 25-30% Abuse-deterrent formulations, targeted delivery
Topical & transdermal systems 15-20% Localized pain relief, sustained release patches
Nutraceutical pain management 12-16% Curcumin, botanical blends, preventive wellness
Digital health integration 8-12% Smart dosing, pain monitoring apps, telemedicine prescriptions
Personalized formulations 5-8% Genetic profiling, customized combinations

Plant Derived Analgesics Market Key Takeaways

At-a-Glance Metrics

Metric Value
Market Value (2025) USD 4,262.9 million
Market Forecast (2035) USD 8,543.8 million
Growth Rate 7.2% CAGR
Leading Technology Morphine
Primary Application Chronic Pain Management

The market demonstrates strong fundamentals with morphine-based products capturing a dominant share through proven analgesic efficacy and pain management optimization. Chronic pain management applications drive primary demand, supported by increasing prevalence of pain conditions and therapeutic requirement needs. Geographic expansion remains concentrated in developed markets with established pharmaceutical infrastructure, while emerging economies show accelerating adoption rates driven by healthcare access initiatives and rising pain management standards.

Imperatives for Stakeholders in Plant Derived Analgesics Market

Design for efficacy, not just natural origin

  • Offer complete solutions: analgesic compound + dosing guidance + patient education + monitoring protocols + adverse event management.
  • Preconfigured workflows: pain assessment tools, titration schedules, combination therapy protocols, and opioid-sparing strategies for clinical optimization.

Regulatory compliance readiness

  • GMP manufacturing standards, controlled substance protocols, pharmacovigilance systems, and quality assurance (standardized extracts, potency verification, contaminant testing).

Evidence-based medicine approach

  • Clinical trial documentation, comparative effectiveness studies, real-world evidence generation, and outcome measurement frameworks for therapeutic validation.

Value-based pricing models

  • Clear medication price + transparent access programs (patient assistance, insurance coverage, generic alternatives); education services for prescriber training and patient adherence support.

Segmental Analysis

Primary Classification: The market segments by product type into morphine, codeine, salicin, cannabinoids (CBD), and curcumin, representing the evolution from traditional opiate analgesics to diverse botanical pain management solutions for comprehensive therapeutic optimization.

Secondary Classification: Formulation type segmentation divides the market into tablets, capsules, creams, injectable forms, and oils sectors, reflecting distinct requirements for administration routes, onset speed, and duration standards.

Tertiary Classification: Application segmentation covers chronic pain management, acute pain relief, post-surgical pain, and neuropathic pain, sales channel segmentation spans hospitals, clinics, retail sales, online sales, and hypermarkets & supermarkets, while regional distribution covers North America, Latin America, Western Europe, Eastern Europe, East Asia, South Asia Pacific, and Middle East & Africa.

The segmentation structure reveals technology progression from traditional opiate medications toward diverse botanical alternatives with enhanced safety profiles and targeted mechanisms, while application diversity spans from hospital-based acute care to consumer self-care applications requiring accessible plant-based solutions.
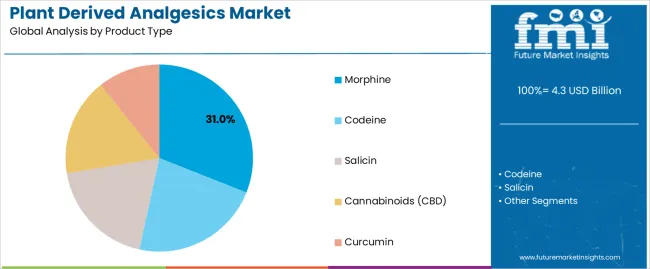
By Product Type, the Morphine Segment Accounts for Dominant Market Share\

Plant Derived Analgesics Market Analysis By Product Type

Market Position: Morphine commands the leading position in the plant derived analgesics market with 31% market share through superior analgesic features, including potent pain relief, well-established clinical protocols, and comprehensive healthcare integration that enable medical facilities to achieve optimal pain control across diverse acute and chronic pain environments.

Value Drivers: The segment benefits from healthcare provider preference for proven analgesic systems that provide consistent pain management performance, dose flexibility, and therapeutic reliability without requiring extensive patient education. Advanced formulation features enable controlled-release delivery, parenteral administration, and integration with existing pain protocols, where efficacy and safety monitoring represent critical treatment requirements.

Competitive Advantages: Morphine products differentiate through proven clinical effectiveness, extensive safety documentation, and integration with multimodal pain management approaches that enhance patient outcomes while maintaining optimal comfort standards suitable for diverse surgical, cancer, and chronic pain applications.

Key market characteristics:

  • Advanced formulation designs with optimized pharmacokinetic profiles and delivery system capabilities
  • Enhanced therapeutic effectiveness, enabling pain relief across wide intensity spectrum with dose-dependent analgesia
  • Healthcare compatibility, including hospital formulary placement, insurance coverage, and clinical guideline integration for pain management operations

Codeine Shows Moderate Analgesic Applications

Codeine maintains a 17% market position in the plant derived analgesics market due to its moderate potency properties and combination therapy advantages. These products appeal to healthcare providers requiring mild-to-moderate pain relief with lower abuse potential for outpatient applications. Market presence is sustained by prescription volumes, emphasizing accessible pain management and cough suppression through established pharmaceutical formulations.

Salicin Demonstrates Natural Alternative Growth

Salicin products capture 17% market share through natural anti-inflammatory requirements in over-the-counter applications, traditional medicine usage, and consumer preference for botanical alternatives. These consumers demand gentle pain relief capable of addressing musculoskeletal discomfort while providing natural product positioning and herbal medicine heritage.

Cannabinoids (CBD) Show Emerging Therapeutic Leadership

Cannabinoids (CBD) account for 17% market share through expanding regulatory acceptance in pain management, anti-inflammatory applications, and wellness positioning requiring alternative pain relief mechanisms with favorable safety profiles for diverse pain conditions.

Curcumin Maintains Nutraceutical Presence

Curcumin products capture 17% market share through anti-inflammatory properties, joint health applications, and preventive wellness approaches requiring natural pain prevention with antioxidant benefits and disease-modifying potential.
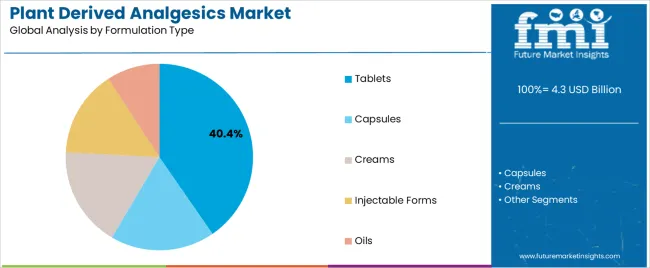
By Formulation Type, the Tablets Segment Shows Fastest Growth

Plant Derived Analgesics Market Analysis By Formulation Type

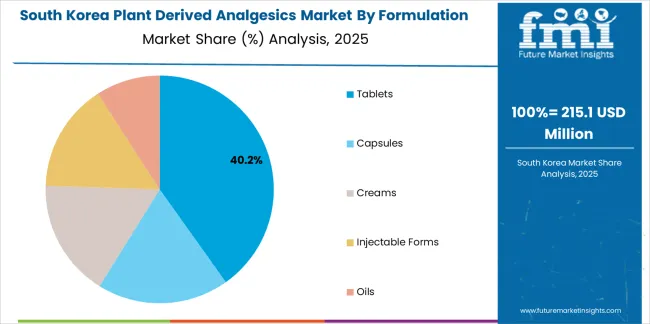
Market Context: Tablets demonstrate the highest market presence with 40.4% share due to widespread adoption of oral solid dosage forms and increasing focus on patient convenience, dose accuracy, and medication adherence applications that maximize therapeutic compliance while maintaining manufacturing efficiency standards.

Appeal Factors: Healthcare providers and patients prioritize formulation convenience, storage stability, and dosing precision that enables reliable medication administration across multiple therapeutic scenarios. The segment benefits from substantial pharmaceutical investment and controlled-release technologies that emphasize tablet development for pain management and therapeutic optimization applications.

Growth Drivers: Extended-release tablet technologies incorporate abuse-deterrent features as standard formulation elements for opioid products, while patient preference increases demand for oral administration capabilities that comply with convenience standards and minimize administration complexity.

Market Challenges: Varying absorption profiles and onset times may limit tablet suitability across different pain intensity scenarios or patient populations.

Application dynamics include:

  • Strong growth in controlled-release formulations and abuse-deterrent technologies requiring advanced tablet capabilities
  • Increasing adoption in chronic pain management and maintenance therapy applications for stable dosing regimens
  • Rising integration with medication adherence monitoring for therapeutic optimization and compliance assurance

Capsules Maintain Alternative Oral Delivery

Capsules capture 20% market share through alternative oral dosage requirements in rapid-onset applications, liquid-fill formulations, and patients preferring capsule swallowing over tablet administration.

Creams Show Topical Application Growth

Creams account for 15% market share, including localized pain relief applications, musculoskeletal conditions, and patients seeking non-systemic exposure with targeted pain management at application sites.

Injectable Forms Drive Acute Care

Injectable formulations maintain 15% market share through hospital acute pain management, post-surgical analgesia, and emergency department applications requiring rapid onset and precise dose titration for severe pain control.

Oils Lead Alternative Delivery

Oils capture 9.6% market share through sublingual administration, cannabinoid delivery, and alternative medicine applications requiring flexible dosing with rapid absorption characteristics.
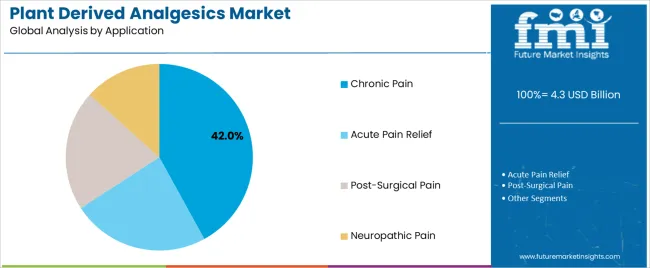
By Application, Chronic Pain Management Leads Market Demand

Plant Derived Analgesics Market Analysis By Application

Market Position: Chronic Pain Management commands significant market presence with 42% share through long-term therapeutic requirements that demand sustained analgesic efficacy for persistent pain conditions affecting daily functioning.

Value Drivers: This application category addresses growing prevalence of chronic conditions including arthritis, back pain, neuropathy, and cancer-related pain requiring continuous medication with acceptable long-term safety profiles.

Growth Characteristics: The segment benefits from aging demographics, increasing pain disorder prevalence, and healthcare system emphasis on quality of life improvement that support sustained analgesic demand and pain management protocol advancement.

Acute Pain Relief Shows Short-Term Applications

Acute Pain Relief captures 28% market share through immediate pain management in injuries, dental procedures, minor surgeries, and short-duration painful conditions requiring temporary analgesic intervention.

Post-Surgical Pain Maintains Perioperative Focus

Post-Surgical Pain applications account for 18% market share, including orthopedic procedures, abdominal surgeries, and recovery periods requiring multimodal analgesia with opioid-sparing approaches for optimal pain control and rehabilitation.

Neuropathic Pain Shows Specialized Treatment

Neuropathic Pain maintains 12% market share through diabetic neuropathy, postherpetic neuralgia, and nerve injury conditions requiring specialized analgesics with distinct mechanisms addressing nerve pain characteristics.
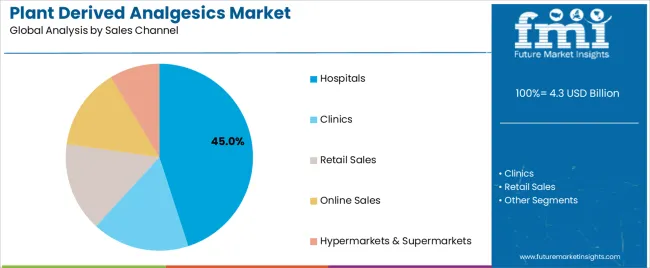
By Sales Channel, Hospitals Lead Healthcare Distribution

Plant Derived Analgesics Market Analysis By Sales Channel

Market Position: Hospitals command dominant market presence with 45% share through inpatient care requirements that demand comprehensive analgesic formularies for acute and post-operative pain management.

Value Drivers: This channel provides controlled medication access, professional administration, and comprehensive pain protocols that meet requirements for severe pain management while maintaining safety monitoring.

Growth Characteristics: The segment benefits from surgical volume growth, pain service expansion, and enhanced recovery protocols that support hospital analgesic utilization and multimodal pain management adoption.

Clinics Show Outpatient Growth

Clinics capture 22% market share through outpatient pain management, primary care prescribing, and specialty pain centers requiring analgesic options for ambulatory care and chronic condition management.

Retail Sales Maintain Consumer Access

Retail sales account for 18% market share, including community pharmacies, prescription dispensing, and over-the-counter products enabling convenient analgesic access for consumer pain management needs.

Online Sales Drive Digital Distribution

Online sales capture 10% market share through e-pharmacy growth, telemedicine prescriptions, and direct-to-consumer channels providing convenient access with home delivery for chronic medication needs.

Hypermarkets & Supermarkets Show OTC Presence

Hypermarkets & Supermarkets maintain 5% market share through over-the-counter analgesic sales, consumer products, and accessible pain relief options for minor pain conditions and self-care applications.

What are the Drivers, Restraints, and Key Trends of the Plant Derived Analgesics Market?

Category Factor Impact Why It Matters
Driver Chronic pain prevalence & aging demographics (arthritis, back pain, cancer-related pain) ★★★★★ Growing chronic pain burden drives analgesic demand; aging populations require long-term pain management with plant-derived alternatives offering favorable safety profiles.
Driver Opioid crisis & demand for alternatives (abuse concerns, overdose deaths, addiction risks) ★★★★★ Opioid epidemic creates urgency for safer alternatives; healthcare providers seek plant-based options with lower addiction potential while maintaining efficacy.
Driver Cannabis legalization & CBD acceptance (medical marijuana laws, hemp-derived products) ★★★★★ Expanding legal frameworks enable cannabinoid market growth; regulatory acceptance drives research, product development, and therapeutic integration.
Restraint Regulatory complexity & controlled substance scheduling (DEA regulations, prescription requirements) ★★★★☆ Opioid analgesics face strict regulatory controls; prescription requirements, dispensing limitations, and monitoring programs create access barriers and compliance burdens.
Restraint Efficacy concerns & standardization challenges (variable potency, extraction inconsistency) ★★★☆☆ Botanical products face standardization issues; inconsistent active compound concentrations and bioavailability variations limit clinical adoption and therapeutic reliability.
Trend Precision medicine & pharmacogenomics (genetic testing, personalized dosing, metabolism profiling) ★★★★★ Genetic variability affects opioid metabolism; CYP2D6 testing enables personalized codeine and morphine dosing for optimized efficacy and safety.
Trend Multimodal pain management protocols (combination therapy, opioid-sparing approaches, regional anesthesia) ★★★★☆ Evidence-based protocols reduce opioid dependence; plant-derived analgesics integrated with NSAIDs, regional blocks, and non-pharmacological approaches for comprehensive care.

Analysis of the Plant Derived Analgesics Market by Key Country

The plant derived analgesics market demonstrates varied regional dynamics with Growth Leaders including China (9.7% growth rate) and India (9.0% growth rate) driving expansion through healthcare infrastructure development and traditional medicine integration programs. Steady Performers encompass Germany (8.3% growth rate), United States (6.8% growth rate), and developed regions, benefiting from established pharmaceutical industries and pain management protocol advancement. Emerging Markets feature developing regions where healthcare access initiatives and medication affordability support consistent growth patterns.

Regional synthesis reveals East Asian markets leading adoption through traditional medicine heritage and pharmaceutical manufacturing development, while European countries maintain strong expansion supported by natural medicine acceptance and cannabis legalization trends. North American markets show moderate growth driven by opioid alternative seeking and medical cannabis programs.
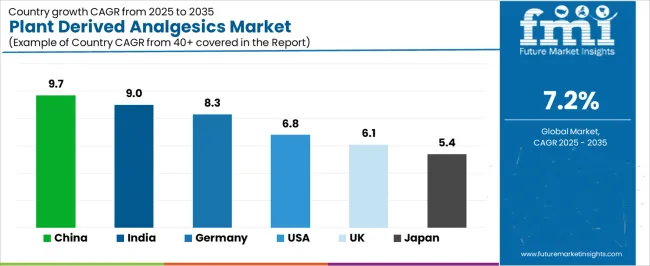
Plant Derived Analgesics Market Cagr Analysis By Country

Region/Country 2025-2035 Growth How to win What to watch out
China 9.7% Focus on traditional medicine integration; manufacturing scale Quality control issues; export restrictions
India 9.0% Lead with affordable generics; ayurvedic combinations Regulatory inconsistency; counterfeit products
Germany 8.3% Emphasize cannabis therapeutics; quality standards Strict regulations; reimbursement barriers
United States 6.8% Push opioid alternatives; evidence generation DEA scheduling; litigation risks; pricing pressure
U.K. 6.1% Offer NHS-approved options; cost-effectiveness Formulary restrictions; budget constraints
Japan 5.4% Premium quality; safety documentation Conservative prescribing; traditional preferences

China Drives Fastest Market Growth

Plant Derived Analgesics Market Country Value Analysis

China establishes fastest market growth through comprehensive healthcare expansion programs and traditional medicine integration development, incorporating plant derived analgesics as standard components in pharmaceutical formularies and traditional Chinese medicine applications. The country's 9.7% growth rate reflects government initiatives promoting healthcare access and traditional medicine modernization that encourage the use of botanical analgesics in hospital and community healthcare facilities. Growth concentrates in major urban centers, including Beijing, Shanghai, and Guangzhou, where pharmaceutical manufacturing showcases integrated plant-based analgesic production that appeals to healthcare providers seeking traditional medicine compatibility and modern pharmaceutical standardization applications.

Chinese pharmaceutical manufacturers are developing botanical analgesic solutions that combine traditional herbal medicine knowledge with modern extraction technologies, including standardized formulations and quality-controlled production. Distribution channels through hospital pharmacies and retail chains expand market access, while government healthcare programs support adoption across diverse pain management and traditional medicine segments.

Strategic Market Indicators:

  • Hospital and traditional medicine facilities leading adoption with 68% utilization rate in pain management and integrated medicine sectors
  • Government healthcare expansion providing substantial coverage for essential analgesic medications including plant-based options
  • Domestic manufacturers capturing 52% market share through production scale and traditional medicine integration capabilities
  • Traditional Chinese medicine modernization creating demand for standardized botanical analgesics in clinical applications

India Emerges as High-Growth Market

In Mumbai, Delhi, and Bangalore, healthcare facilities and pharmaceutical companies are implementing plant derived analgesics as standard therapeutic options for pain management and ayurvedic medicine applications, driven by increasing healthcare access and government pharmaceutical programs that emphasize the importance of affordable medication availability. The market holds a 9.0% growth rate, supported by government generic medicine initiatives and traditional medicine system integration programs that promote botanical analgesics for healthcare and ayurvedic facilities. Indian healthcare providers are adopting analgesic products that provide cost-effective pain management and traditional medicine compatibility, particularly appealing in regions where medication affordability and traditional therapy acceptance represent critical healthcare requirements.

Market expansion benefits from growing generic pharmaceutical manufacturing and ayurvedic medicine infrastructure that enable widespread production of plant-based analgesics for domestic and export applications. Technology adoption follows patterns established in pharmaceutical development, where affordability and traditional medicine integration drive product acceptance and market deployment.

Market Intelligence Brief:

  • Generic pharmaceutical and ayurvedic medicine segments driving initial adoption with 62% annual growth in botanical analgesic production
  • Government healthcare programs emphasizing affordable medication access for pain management across diverse populations
  • Pharmaceutical manufacturers partnering with traditional medicine producers for integrated product development
  • Export markets developing for cost-effective plant derived analgesics targeting price-sensitive global markets

Germany Maintains Market Leadership

Germany establishes market leadership through comprehensive medical cannabis programs and advanced pharmaceutical infrastructure development, integrating plant derived analgesics across pain management and palliative care applications. The country's 8.3% growth rate reflects established pharmaceutical industry relationships and progressive cannabis policy adoption that supports widespread use of botanical analgesics in hospital and outpatient facilities. Growth concentrates in major healthcare centers, including Berlin, Munich, and Hamburg, where pain management expertise showcases mature plant-based analgesic deployment that appeals to physicians seeking evidence-based botanical options and cannabis therapeutic applications.

German pharmaceutical providers leverage established distribution networks and comprehensive clinical evidence capabilities, including cannabis prescription programs and quality assurance systems that create prescriber confidence and patient access. The market benefits from mature healthcare standards and pain management guidelines that support botanical analgesic adoption while encouraging research advancement and therapeutic optimization.

Market Intelligence Brief:

  • Pain management and palliative care facilities maintaining 85% awareness rate with growing botanical analgesic prescribing
  • Established medical cannabis framework providing structured access for qualified patients with chronic pain conditions
  • Pharmaceutical distributors capturing 70% market share through quality assurance and regulatory compliance expertise
  • Research programs expanding clinical evidence for plant-based analgesics in multimodal pain management protocols

United States Shows Opioid Alternative Focus

United States demonstrates growing plant derived analgesics adoption with 6.8% growth rate, driven by opioid crisis response and alternative pain management seeking. Major healthcare markets including California, Texas, and Florida showcase pain management innovation where plant-based analgesics provide options for chronic pain patients seeking opioid alternatives and physicians implementing opioid-sparing protocols to address addiction concerns and improve patient safety. The market benefits from medical cannabis legalization in multiple states, substantial pain management research, and growing consumer demand for natural health products. American healthcare providers prioritize evidence-based efficacy, regulatory compliance, and integration with comprehensive pain management approaches.

Distribution patterns favor established pharmaceutical channels with controlled substance expertise, while medical cannabis dispensaries serve qualified patients through state-regulated programs. Market growth concentrates in chronic pain and palliative care segments where botanical alternatives address opioid concerns while maintaining analgesic efficacy.

Market Intelligence Brief:

  • Pain management segment representing 58% of botanical analgesic prescriptions with focus on chronic non-cancer pain
  • Medical cannabis programs driving 42% market growth in states with legal frameworks for therapeutic cannabinoid access
  • Opioid-sparing initiatives creating healthcare system demand for effective plant-based alternatives with favorable safety profiles
  • Consumer wellness trends supporting over-the-counter botanical pain relief products including curcumin and CBD formulations

United Kingdom Shows NHS Integration

United Kingdom's healthcare market demonstrates moderate plant derived analgesics adoption with 6.1% growth rate, supported by NHS pain management programs and medical cannabis framework development. Major healthcare regions including London, Manchester, and Birmingham showcase pain service development where botanical analgesics provide treatment options for chronic pain patients within structured clinical pathways and specialist pain clinic protocols. The market benefits from established pharmaceutical distribution, growing medical cannabis prescribing, and evidence-based pain management guidelines emphasizing multimodal approaches.

British healthcare providers prioritize cost-effectiveness, clinical evidence, and formulary approval for medication adoption. Distribution channels through NHS pharmacies and specialist pain services expand access for qualified patients meeting clinical criteria.

Strategic Market Considerations:
  • NHS pain services and palliative care leading adoption with focus on chronic pain and cancer-related pain management
  • Medical cannabis framework enabling specialist prescribing for qualified patients after conventional treatment failure
  • NICE guidance influence driving evidence requirements for botanical analgesic adoption in clinical pathways
  • Cost-effectiveness considerations affecting formulary inclusion decisions for newer plant-based pain medications

Japan Shows Conservative Healthcare Adoption

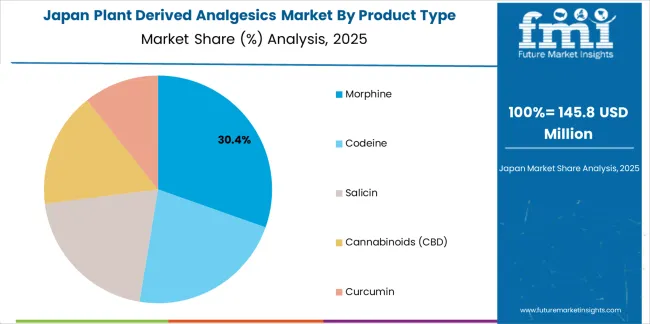
Plant Derived Analgesics Market Japan Market Share Analysis By Product Type

Japan's market expansion benefits from aging population pain management needs, including chronic pain in elderly populations and cancer care, with healthcare programs increasingly recognizing botanical analgesics for specific therapeutic applications. The country maintains a 5.4% growth rate, driven by demographic pressures and gradual acceptance of alternative pain management approaches, including botanical options with established safety documentation.

Market dynamics focus on pharmaceutical-grade botanical products that balance therapeutic efficacy with rigorous quality standards important to Japanese healthcare regulations. Growing chronic disease prevalence creates continued demand for diverse analgesic options in healthcare infrastructure and pain management program development.

Strategic Market Considerations:
  • Geriatric and palliative care segments showing interest in botanical analgesics with favorable side effect profiles
  • Cultural preferences emphasizing proven safety and quality documentation over alternative medicine positioning
  • Pharmaceutical market dominated by established manufacturers with regulatory expertise and quality reputations
  • Gradual policy evolution regarding cannabis-based medicines creating potential future market opportunities

Europe Market Split by Country

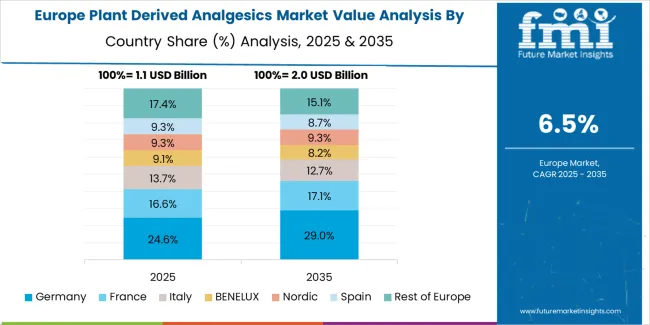
Plant Derived Analgesics Market Europe Country Market Share Analysis, 2025 & 2035

The plant derived analgesics market in Europe is projected to grow from USD 1,492.4 million in 2025 to USD 2,847.6 million by 2035, registering a CAGR of 6.7% over the forecast period. Germany is expected to maintain its leadership position with a 32.8% market share in 2025, supported by its advanced medical cannabis infrastructure and major pharmaceutical manufacturing centers in North Rhine-Westphalia, Bavaria, and Baden-Württemberg.

United Kingdom follows with a 23.4% share in 2025, driven by comprehensive NHS pain management programs and specialist cannabis prescribing framework development. France holds a 18.6% share through hospital pain services and emerging medical cannabis pilot programs. Italy commands a 13.7% share, while Spain accounts for 11.5% in 2025. The rest of Europe region is anticipated to gain momentum, expanding its collective share from 6.9% to 8.2% by 2035, attributed to increasing plant-based analgesic adoption in Nordic countries and emerging Eastern European markets implementing pain management modernization programs.
South Korea Shows Pharmaceutical Development

Plant Derived Analgesics Market South Korea Market Share Analysis By Formulation Type

South Korea demonstrates emerging plant derived analgesics adoption with 7.4% growth rate, driven by pharmaceutical innovation and healthcare system modernization. Major healthcare centers including Seoul, Busan, and Incheon showcase research hospitals where botanical analgesic development explores traditional Korean medicine integration with modern pharmaceutical formulations to address chronic pain conditions through culturally appropriate therapeutic approaches. The market benefits from advanced pharmaceutical manufacturing, growing chronic disease burden, and research interest in botanical medicine optimization.

Korean healthcare providers prioritize evidence-based efficacy, safety documentation, and integration with conventional pain management protocols. Market growth reflects both pharmaceutical industry innovation and gradual healthcare system acceptance of botanical alternatives. Distribution channels through hospital pharmacies and healthcare institutions serve medical applications, while growing interest in preventive wellness creates consumer market opportunities. Research partnerships between Korean pharmaceutical companies and traditional medicine institutions facilitate botanical analgesic development tailored to local healthcare needs and regulatory requirements including standardized herbal extracts and modern delivery systems for traditional medicinal plants with analgesic properties.
Competitive Landscape of the Plant Derived Analgesics Market

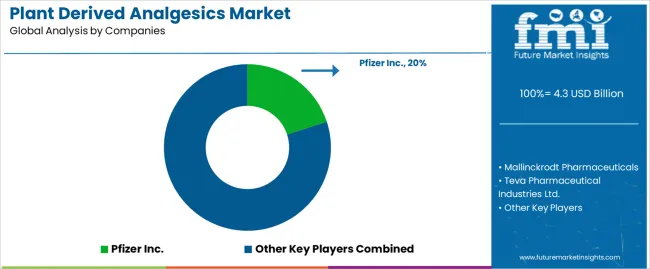
Plant Derived Analgesics Market Analysis By Company

The plant derived analgesics market demonstrates moderately consolidated competitive dynamics with approximately 40-60 active pharmaceutical manufacturers globally, where top 5 players control 55-60% revenue share through established product portfolios, regulatory expertise, and healthcare provider relationships. Market leadership requires balancing multiple capabilities including botanical sourcing, extraction technology, pharmaceutical formulation, regulatory compliance, and clinical evidence generation across diverse therapeutic and consumer segments.

Structure: Competitive landscape divides between established pharmaceutical companies with comprehensive analgesic portfolios including plant-derived options, specialized botanical medicine manufacturers focused on natural pain relief, generic pharmaceutical companies producing off-patent plant analgesics, and emerging cannabis-focused companies developing cannabinoid therapeutics. Traditional pharmaceutical leaders maintain advantage through regulatory expertise and healthcare system relationships, while botanical specialists differentiate through extraction technology, standardization capabilities, and natural product positioning.

Leadership is maintained through: extensive distribution networks, regulatory compliance capabilities, clinical evidence portfolios, and healthcare provider relationships (medical education programs, formulary inclusion, prescription support, patient assistance programs).

What's commoditizing: generic morphine and codeine formulations, basic curcumin supplements, and standard CBD oils without differentiation or clinical validation.

Margin Opportunities: abuse-deterrent opioid formulations, pharmaceutical-grade cannabinoid medicines, novel delivery systems (transdermal patches, sublingual films), combination products with synergistic botanicals, personalized pain medicine services, and comprehensive pain management programs integrating plant-based options.

Stakeholder What they actually control Typical strengths Typical blind spots
Major pharmaceutical companies Opioid manufacturing, regulatory expertise, distribution scale Established products, healthcare relationships, quality systems Innovation speed; natural product positioning; cannabis entry
Generic manufacturers Cost-effective production, regulatory pathways, volume capacity Pricing competitiveness, manufacturing efficiency, market access Brand differentiation; premium positioning; novel formulations
Botanical medicine specialists Extraction technology, standardization expertise, natural positioning Quality botanical sourcing, traditional medicine knowledge, consumer trust Pharmaceutical regulations; clinical evidence; prescription market
Cannabis companies Cannabinoid expertise, cultivation control, novel products Innovation capability, consumer engagement, alternative channel Traditional healthcare access; regulatory complexity; evidence gaps
Nutraceutical brands Consumer marketing, retail distribution, wellness positioning Brand recognition, direct-to-consumer capability, lifestyle integration Pharmaceutical standards; prescriber relationships; efficacy evidence

Market competition intensifies around regulatory compliance, clinical evidence generation, and differentiated formulation development. Companies investing in abuse-deterrent technologies, pharmaceutical-grade cannabinoid medicines, and comprehensive clinical programs position themselves advantageously for sustained market share gains. Success increasingly depends on balancing botanical authenticity with pharmaceutical rigor and evidence-based medicine requirements that drive prescriber confidence and healthcare system adoption across diverse pain management applications.

Key Players in the Plant Derived Analgesics Market

  • Pfizer Inc.
  • Mallinckrodt Pharmaceuticals
  • Teva Pharmaceutical Industries Ltd.
  • Johnson & Johnson
  • NOW Foods
  • Purdue Pharma L.P.
  • Sun Pharmaceutical Industries Ltd.
  • Endo Pharmaceuticals Inc.
  • GW Pharmaceuticals (Jazz Pharmaceuticals)
  • Canopy Growth Corporation
  • Charlotte's Web Holdings, Inc.
  • Tilray Brands, Inc.
  • Curaleaf Holdings, Inc.
  • Hikma Pharmaceuticals PLC
  • Amneal Pharmaceuticals, Inc.

Scope of the Report

Item Value
Quantitative Units USD 4,262.9 million
Product Type Morphine, Codeine, Salicin, Cannabinoids (CBD), Curcumin
Formulation Type Tablets, Capsules, Creams, Injectable Forms, Oils
Application Chronic Pain Management, Acute Pain Relief, Post-Surgical Pain, Neuropathic Pain
Sales Channel Hospitals, Clinics, Retail Sales, Online Sales, Hypermarkets & Supermarkets
Regions Covered North America, Latin America, Western Europe, Eastern Europe, East Asia, South Asia Pacific, Middle East & Africa
Countries Covered China, India, Germany, United States, United Kingdom, Japan, South Korea, France, Canada, Australia, and 30+ additional countries
Key Companies Profiled Pfizer Inc., Mallinckrodt Pharmaceuticals, Teva Pharmaceutical Industries Ltd., Johnson & Johnson, NOW Foods, Purdue Pharma L.P., Sun Pharmaceutical Industries Ltd., Endo Pharmaceuticals Inc., GW Pharmaceuticals
Additional Attributes Dollar sales by product type and application categories, regional adoption trends across East Asia, North America, and Western Europe, competitive landscape with pharmaceutical manufacturers and botanical medicine suppliers, healthcare provider preferences for analgesic efficacy and safety profiles, integration with pain management protocols and multimodal therapy approaches, innovations in extraction technology and formulation development, and advancement of plant-based analgesics with enhanced performance and pain relief optimization capabilities.

Plant Derived Analgesics Market by Segments

Product Type:

  • Morphine
  • Codeine
  • Salicin
  • Cannabinoids (CBD)
  • Curcumin

Formulation Type:

  • Tablets
  • Capsules
  • Creams
  • Injectable Forms
  • Oils

Application:

  • Chronic Pain Management
  • Acute Pain Relief
  • Post-Surgical Pain
  • Neuropathic Pain

Sales Channel:

  • Hospitals
  • Clinics
  • Retail Sales
  • Online Sales
  • Hypermarkets & Supermarkets

Region:

  • North America
    • United States
    • Canada
    • Mexico
  • Latin America
    • Brazil
    • Argentina
    • Rest of Latin America
  • Western Europe
    • Germany
    • United Kingdom
    • France
    • Italy
    • Spain
    • Nordic
    • BENELUX
    • Rest of Western Europe
  • Eastern Europe
    • Russia
    • Poland
    • Rest of Eastern Europe
  • East Asia
    • China
    • Japan
    • South Korea
  • South Asia Pacific
    • India
    • ASEAN
    • Australia & New Zealand
    • Rest of South Asia Pacific
  • Middle East & Africa
    • Kingdom of Saudi Arabia
    • Other GCC Countries
    • Turkey
    • South Africa
    • Other African Union
    • Rest of Middle East & Africa

Frequently Asked Questions

How big is the plant derived analgesics market in 2025?

The global plant derived analgesics market is estimated to be valued at USD 4.3 billion in 2025.

What will be the size of plant derived analgesics market in 2035?

The market size for the plant derived analgesics market is projected to reach USD 8,543.8 billion by 2035.

How much will be the plant derived analgesics market growth between 2025 and 2035?

The plant derived analgesics market is expected to grow at a 7.2% CAGR between 2025 and 2035.

What are the key product types in the plant derived analgesics market?

The key product types in plant derived analgesics market are morphine, codeine, salicin, cannabinoids (cbd) and curcumin.

Which formulation type segment to contribute significant share in the plant derived analgesics market in 2025?

In terms of formulation type, tablets segment to command 40.4% share in the plant derived analgesics market in 2025.

Table of Content

  1. Executive Summary
    • Global Market Outlook
    • Demand to side Trends
    • Supply to side Trends
    • Technology Roadmap Analysis
    • Analysis and Recommendations
  2. Market Overview
    • Market Coverage / Taxonomy
    • Market Definition / Scope / Limitations
  3. Market Background
    • Market Dynamics
      • Drivers
      • Restraints
      • Opportunity
      • Trends
    • Scenario Forecast
      • Demand in Optimistic Scenario
      • Demand in Likely Scenario
      • Demand in Conservative Scenario
    • Opportunity Map Analysis
    • Product Life Cycle Analysis
    • Supply Chain Analysis
    • Investment Feasibility Matrix
    • Value Chain Analysis
    • PESTLE and Porter’s Analysis
    • Regulatory Landscape
    • Regional Parent Market Outlook
    • Production and Consumption Statistics
    • Import and Export Statistics
  4. Global Market Analysis 2020 to 2024 and Forecast, 2025 to 2035
    • Historical Market Size Value (USD Million) Analysis, 2020 to 2024
    • Current and Future Market Size Value (USD Million) Projections, 2025 to 2035
      • Y to o to Y Growth Trend Analysis
      • Absolute $ Opportunity Analysis
  5. Global Market Pricing Analysis 2020 to 2024 and Forecast 2025 to 2035
  6. Global Market Analysis 2020 to 2024 and Forecast 2025 to 2035, By Product Type
    • Introduction / Key Findings
    • Historical Market Size Value (USD Million) Analysis By Product Type , 2020 to 2024
    • Current and Future Market Size Value (USD Million) Analysis and Forecast By Product Type , 2025 to 2035
      • Morphine
      • Codeine
      • Salicin
      • Cannabinoids (CBD)
      • Curcumin
    • Y to o to Y Growth Trend Analysis By Product Type , 2020 to 2024
    • Absolute $ Opportunity Analysis By Product Type , 2025 to 2035
  7. Global Market Analysis 2020 to 2024 and Forecast 2025 to 2035, By Formulation Type
    • Introduction / Key Findings
    • Historical Market Size Value (USD Million) Analysis By Formulation Type, 2020 to 2024
    • Current and Future Market Size Value (USD Million) Analysis and Forecast By Formulation Type, 2025 to 2035
      • Tablets
      • Capsules
      • Creams
      • Injectable Forms
      • Oils
    • Y to o to Y Growth Trend Analysis By Formulation Type, 2020 to 2024
    • Absolute $ Opportunity Analysis By Formulation Type, 2025 to 2035
  8. Global Market Analysis 2020 to 2024 and Forecast 2025 to 2035, By Application
    • Introduction / Key Findings
    • Historical Market Size Value (USD Million) Analysis By Application, 2020 to 2024
    • Current and Future Market Size Value (USD Million) Analysis and Forecast By Application, 2025 to 2035
      • Chronic Pain
      • Acute Pain Relief
      • Post-Surgical Pain
      • Neuropathic Pain
    • Y to o to Y Growth Trend Analysis By Application, 2020 to 2024
    • Absolute $ Opportunity Analysis By Application, 2025 to 2035
  9. Global Market Analysis 2020 to 2024 and Forecast 2025 to 2035, By Sales Channel
    • Introduction / Key Findings
    • Historical Market Size Value (USD Million) Analysis By Sales Channel, 2020 to 2024
    • Current and Future Market Size Value (USD Million) Analysis and Forecast By Sales Channel, 2025 to 2035
      • Hospitals
      • Clinics
      • Retail Sales
      • Online Sales
      • Hypermarkets & Supermarkets
    • Y to o to Y Growth Trend Analysis By Sales Channel, 2020 to 2024
    • Absolute $ Opportunity Analysis By Sales Channel, 2025 to 2035
  10. Global Market Analysis 2020 to 2024 and Forecast 2025 to 2035, By Region
    • Introduction
    • Historical Market Size Value (USD Million) Analysis By Region, 2020 to 2024
    • Current Market Size Value (USD Million) Analysis and Forecast By Region, 2025 to 2035
      • North America
      • Latin America
      • Western Europe
      • Eastern Europe
      • East Asia
      • South Asia and Pacific
      • Middle East & Africa
    • Market Attractiveness Analysis By Region
  11. North America Market Analysis 2020 to 2024 and Forecast 2025 to 2035, By Country
    • Historical Market Size Value (USD Million) Trend Analysis By Market Taxonomy, 2020 to 2024
    • Market Size Value (USD Million) Forecast By Market Taxonomy, 2025 to 2035
      • By Country
        • USA
        • Canada
        • Mexico
      • By Product Type
      • By Formulation Type
      • By Application
      • By Sales Channel
    • Market Attractiveness Analysis
      • By Country
      • By Product Type
      • By Formulation Type
      • By Application
      • By Sales Channel
    • Key Takeaways
  12. Latin America Market Analysis 2020 to 2024 and Forecast 2025 to 2035, By Country
    • Historical Market Size Value (USD Million) Trend Analysis By Market Taxonomy, 2020 to 2024
    • Market Size Value (USD Million) Forecast By Market Taxonomy, 2025 to 2035
      • By Country
        • Brazil
        • Chile
        • Rest of Latin America
      • By Product Type
      • By Formulation Type
      • By Application
      • By Sales Channel
    • Market Attractiveness Analysis
      • By Country
      • By Product Type
      • By Formulation Type
      • By Application
      • By Sales Channel
    • Key Takeaways
  13. Western Europe Market Analysis 2020 to 2024 and Forecast 2025 to 2035, By Country
    • Historical Market Size Value (USD Million) Trend Analysis By Market Taxonomy, 2020 to 2024
    • Market Size Value (USD Million) Forecast By Market Taxonomy, 2025 to 2035
      • By Country
        • Germany
        • UK
        • Italy
        • Spain
        • France
        • Nordic
        • BENELUX
        • Rest of Western Europe
      • By Product Type
      • By Formulation Type
      • By Application
      • By Sales Channel
    • Market Attractiveness Analysis
      • By Country
      • By Product Type
      • By Formulation Type
      • By Application
      • By Sales Channel
    • Key Takeaways
  14. Eastern Europe Market Analysis 2020 to 2024 and Forecast 2025 to 2035, By Country
    • Historical Market Size Value (USD Million) Trend Analysis By Market Taxonomy, 2020 to 2024
    • Market Size Value (USD Million) Forecast By Market Taxonomy, 2025 to 2035
      • By Country
        • Russia
        • Poland
        • Hungary
        • Balkan & Baltic
        • Rest of Eastern Europe
      • By Product Type
      • By Formulation Type
      • By Application
      • By Sales Channel
    • Market Attractiveness Analysis
      • By Country
      • By Product Type
      • By Formulation Type
      • By Application
      • By Sales Channel
    • Key Takeaways
  15. East Asia Market Analysis 2020 to 2024 and Forecast 2025 to 2035, By Country
    • Historical Market Size Value (USD Million) Trend Analysis By Market Taxonomy, 2020 to 2024
    • Market Size Value (USD Million) Forecast By Market Taxonomy, 2025 to 2035
      • By Country
        • China
        • Japan
        • South Korea
      • By Product Type
      • By Formulation Type
      • By Application
      • By Sales Channel
    • Market Attractiveness Analysis
      • By Country
      • By Product Type
      • By Formulation Type
      • By Application
      • By Sales Channel
    • Key Takeaways
  16. South Asia and Pacific Market Analysis 2020 to 2024 and Forecast 2025 to 2035, By Country
    • Historical Market Size Value (USD Million) Trend Analysis By Market Taxonomy, 2020 to 2024
    • Market Size Value (USD Million) Forecast By Market Taxonomy, 2025 to 2035
      • By Country
        • India
        • ASEAN
        • Australia & New Zealand
        • Rest of South Asia and Pacific
      • By Product Type
      • By Formulation Type
      • By Application
      • By Sales Channel
    • Market Attractiveness Analysis
      • By Country
      • By Product Type
      • By Formulation Type
      • By Application
      • By Sales Channel
    • Key Takeaways
  17. Middle East & Africa Market Analysis 2020 to 2024 and Forecast 2025 to 2035, By Country
    • Historical Market Size Value (USD Million) Trend Analysis By Market Taxonomy, 2020 to 2024
    • Market Size Value (USD Million) Forecast By Market Taxonomy, 2025 to 2035
      • By Country
        • Kingdom of Saudi Arabia
        • Other GCC Countries
        • Turkiye
        • South Africa
        • Other African Union
        • Rest of Middle East & Africa
      • By Product Type
      • By Formulation Type
      • By Application
      • By Sales Channel
    • Market Attractiveness Analysis
      • By Country
      • By Product Type
      • By Formulation Type
      • By Application
      • By Sales Channel
    • Key Takeaways
  18. Key Countries Market Analysis
    • USA
      • Pricing Analysis
      • Market Share Analysis, 2024
        • By Product Type
        • By Formulation Type
        • By Application
        • By Sales Channel
    • Canada
      • Pricing Analysis
      • Market Share Analysis, 2024
        • By Product Type
        • By Formulation Type
        • By Application
        • By Sales Channel
    • Mexico
      • Pricing Analysis
      • Market Share Analysis, 2024
        • By Product Type
        • By Formulation Type
        • By Application
        • By Sales Channel
    • Brazil
      • Pricing Analysis
      • Market Share Analysis, 2024
        • By Product Type
        • By Formulation Type
        • By Application
        • By Sales Channel
    • Chile
      • Pricing Analysis
      • Market Share Analysis, 2024
        • By Product Type
        • By Formulation Type
        • By Application
        • By Sales Channel
    • Germany
      • Pricing Analysis
      • Market Share Analysis, 2024
        • By Product Type
        • By Formulation Type
        • By Application
        • By Sales Channel
    • UK
      • Pricing Analysis
      • Market Share Analysis, 2024
        • By Product Type
        • By Formulation Type
        • By Application
        • By Sales Channel
    • Italy
      • Pricing Analysis
      • Market Share Analysis, 2024
        • By Product Type
        • By Formulation Type
        • By Application
        • By Sales Channel
    • Spain
      • Pricing Analysis
      • Market Share Analysis, 2024
        • By Product Type
        • By Formulation Type
        • By Application
        • By Sales Channel
    • France
      • Pricing Analysis
      • Market Share Analysis, 2024
        • By Product Type
        • By Formulation Type
        • By Application
        • By Sales Channel
    • India
      • Pricing Analysis
      • Market Share Analysis, 2024
        • By Product Type
        • By Formulation Type
        • By Application
        • By Sales Channel
    • ASEAN
      • Pricing Analysis
      • Market Share Analysis, 2024
        • By Product Type
        • By Formulation Type
        • By Application
        • By Sales Channel
    • Australia & New Zealand
      • Pricing Analysis
      • Market Share Analysis, 2024
        • By Product Type
        • By Formulation Type
        • By Application
        • By Sales Channel
    • China
      • Pricing Analysis
      • Market Share Analysis, 2024
        • By Product Type
        • By Formulation Type
        • By Application
        • By Sales Channel
    • Japan
      • Pricing Analysis
      • Market Share Analysis, 2024
        • By Product Type
        • By Formulation Type
        • By Application
        • By Sales Channel
    • South Korea
      • Pricing Analysis
      • Market Share Analysis, 2024
        • By Product Type
        • By Formulation Type
        • By Application
        • By Sales Channel
    • Russia
      • Pricing Analysis
      • Market Share Analysis, 2024
        • By Product Type
        • By Formulation Type
        • By Application
        • By Sales Channel
    • Poland
      • Pricing Analysis
      • Market Share Analysis, 2024
        • By Product Type
        • By Formulation Type
        • By Application
        • By Sales Channel
    • Hungary
      • Pricing Analysis
      • Market Share Analysis, 2024
        • By Product Type
        • By Formulation Type
        • By Application
        • By Sales Channel
    • Kingdom of Saudi Arabia
      • Pricing Analysis
      • Market Share Analysis, 2024
        • By Product Type
        • By Formulation Type
        • By Application
        • By Sales Channel
    • Turkiye
      • Pricing Analysis
      • Market Share Analysis, 2024
        • By Product Type
        • By Formulation Type
        • By Application
        • By Sales Channel
    • South Africa
      • Pricing Analysis
      • Market Share Analysis, 2024
        • By Product Type
        • By Formulation Type
        • By Application
        • By Sales Channel
  19. Market Structure Analysis
    • Competition Dashboard
    • Competition Benchmarking
    • Market Share Analysis of Top Players
      • By Regional
      • By Product Type
      • By Formulation Type
      • By Application
      • By Sales Channel
  20. Competition Analysis
    • Competition Deep Dive
      • Pfizer Inc.
        • Overview
        • Product Portfolio
        • Profitability by Market Segments (Product/Age /Sales Channel/Region)
        • Sales Footprint
        • Strategy Overview
          • Marketing Strategy
          • Product Strategy
          • Channel Strategy
      • Mallinckrodt Pharmaceuticals
      • Teva Pharmaceutical Industries Ltd.
      • Johnson & Johnson
      • NOW Foods
      • Purdue Pharma L.P.
      • Sun Pharmaceutical Industries Ltd.
      • Endo Pharmaceuticals Inc.
      • GW Pharmaceuticals (Jazz Pharmaceuticals)
      • Canopy Growth Corporation
      • Charlotte's Web Holdings, Inc.
      • Tilray Brands, Inc.
      • Curaleaf Holdings, Inc.
      • Hikma Pharmaceuticals PLC
      • Amneal Pharmaceuticals, Inc.
  21. Assumptions & Acronyms Used
  22. Research Methodology

List of Tables

  • Table 1: Global Market Value (USD Million) Forecast by Region, 2020 to 2035
  • Table 2: Global Market Value (USD Million) Forecast by Product Type , 2020 to 2035
  • Table 3: Global Market Value (USD Million) Forecast by Formulation Type, 2020 to 2035
  • Table 4: Global Market Value (USD Million) Forecast by Application, 2020 to 2035
  • Table 5: Global Market Value (USD Million) Forecast by Sales Channel, 2020 to 2035
  • Table 6: North America Market Value (USD Million) Forecast by Country, 2020 to 2035
  • Table 7: North America Market Value (USD Million) Forecast by Product Type , 2020 to 2035
  • Table 8: North America Market Value (USD Million) Forecast by Formulation Type, 2020 to 2035
  • Table 9: North America Market Value (USD Million) Forecast by Application, 2020 to 2035
  • Table 10: North America Market Value (USD Million) Forecast by Sales Channel, 2020 to 2035
  • Table 11: Latin America Market Value (USD Million) Forecast by Country, 2020 to 2035
  • Table 12: Latin America Market Value (USD Million) Forecast by Product Type , 2020 to 2035
  • Table 13: Latin America Market Value (USD Million) Forecast by Formulation Type, 2020 to 2035
  • Table 14: Latin America Market Value (USD Million) Forecast by Application, 2020 to 2035
  • Table 15: Latin America Market Value (USD Million) Forecast by Sales Channel, 2020 to 2035
  • Table 16: Western Europe Market Value (USD Million) Forecast by Country, 2020 to 2035
  • Table 17: Western Europe Market Value (USD Million) Forecast by Product Type , 2020 to 2035
  • Table 18: Western Europe Market Value (USD Million) Forecast by Formulation Type, 2020 to 2035
  • Table 19: Western Europe Market Value (USD Million) Forecast by Application, 2020 to 2035
  • Table 20: Western Europe Market Value (USD Million) Forecast by Sales Channel, 2020 to 2035
  • Table 21: Eastern Europe Market Value (USD Million) Forecast by Country, 2020 to 2035
  • Table 22: Eastern Europe Market Value (USD Million) Forecast by Product Type , 2020 to 2035
  • Table 23: Eastern Europe Market Value (USD Million) Forecast by Formulation Type, 2020 to 2035
  • Table 24: Eastern Europe Market Value (USD Million) Forecast by Application, 2020 to 2035
  • Table 25: Eastern Europe Market Value (USD Million) Forecast by Sales Channel, 2020 to 2035
  • Table 26: East Asia Market Value (USD Million) Forecast by Country, 2020 to 2035
  • Table 27: East Asia Market Value (USD Million) Forecast by Product Type , 2020 to 2035
  • Table 28: East Asia Market Value (USD Million) Forecast by Formulation Type, 2020 to 2035
  • Table 29: East Asia Market Value (USD Million) Forecast by Application, 2020 to 2035
  • Table 30: East Asia Market Value (USD Million) Forecast by Sales Channel, 2020 to 2035
  • Table 31: South Asia and Pacific Market Value (USD Million) Forecast by Country, 2020 to 2035
  • Table 32: South Asia and Pacific Market Value (USD Million) Forecast by Product Type , 2020 to 2035
  • Table 33: South Asia and Pacific Market Value (USD Million) Forecast by Formulation Type, 2020 to 2035
  • Table 34: South Asia and Pacific Market Value (USD Million) Forecast by Application, 2020 to 2035
  • Table 35: South Asia and Pacific Market Value (USD Million) Forecast by Sales Channel, 2020 to 2035
  • Table 36: Middle East & Africa Market Value (USD Million) Forecast by Country, 2020 to 2035
  • Table 37: Middle East & Africa Market Value (USD Million) Forecast by Product Type , 2020 to 2035
  • Table 38: Middle East & Africa Market Value (USD Million) Forecast by Formulation Type, 2020 to 2035
  • Table 39: Middle East & Africa Market Value (USD Million) Forecast by Application, 2020 to 2035
  • Table 40: Middle East & Africa Market Value (USD Million) Forecast by Sales Channel, 2020 to 2035

List of Figures

  • Figure 1: Global Market Pricing Analysis
  • Figure 2: Global Market Value (USD Million) Forecast 2020-2035
  • Figure 3: Global Market Value Share and BPS Analysis by Product Type , 2025 and 2035
  • Figure 4: Global Market Y to o to Y Growth Comparison by Product Type , 2025-2035
  • Figure 5: Global Market Attractiveness Analysis by Product Type
  • Figure 6: Global Market Value Share and BPS Analysis by Formulation Type, 2025 and 2035
  • Figure 7: Global Market Y to o to Y Growth Comparison by Formulation Type, 2025-2035
  • Figure 8: Global Market Attractiveness Analysis by Formulation Type
  • Figure 9: Global Market Value Share and BPS Analysis by Application, 2025 and 2035
  • Figure 10: Global Market Y to o to Y Growth Comparison by Application, 2025-2035
  • Figure 11: Global Market Attractiveness Analysis by Application
  • Figure 12: Global Market Value Share and BPS Analysis by Sales Channel, 2025 and 2035
  • Figure 13: Global Market Y to o to Y Growth Comparison by Sales Channel, 2025-2035
  • Figure 14: Global Market Attractiveness Analysis by Sales Channel
  • Figure 15: Global Market Value (USD Million) Share and BPS Analysis by Region, 2025 and 2035
  • Figure 16: Global Market Y to o to Y Growth Comparison by Region, 2025-2035
  • Figure 17: Global Market Attractiveness Analysis by Region
  • Figure 18: North America Market Incremental Dollar Opportunity, 2025-2035
  • Figure 19: Latin America Market Incremental Dollar Opportunity, 2025-2035
  • Figure 20: Western Europe Market Incremental Dollar Opportunity, 2025-2035
  • Figure 21: Eastern Europe Market Incremental Dollar Opportunity, 2025-2035
  • Figure 22: East Asia Market Incremental Dollar Opportunity, 2025-2035
  • Figure 23: South Asia and Pacific Market Incremental Dollar Opportunity, 2025-2035
  • Figure 24: Middle East & Africa Market Incremental Dollar Opportunity, 2025-2035
  • Figure 25: North America Market Value Share and BPS Analysis by Country, 2025 and 2035
  • Figure 26: North America Market Value Share and BPS Analysis by Product Type , 2025 and 2035
  • Figure 27: North America Market Y to o to Y Growth Comparison by Product Type , 2025-2035
  • Figure 28: North America Market Attractiveness Analysis by Product Type
  • Figure 29: North America Market Value Share and BPS Analysis by Formulation Type, 2025 and 2035
  • Figure 30: North America Market Y to o to Y Growth Comparison by Formulation Type, 2025-2035
  • Figure 31: North America Market Attractiveness Analysis by Formulation Type
  • Figure 32: North America Market Value Share and BPS Analysis by Application, 2025 and 2035
  • Figure 33: North America Market Y to o to Y Growth Comparison by Application, 2025-2035
  • Figure 34: North America Market Attractiveness Analysis by Application
  • Figure 35: North America Market Value Share and BPS Analysis by Sales Channel, 2025 and 2035
  • Figure 36: North America Market Y to o to Y Growth Comparison by Sales Channel, 2025-2035
  • Figure 37: North America Market Attractiveness Analysis by Sales Channel
  • Figure 38: Latin America Market Value Share and BPS Analysis by Country, 2025 and 2035
  • Figure 39: Latin America Market Value Share and BPS Analysis by Product Type , 2025 and 2035
  • Figure 40: Latin America Market Y to o to Y Growth Comparison by Product Type , 2025-2035
  • Figure 41: Latin America Market Attractiveness Analysis by Product Type
  • Figure 42: Latin America Market Value Share and BPS Analysis by Formulation Type, 2025 and 2035
  • Figure 43: Latin America Market Y to o to Y Growth Comparison by Formulation Type, 2025-2035
  • Figure 44: Latin America Market Attractiveness Analysis by Formulation Type
  • Figure 45: Latin America Market Value Share and BPS Analysis by Application, 2025 and 2035
  • Figure 46: Latin America Market Y to o to Y Growth Comparison by Application, 2025-2035
  • Figure 47: Latin America Market Attractiveness Analysis by Application
  • Figure 48: Latin America Market Value Share and BPS Analysis by Sales Channel, 2025 and 2035
  • Figure 49: Latin America Market Y to o to Y Growth Comparison by Sales Channel, 2025-2035
  • Figure 50: Latin America Market Attractiveness Analysis by Sales Channel
  • Figure 51: Western Europe Market Value Share and BPS Analysis by Country, 2025 and 2035
  • Figure 52: Western Europe Market Value Share and BPS Analysis by Product Type , 2025 and 2035
  • Figure 53: Western Europe Market Y to o to Y Growth Comparison by Product Type , 2025-2035
  • Figure 54: Western Europe Market Attractiveness Analysis by Product Type
  • Figure 55: Western Europe Market Value Share and BPS Analysis by Formulation Type, 2025 and 2035
  • Figure 56: Western Europe Market Y to o to Y Growth Comparison by Formulation Type, 2025-2035
  • Figure 57: Western Europe Market Attractiveness Analysis by Formulation Type
  • Figure 58: Western Europe Market Value Share and BPS Analysis by Application, 2025 and 2035
  • Figure 59: Western Europe Market Y to o to Y Growth Comparison by Application, 2025-2035
  • Figure 60: Western Europe Market Attractiveness Analysis by Application
  • Figure 61: Western Europe Market Value Share and BPS Analysis by Sales Channel, 2025 and 2035
  • Figure 62: Western Europe Market Y to o to Y Growth Comparison by Sales Channel, 2025-2035
  • Figure 63: Western Europe Market Attractiveness Analysis by Sales Channel
  • Figure 64: Eastern Europe Market Value Share and BPS Analysis by Country, 2025 and 2035
  • Figure 65: Eastern Europe Market Value Share and BPS Analysis by Product Type , 2025 and 2035
  • Figure 66: Eastern Europe Market Y to o to Y Growth Comparison by Product Type , 2025-2035
  • Figure 67: Eastern Europe Market Attractiveness Analysis by Product Type
  • Figure 68: Eastern Europe Market Value Share and BPS Analysis by Formulation Type, 2025 and 2035
  • Figure 69: Eastern Europe Market Y to o to Y Growth Comparison by Formulation Type, 2025-2035
  • Figure 70: Eastern Europe Market Attractiveness Analysis by Formulation Type
  • Figure 71: Eastern Europe Market Value Share and BPS Analysis by Application, 2025 and 2035
  • Figure 72: Eastern Europe Market Y to o to Y Growth Comparison by Application, 2025-2035
  • Figure 73: Eastern Europe Market Attractiveness Analysis by Application
  • Figure 74: Eastern Europe Market Value Share and BPS Analysis by Sales Channel, 2025 and 2035
  • Figure 75: Eastern Europe Market Y to o to Y Growth Comparison by Sales Channel, 2025-2035
  • Figure 76: Eastern Europe Market Attractiveness Analysis by Sales Channel
  • Figure 77: East Asia Market Value Share and BPS Analysis by Country, 2025 and 2035
  • Figure 78: East Asia Market Value Share and BPS Analysis by Product Type , 2025 and 2035
  • Figure 79: East Asia Market Y to o to Y Growth Comparison by Product Type , 2025-2035
  • Figure 80: East Asia Market Attractiveness Analysis by Product Type
  • Figure 81: East Asia Market Value Share and BPS Analysis by Formulation Type, 2025 and 2035
  • Figure 82: East Asia Market Y to o to Y Growth Comparison by Formulation Type, 2025-2035
  • Figure 83: East Asia Market Attractiveness Analysis by Formulation Type
  • Figure 84: East Asia Market Value Share and BPS Analysis by Application, 2025 and 2035
  • Figure 85: East Asia Market Y to o to Y Growth Comparison by Application, 2025-2035
  • Figure 86: East Asia Market Attractiveness Analysis by Application
  • Figure 87: East Asia Market Value Share and BPS Analysis by Sales Channel, 2025 and 2035
  • Figure 88: East Asia Market Y to o to Y Growth Comparison by Sales Channel, 2025-2035
  • Figure 89: East Asia Market Attractiveness Analysis by Sales Channel
  • Figure 90: South Asia and Pacific Market Value Share and BPS Analysis by Country, 2025 and 2035
  • Figure 91: South Asia and Pacific Market Value Share and BPS Analysis by Product Type , 2025 and 2035
  • Figure 92: South Asia and Pacific Market Y to o to Y Growth Comparison by Product Type , 2025-2035
  • Figure 93: South Asia and Pacific Market Attractiveness Analysis by Product Type
  • Figure 94: South Asia and Pacific Market Value Share and BPS Analysis by Formulation Type, 2025 and 2035
  • Figure 95: South Asia and Pacific Market Y to o to Y Growth Comparison by Formulation Type, 2025-2035
  • Figure 96: South Asia and Pacific Market Attractiveness Analysis by Formulation Type
  • Figure 97: South Asia and Pacific Market Value Share and BPS Analysis by Application, 2025 and 2035
  • Figure 98: South Asia and Pacific Market Y to o to Y Growth Comparison by Application, 2025-2035
  • Figure 99: South Asia and Pacific Market Attractiveness Analysis by Application
  • Figure 100: South Asia and Pacific Market Value Share and BPS Analysis by Sales Channel, 2025 and 2035
  • Figure 101: South Asia and Pacific Market Y to o to Y Growth Comparison by Sales Channel, 2025-2035
  • Figure 102: South Asia and Pacific Market Attractiveness Analysis by Sales Channel
  • Figure 103: Middle East & Africa Market Value Share and BPS Analysis by Country, 2025 and 2035
  • Figure 104: Middle East & Africa Market Value Share and BPS Analysis by Product Type , 2025 and 2035
  • Figure 105: Middle East & Africa Market Y to o to Y Growth Comparison by Product Type , 2025-2035
  • Figure 106: Middle East & Africa Market Attractiveness Analysis by Product Type
  • Figure 107: Middle East & Africa Market Value Share and BPS Analysis by Formulation Type, 2025 and 2035
  • Figure 108: Middle East & Africa Market Y to o to Y Growth Comparison by Formulation Type, 2025-2035
  • Figure 109: Middle East & Africa Market Attractiveness Analysis by Formulation Type
  • Figure 110: Middle East & Africa Market Value Share and BPS Analysis by Application, 2025 and 2035
  • Figure 111: Middle East & Africa Market Y to o to Y Growth Comparison by Application, 2025-2035
  • Figure 112: Middle East & Africa Market Attractiveness Analysis by Application
  • Figure 113: Middle East & Africa Market Value Share and BPS Analysis by Sales Channel, 2025 and 2035
  • Figure 114: Middle East & Africa Market Y to o to Y Growth Comparison by Sales Channel, 2025-2035
  • Figure 115: Middle East & Africa Market Attractiveness Analysis by Sales Channel
  • Figure 116: Global Market - Tier Structure Analysis
  • Figure 117: Global Market - Company Share Analysis
Dashboard
Dashboard
Dashboard
Dashboard
Dashboard
Dashboard

Full Research Suite comprises of:

Market outlook & trends analysis

Market outlook & trends analysis

Interviews & case studies

Interviews & case studies

Strategic recommendations

Strategic recommendations

Vendor profiles & capabilities analysis

Vendor profiles & capabilities analysis

5-year forecasts

5-year forecasts

8 regions and 60+ country-level data splits

8 regions and 60+ country-level data splits

Market segment data splits

Market segment data splits

12 months of continuous data updates

12 months of continuous data updates

DELIVERED AS:

PDF EXCEL ONLINE

Full Research Suite


$5000

$7500

$10000

Buy Report Now
Similar Industry Reports

Similar Industry Reports

Plant Genome Extraction Kit Market

Plant Genome Extraction Kit Market Size and Share Forecast Outlook 2025 to 2035

Plant Based Beverage Market

Plant Based Beverage Market Forecast and Outlook 2025 to 2035

Plant-based Body Paint Pigments Market

Plant-based Body Paint Pigments Market Size and Share Forecast Outlook 2025 to 2035

Plant Based Plastic Market

Plant Based Plastic Market Forecast and Outlook 2025 to 2035

Plant Stem Cell Encapsulation Market

Plant Stem Cell Encapsulation Market Analysis - Size and Share Forecast Outlook 2025 to 2035

Plant Stem Cell Skincare Product Market

Plant Stem Cell Skincare Product Market Size and Share Forecast Outlook 2025 to 2035

Plant-based Cheese Market

Plant-based Cheese Market Size and Share Forecast Outlook 2025 to 2035

Plant Based Meat Packaging Market

Plant Based Meat Packaging Market Size and Share Forecast Outlook 2025 to 2035

Plant Sterol Supplements Market

Plant Sterol Supplements Market Size and Share Forecast Outlook 2025 to 2035

Plant Protein Hydrolysate Market

Plant Protein Hydrolysate Market Size and Share Forecast Outlook 2025 to 2035

Plant Asset Management Market

Plant Asset Management Market Size and Share Forecast Outlook 2025 to 2035

Plant Peptides Market

Plant Peptides Market Size and Share Forecast Outlook 2025 to 2035

Plant-Based Foam Market

Plant-Based Foam Market Size and Share Forecast Outlook 2025 to 2035

Planting Machinery Market

Planting Machinery Market Size and Share Forecast Outlook 2025 to 2035

Plant-based Snacks Market

Plant-based Snacks Market Analysis - Size, Share, and Forecast Outlook 2025 to 2035

Plant Based Meals Market

Plant Based Meals Market Size and Share Forecast Outlook 2025 to 2035

Plant-Based Squalane Market

Plant-Based Squalane Market Analysis - Size and Share Forecast Outlook 2025 to 2035

Plant Breeding Market

Plant Breeding Market Size and Share Forecast Outlook 2025 to 2035

Plant-Based Protein Processing Equipment Market

Plant-Based Protein Processing Equipment Market Size and Share Forecast Outlook 2025 to 2035

Plant-Powered Exfoliants Market

Plant-Powered Exfoliants Market Analysis - Size and Share Forecast Outlook 2025 to 2035

Future Market Insights

Plant Derived Analgesics Market

Chat With MaRIA

Chat With

MaRIA

Hi There, I am MaRIA, Your Market Research Intelligence Assistant. How may I help you?